| Param | Original file | Final file |
|---|---|---|
| Filename | modeM0/AS1C07_015T01_9000005256_37005cztM0_level2.evt | modeM0/AS1C07_015T01_9000005256_37005cztM0_level2_quad_clean.evt |
| Size (bytes) | 467,752,320 | 107,118,720 |
| Size | 446.1 MB | 102.2 MB |
| Events in quadrant A | 3,098,102 | 705,807 |
| Events in quadrant B | 3,353,570 | 709,423 |
| Events in quadrant C | 3,170,763 | 706,247 |
| Events in quadrant D | 4,104,372 | 671,819 |
| Mode M9 | |||
|---|---|---|---|
| Quadrant | BADHDUFLAG | Total packets | Discarded packets |
| A | 0 | 26 | 0 |
| B | 0 | 26 | 0 |
| C | 0 | 26 | 0 |
| D | 0 | 26 | 0 |
| Mode SS | |||
|---|---|---|---|
| Quadrant | BADHDUFLAG | Total packets | Discarded packets |
| A | 0 | 134 | 0 |
| B | 0 | 134 | 0 |
| C | 0 | 134 | 0 |
| D | 0 | 134 | 0 |
| Mode M0 | |||
|---|---|---|---|
| Quadrant | BADHDUFLAG | Total packets | Discarded packets |
| A | 0 | 13420 | 3 |
| B | 0 | 14362 | 2 |
| C | 0 | 13549 | 2 |
| D | 0 | 16878 | 2 |
| Quadrant | Total seconds | Saturated seconds | Saturation percentage |
|---|---|---|---|
| A | 6462 | 6 | 0.092851% |
| B | 6462 | 63 | 0.974930% |
| C | 6462 | 19 | 0.294027% |
| D | 6462 | 184 | 2.847416% |
Noise dominated data is calculated using 1-second bins in cleaned event files. If a bin has >2000 counts, and if more than 50% of those come from <1% of pixels, then it is considered to be noise-dominated and hence unusable.
| Quadrant | # 1 sec bins | Bins with >0 counts | Bins with >2000 counts | High rate bins dominated by noise | Noise dominated (total time) | Noise dominated (detector-on time) | Marked lightcurve |
|---|---|---|---|---|---|---|---|
| A | 9088 | 6464 | 0 | 0 | 0.00% | 0.00% | 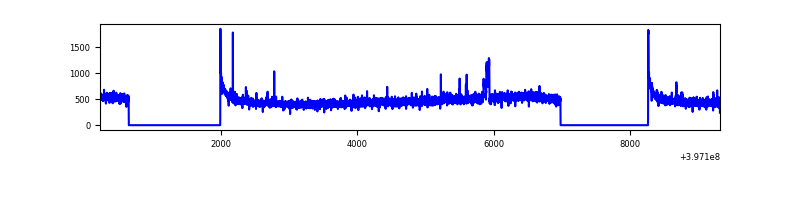 |
| B | 9088 | 6464 | 39 | 39 | 0.43% | 0.60% | 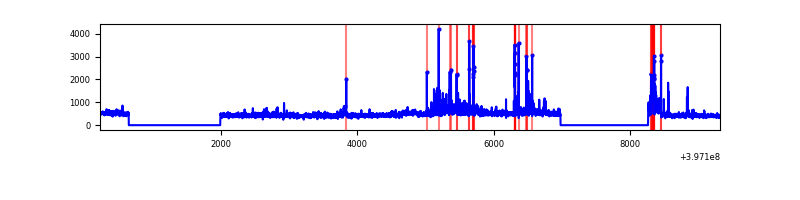 |
| C | 9088 | 6464 | 12 | 12 | 0.13% | 0.19% | 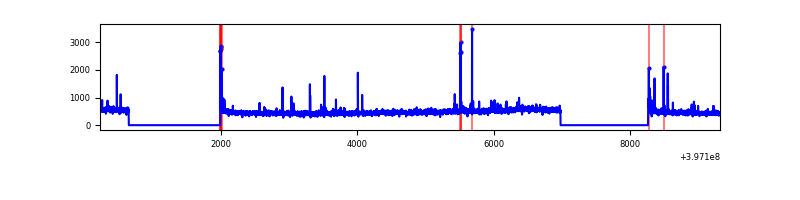 |
| D | 9088 | 6464 | 165 | 165 | 1.82% | 2.55% | 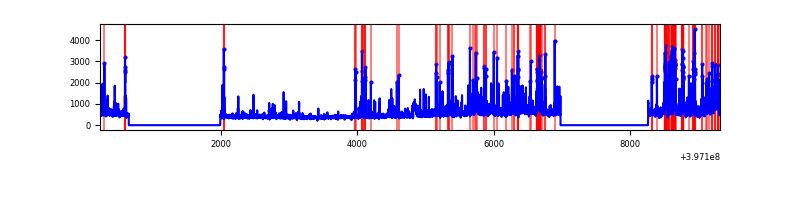 |
Top three noisy pixels from each quadrant. If the there are fewer than three noisy pixels in the level2.evt file, extra rows are filled as -1
| Pixel properties | Quadrant properties | ||||||
|---|---|---|---|---|---|---|---|
| Quadrant | DetID | PixID | Counts | Sigma | Mean | Median | Sigma |
| A | 10 | 83 | 256347 | 1764.18 | 714 | 700 | 144.9 |
| A | 15 | 174 | 38796 | 262.89 | 714 | 700 | 144.9 |
| A | 13 | 6 | 13111 | 85.65 | 714 | 700 | 144.9 |
| B | 5 | 184 | 150265 | 1095.78 | 710 | 689 | 136.5 |
| B | 5 | 172 | 131093 | 955.33 | 710 | 689 | 136.5 |
| B | 0 | 213 | 113580 | 827.03 | 710 | 689 | 136.5 |
| C | 15 | 214 | 277815 | 1704.69 | 697 | 702 | 162.6 |
| C | 0 | 10 | 69008 | 420.19 | 697 | 702 | 162.6 |
| C | 14 | 254 | 44797 | 271.25 | 697 | 702 | 162.6 |
| D | 2 | 153 | 509561 | 3018.84 | 693 | 673 | 168.6 |
| D | 1 | 52 | 399172 | 2363.99 | 693 | 673 | 168.6 |
| D | 2 | 250 | 161884 | 956.34 | 693 | 673 | 168.6 |
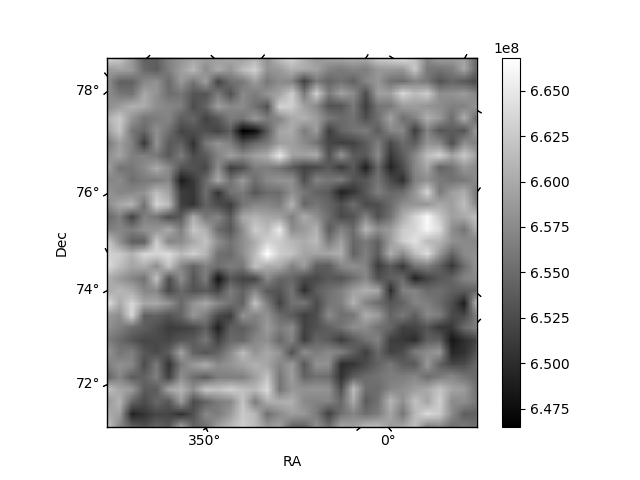
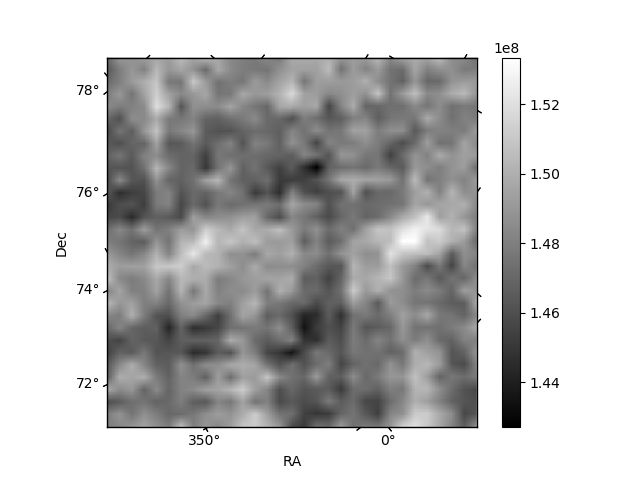
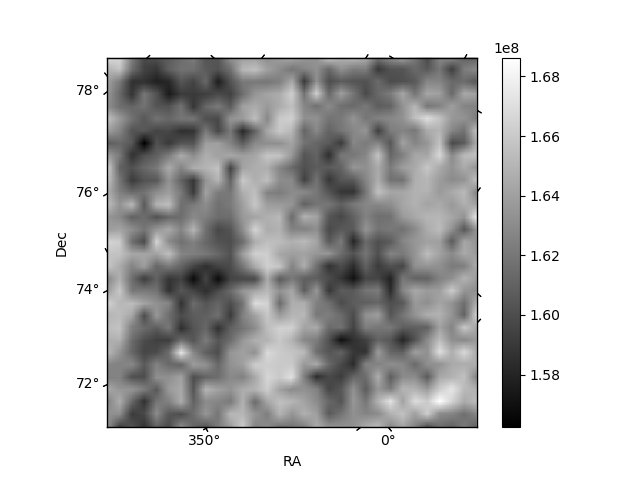
Histogram calculated using DETX and DETY for each event in the final _common_clean file
| Quadrant A | 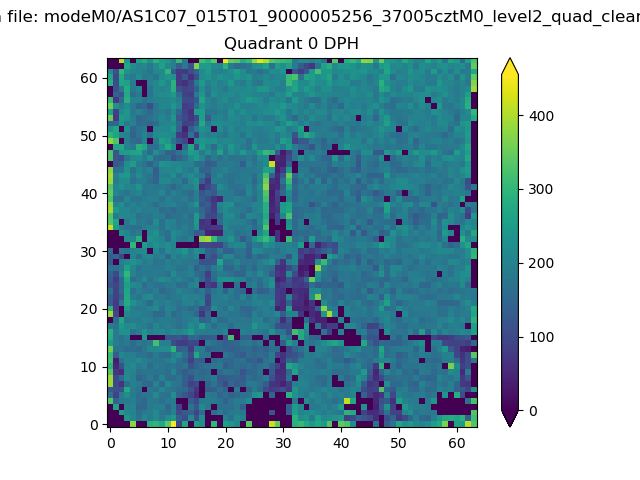 |
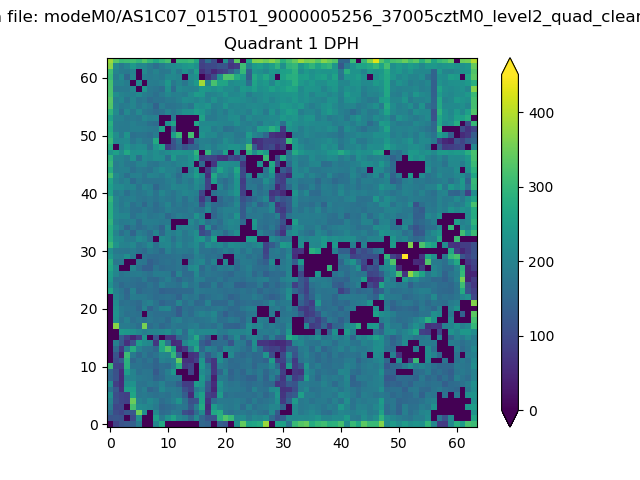 |
Quadrant B |
|---|---|---|---|
| Quadrant D | 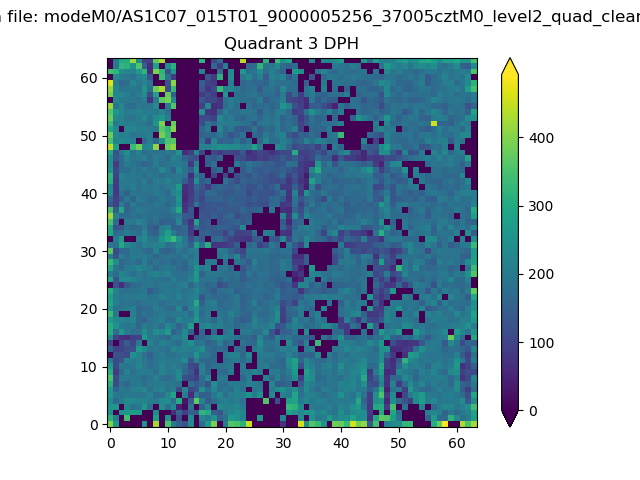 |
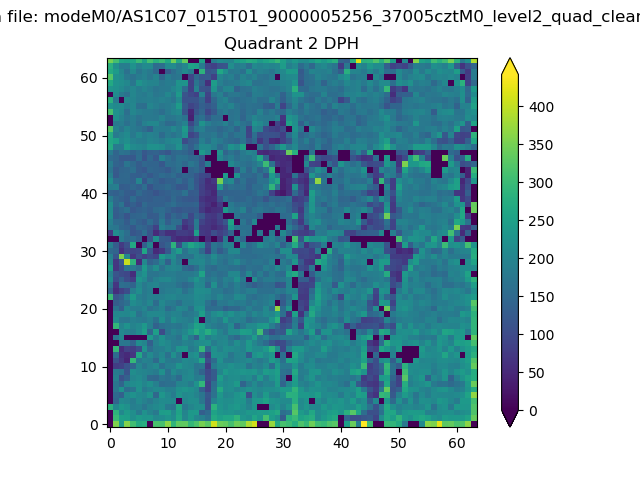 |
Quadrant C |
| Plot type | Count rate plots | Images |
|---|---|---|
| Comparison with Poisson distribution Blue bars denote a histogram of data divided into 1 sec bins. Red curve is a Poisson curve with rate = median count rate of data. |
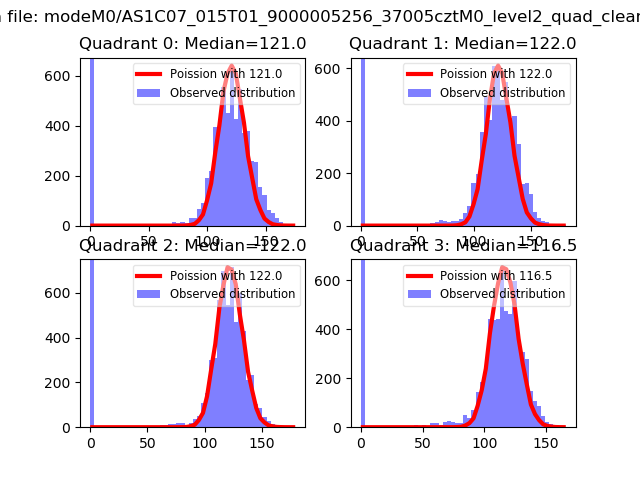 |
 |
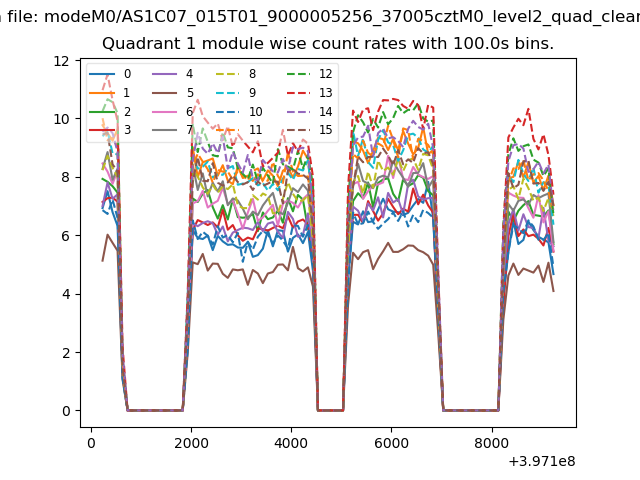
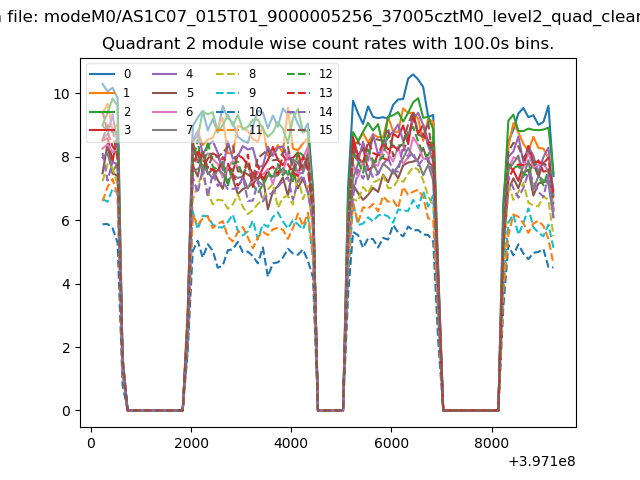
| Quadrant-wise count rates Data is divided into 100 sec bins |
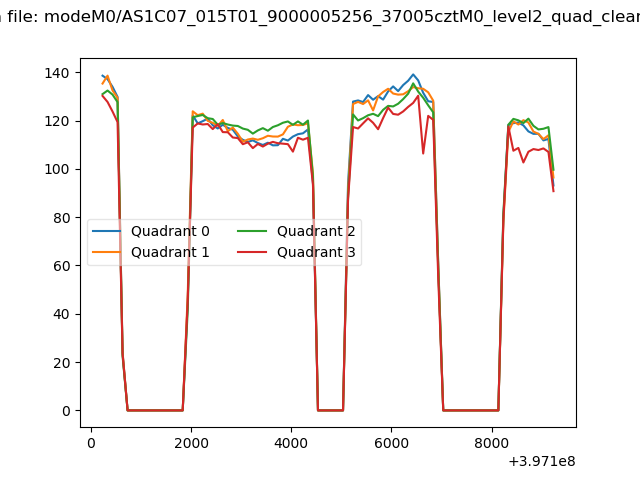 |
|
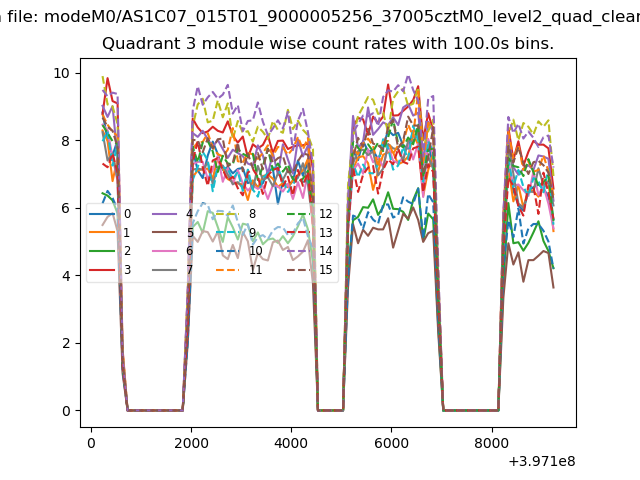
| Module-wise count rates for Quadrant A Data is divided into 100 sec bins |
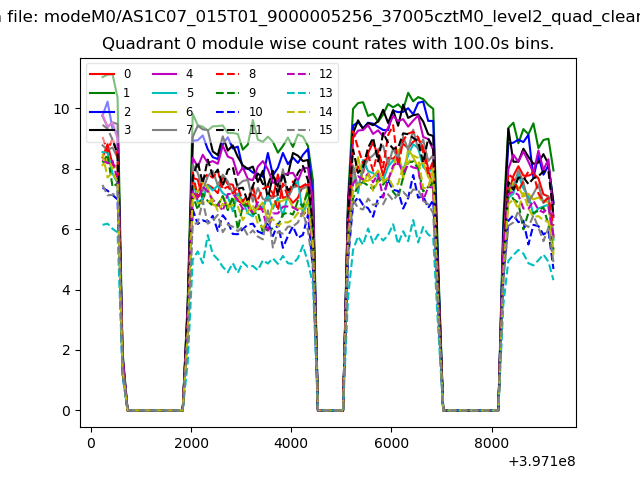 |
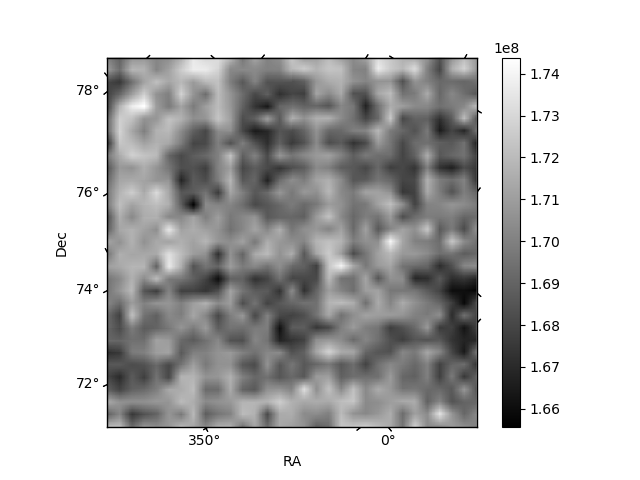 |
| Module-wise count rates for Quadrant B Data is divided into 100 sec bins |
 |
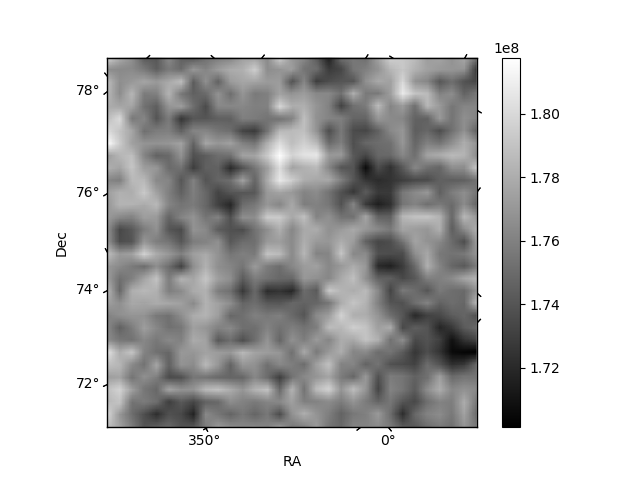 |
| Module-wise count rates for Quadrant C Data is divided into 100 sec bins |
 |
 |
| Module-wise count rates for Quadrant D Data is divided into 100 sec bins |
 |
 |
| Parameter | Plot |
|---|---|
| CZT HV Monitor | 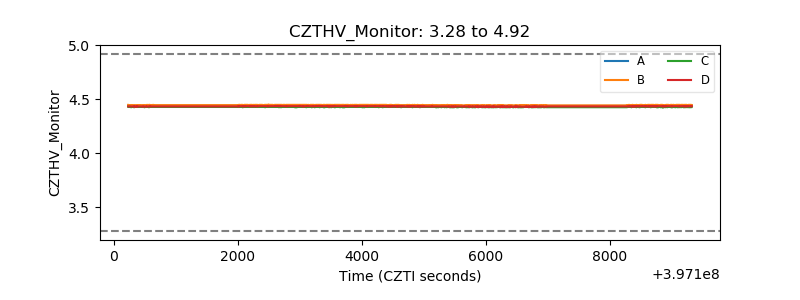 |
| D_VDD | 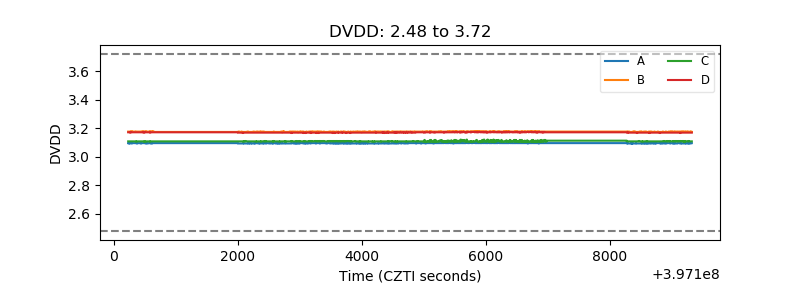 |
| Temperature 1 | 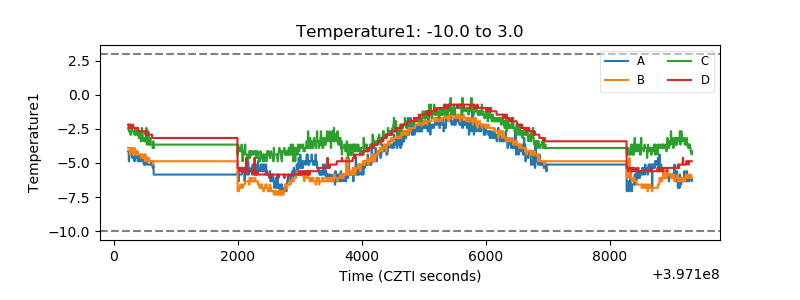 |
| Veto HV Monitor | 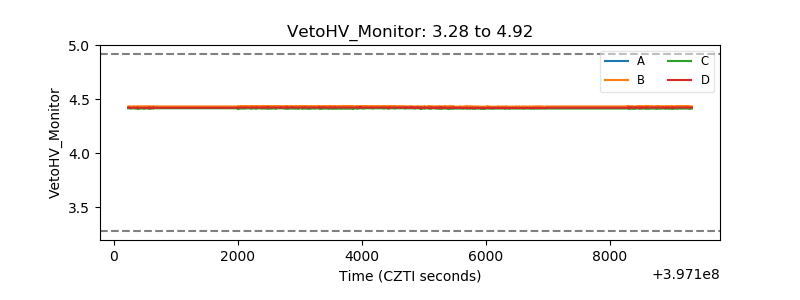 |
| Veto LLD | 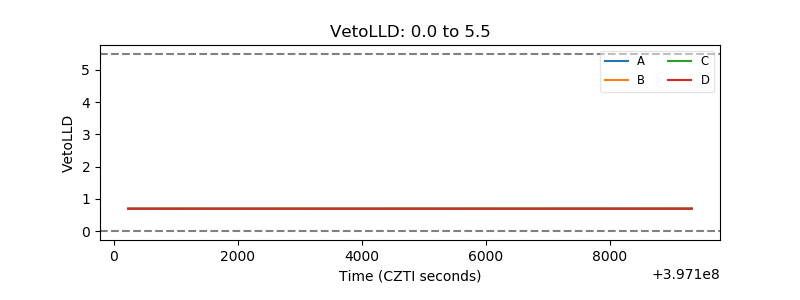 |
| Alpha Counter | 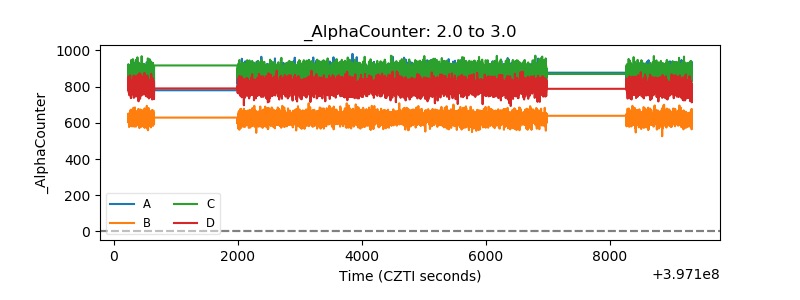 |
| _CPM_Rate | 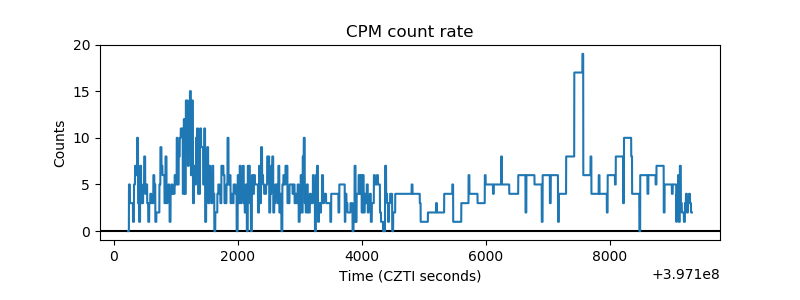 |
| CZT Counter | 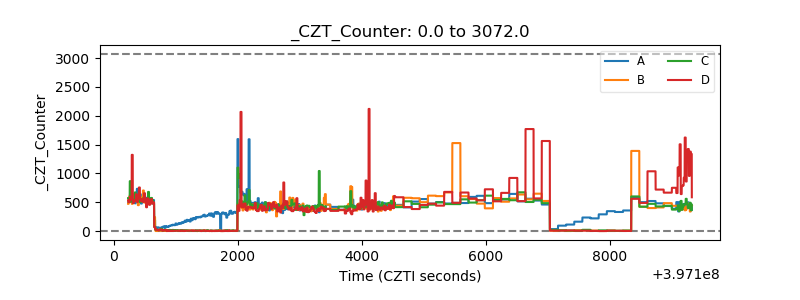 |
| +2.5 Volts monitor | 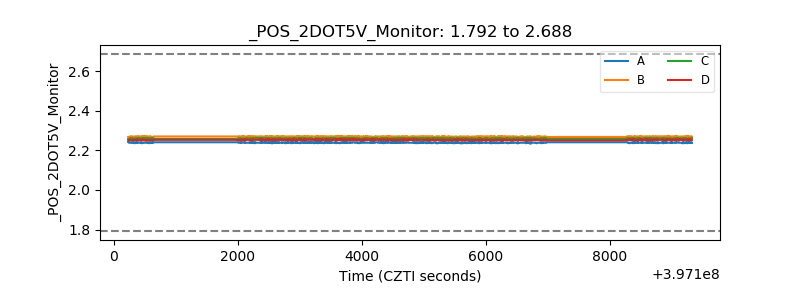 |
| +5 Volts monitor | 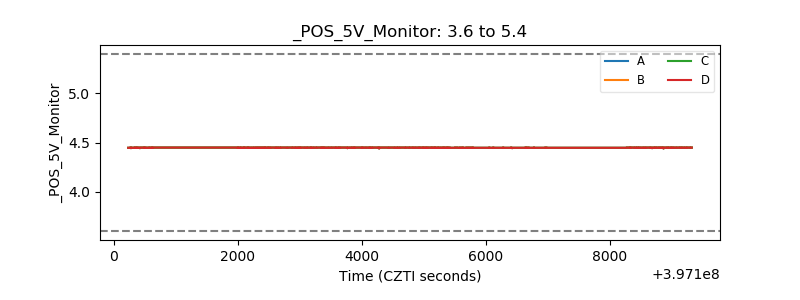 |
| _ROLL_ROT | 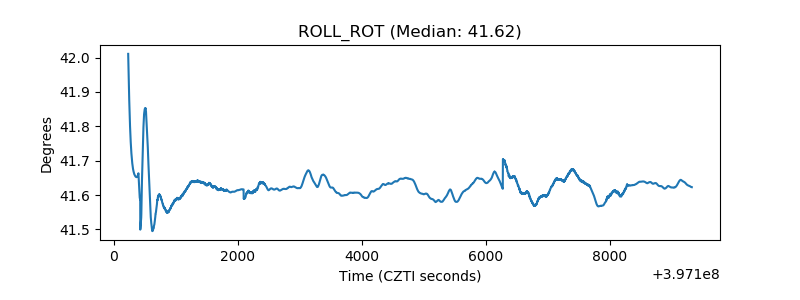 |
| _Roll_DEC | 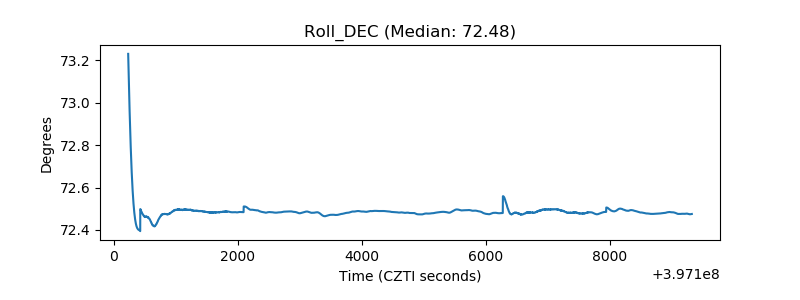 |
| _Roll_RA | 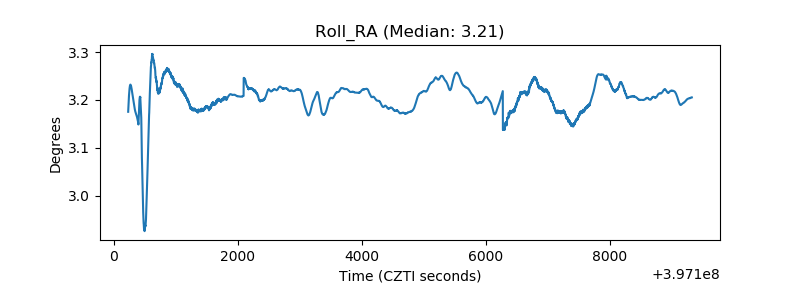 |
| Veto Counter | 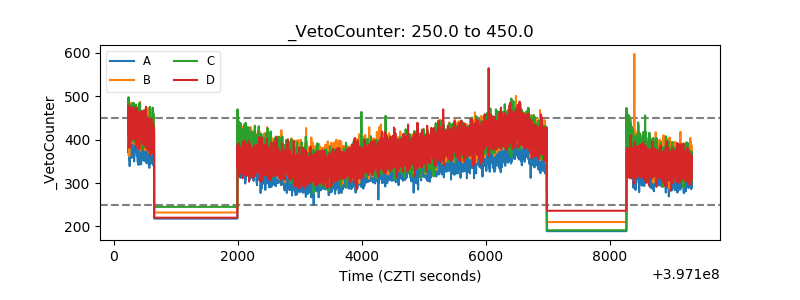 |