| Param | Original file | Final file |
|---|---|---|
| Filename | modeM0/AS1C07_015T01_9000005256_37007cztM0_level2.evt | modeM0/AS1C07_015T01_9000005256_37007cztM0_level2_quad_clean.evt |
| Size (bytes) | 827,674,560 | 147,052,800 |
| Size | 789.3 MB | 140.2 MB |
| Events in quadrant A | 4,466,686 | 985,361 |
| Events in quadrant B | 7,650,453 | 931,109 |
| Events in quadrant C | 4,608,069 | 974,415 |
| Events in quadrant D | 7,706,823 | 911,873 |
| Mode M9 | |||
|---|---|---|---|
| Quadrant | BADHDUFLAG | Total packets | Discarded packets |
| A | 0 | 13 | 0 |
| B | 0 | 13 | 0 |
| C | 0 | 13 | 0 |
| D | 0 | 13 | 0 |
| Mode SS | |||
|---|---|---|---|
| Quadrant | BADHDUFLAG | Total packets | Discarded packets |
| A | 0 | 190 | 0 |
| B | 0 | 190 | 0 |
| C | 0 | 190 | 0 |
| D | 0 | 190 | 0 |
| Mode M0 | |||
|---|---|---|---|
| Quadrant | BADHDUFLAG | Total packets | Discarded packets |
| A | 0 | 19183 | 2 |
| B | 0 | 29179 | 1 |
| C | 0 | 19550 | 1 |
| D | 0 | 29324 | 1 |
| Quadrant | Total seconds | Saturated seconds | Saturation percentage |
|---|---|---|---|
| A | 9377 | 14 | 0.149301% |
| B | 9377 | 1462 | 15.591341% |
| C | 9377 | 9 | 0.095980% |
| D | 9377 | 623 | 6.643916% |
Noise dominated data is calculated using 1-second bins in cleaned event files. If a bin has >2000 counts, and if more than 50% of those come from <1% of pixels, then it is considered to be noise-dominated and hence unusable.
| Quadrant | # 1 sec bins | Bins with >0 counts | Bins with >2000 counts | High rate bins dominated by noise | Noise dominated (total time) | Noise dominated (detector-on time) | Marked lightcurve |
|---|---|---|---|---|---|---|---|
| A | 10689 | 9378 | 8 | 8 | 0.07% | 0.09% | 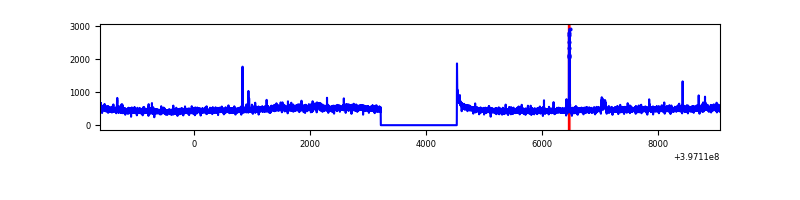 |
| B | 10689 | 9378 | 1098 | 1098 | 10.27% | 11.71% | 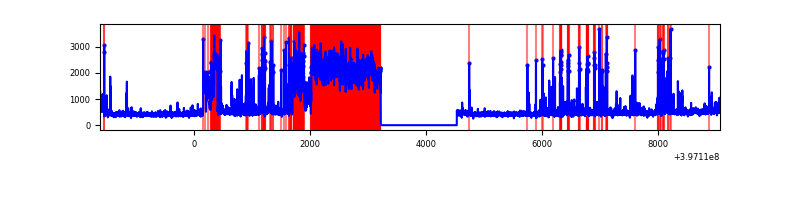 |
| C | 10689 | 9378 | 6 | 6 | 0.06% | 0.06% | 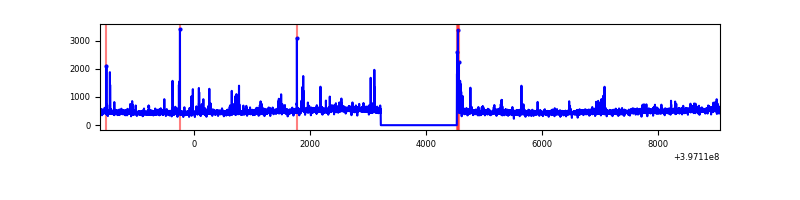 |
| D | 10689 | 9378 | 523 | 523 | 4.89% | 5.58% | 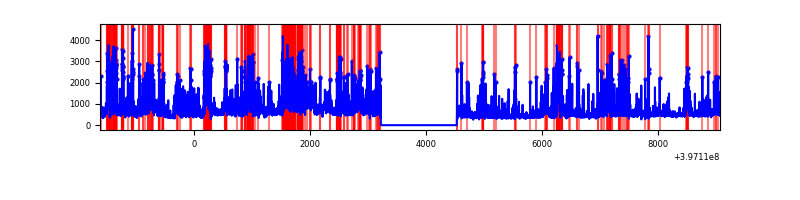 |
Top three noisy pixels from each quadrant. If the there are fewer than three noisy pixels in the level2.evt file, extra rows are filled as -1
| Pixel properties | Quadrant properties | ||||||
|---|---|---|---|---|---|---|---|
| Quadrant | DetID | PixID | Counts | Sigma | Mean | Median | Sigma |
| A | 10 | 83 | 307391 | 1457.92 | 1045 | 1025 | 210.1 |
| A | 12 | 189 | 45966 | 213.86 | 1045 | 1025 | 210.1 |
| A | 15 | 174 | 41382 | 192.05 | 1045 | 1025 | 210.1 |
| B | 5 | 184 | 2715582 | 14218.18 | 994 | 967 | 190.9 |
| B | 5 | 172 | 593962 | 3105.89 | 994 | 967 | 190.9 |
| B | 0 | 213 | 102599 | 532.31 | 994 | 967 | 190.9 |
| C | 15 | 214 | 396865 | 1686.44 | 1015 | 1024 | 234.7 |
| C | 0 | 10 | 76967 | 323.55 | 1015 | 1024 | 234.7 |
| C | 1 | 23 | 44159 | 183.77 | 1015 | 1024 | 234.7 |
| D | 2 | 153 | 839433 | 3464.04 | 998 | 971 | 242.0 |
| D | 1 | 52 | 805447 | 3323.63 | 998 | 971 | 242.0 |
| D | 2 | 250 | 770518 | 3179.33 | 998 | 971 | 242.0 |
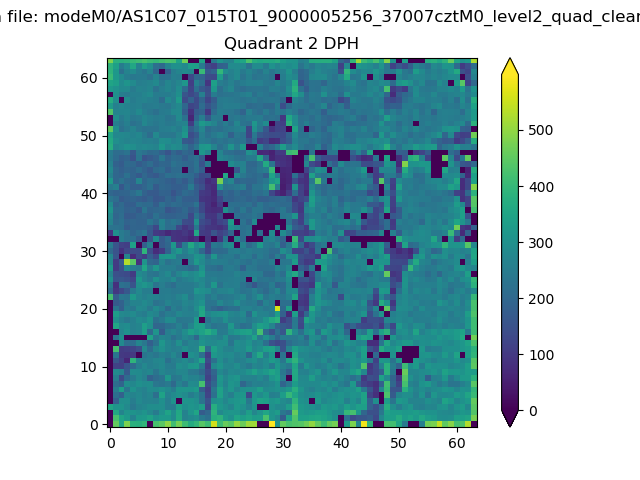
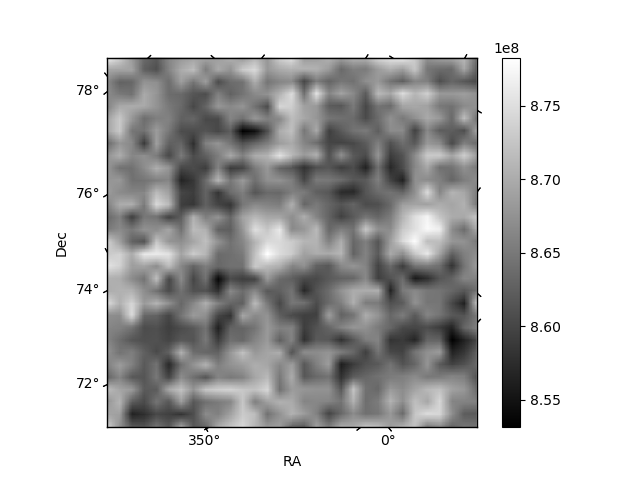
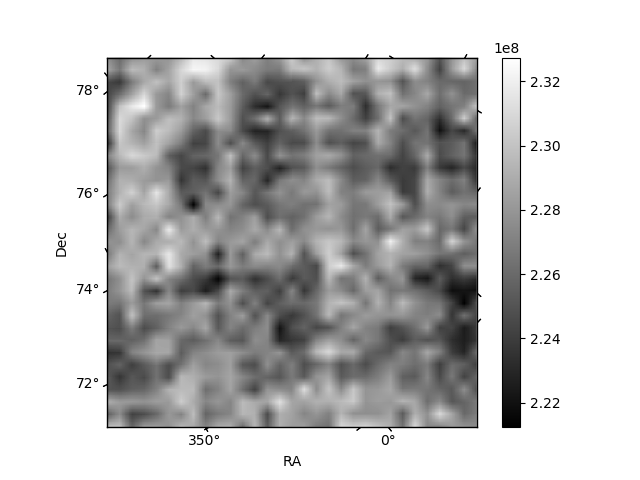
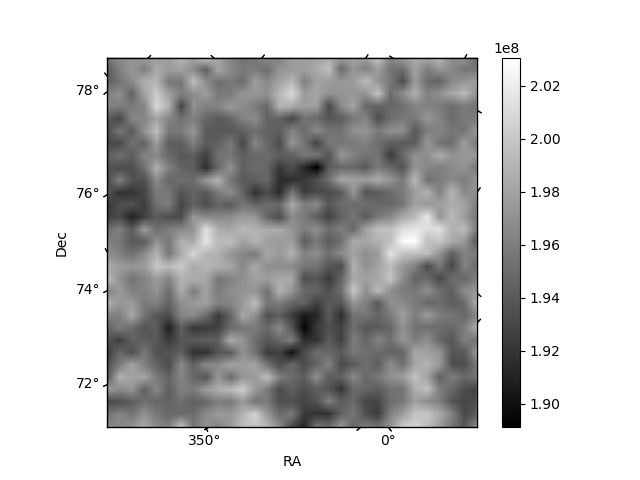
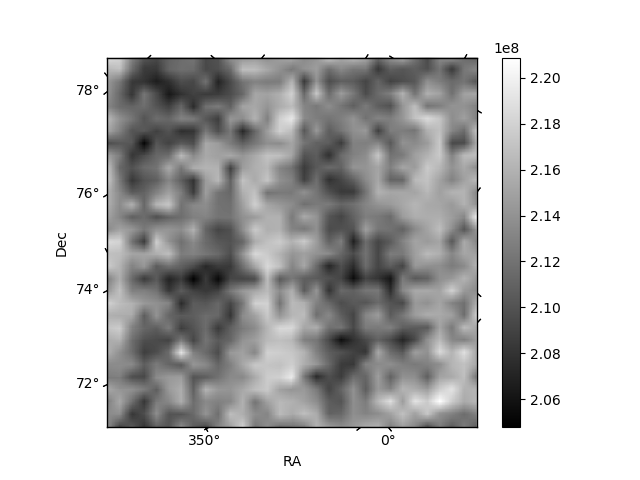
Histogram calculated using DETX and DETY for each event in the final _common_clean file
| Quadrant A | 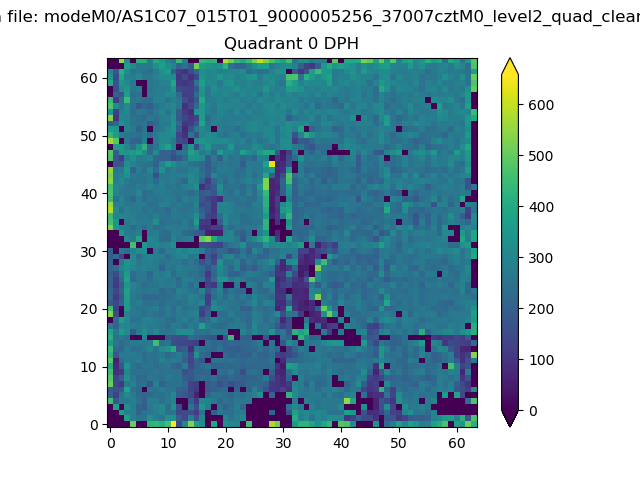 |
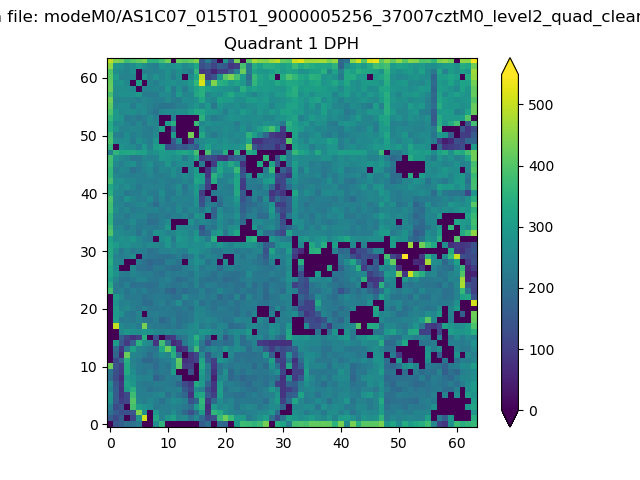 |
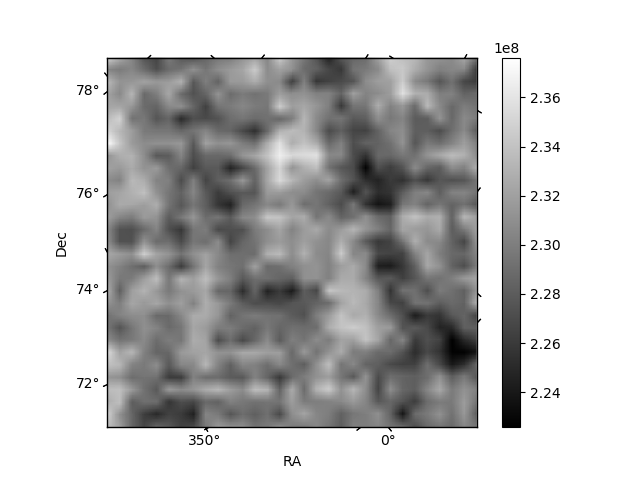
Quadrant B |
|---|---|---|---|
| Quadrant D | 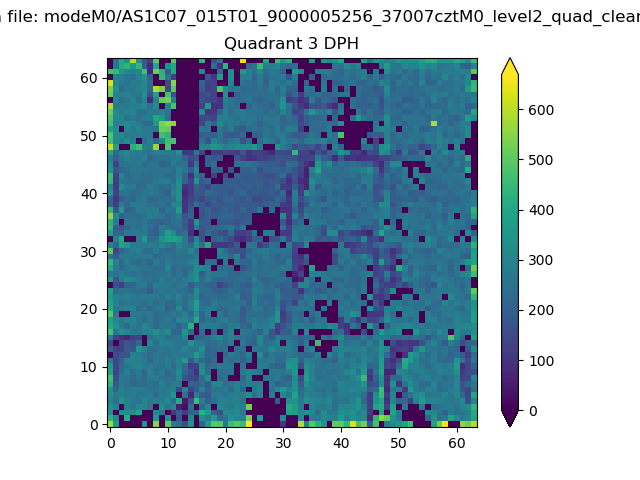 |
 |
Quadrant C |
| Plot type | Count rate plots | Images |
|---|---|---|
| Comparison with Poisson distribution Blue bars denote a histogram of data divided into 1 sec bins. Red curve is a Poisson curve with rate = median count rate of data. |
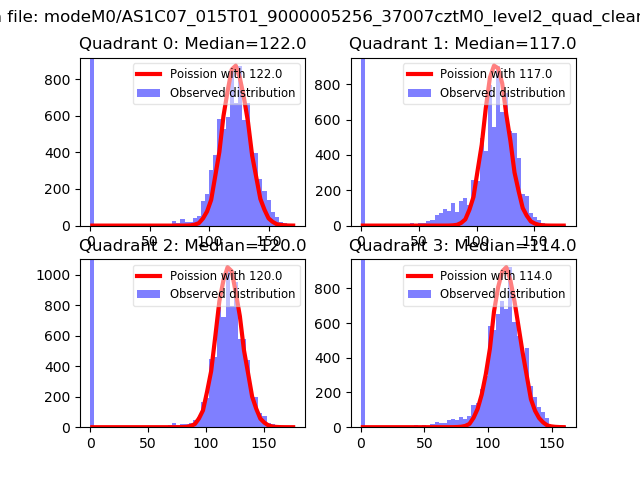 |
 |
| Quadrant-wise count rates Data is divided into 100 sec bins |
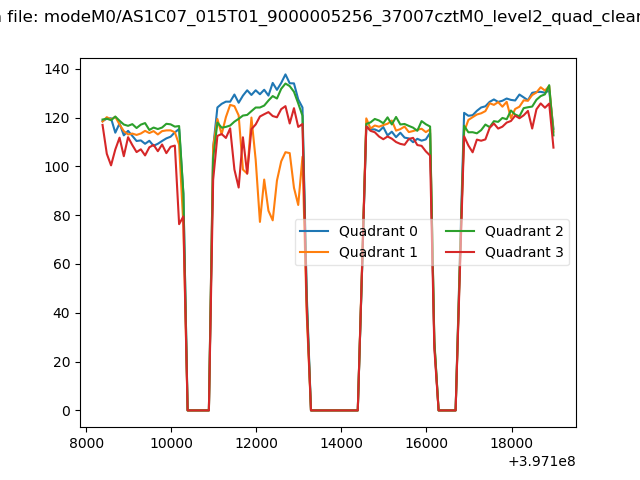 |
|
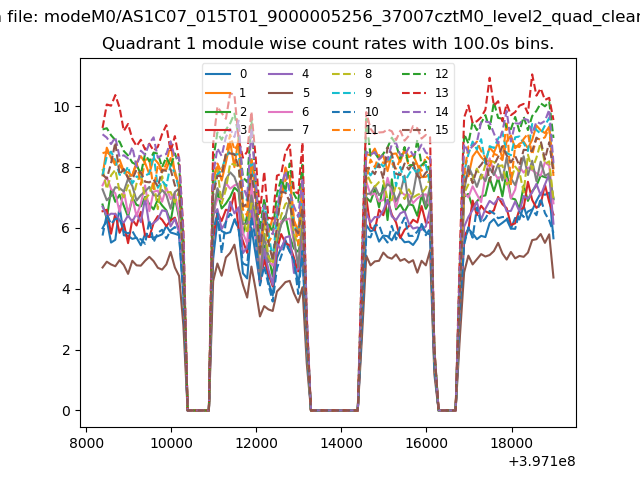
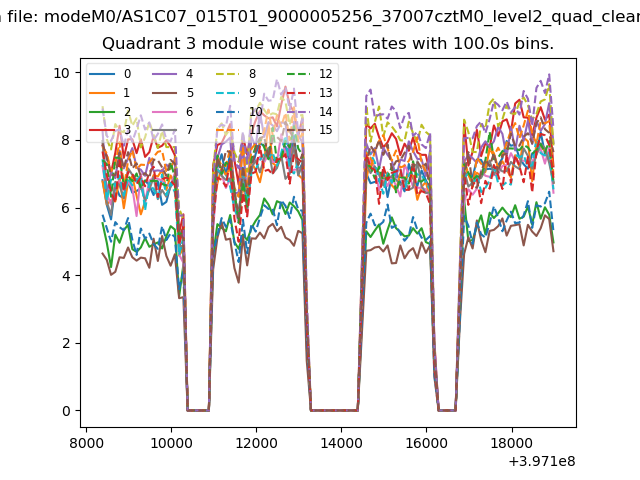
| Module-wise count rates for Quadrant A Data is divided into 100 sec bins |
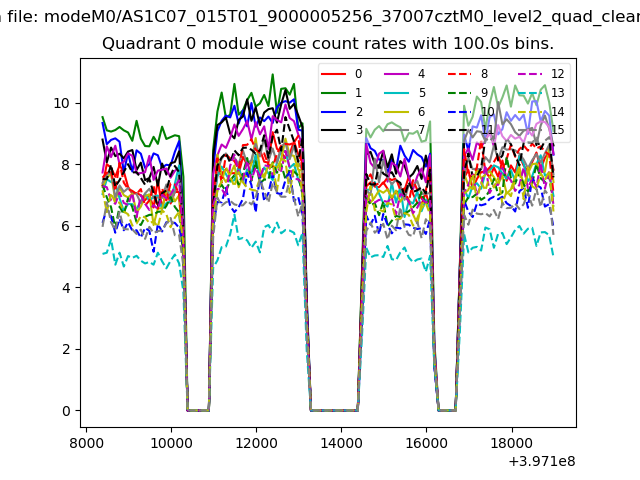 |
 |
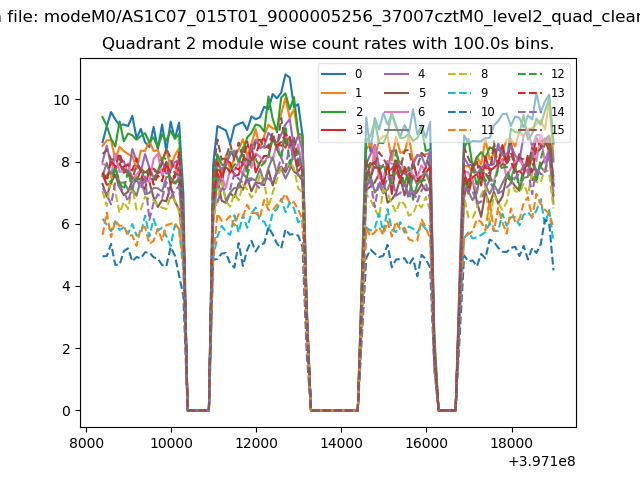
| Module-wise count rates for Quadrant B Data is divided into 100 sec bins |
 |
 |
| Module-wise count rates for Quadrant C Data is divided into 100 sec bins |
 |
 |
| Module-wise count rates for Quadrant D Data is divided into 100 sec bins |
 |
 |
| Parameter | Plot |
|---|---|
| CZT HV Monitor | 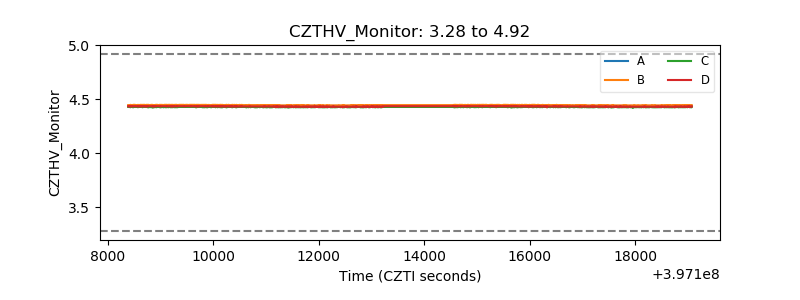 |
| D_VDD | 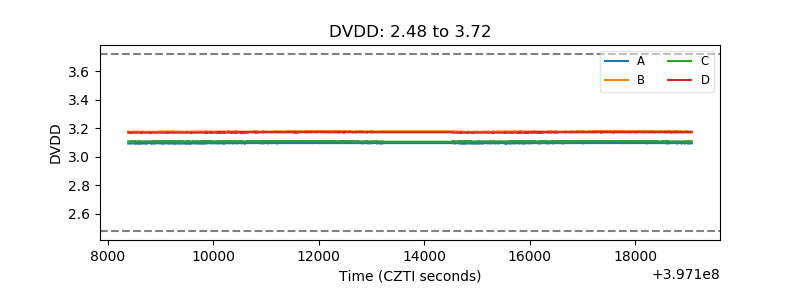 |
| Temperature 1 | 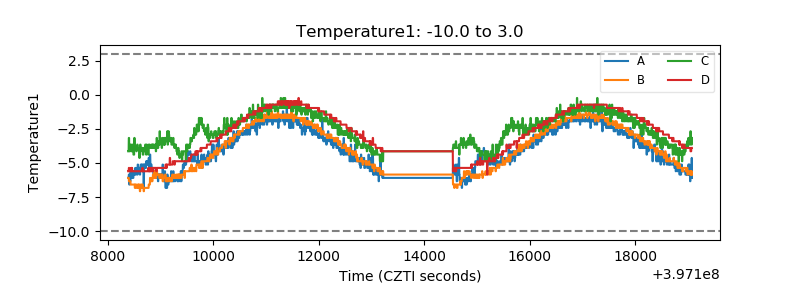 |
| Veto HV Monitor | 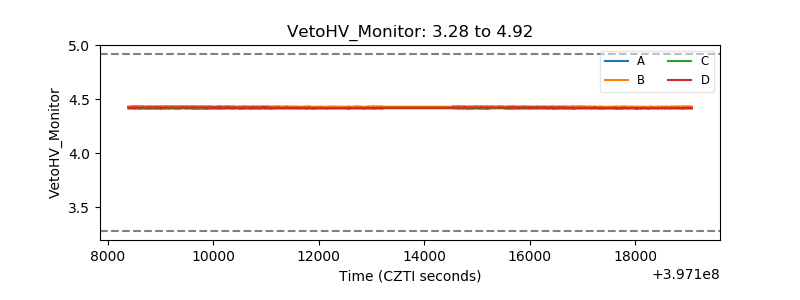 |
| Veto LLD | 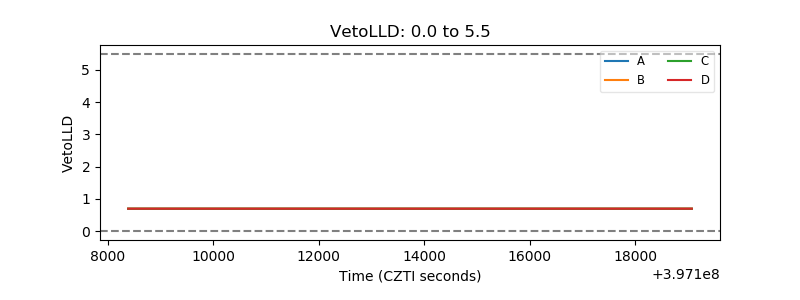 |
| Alpha Counter | 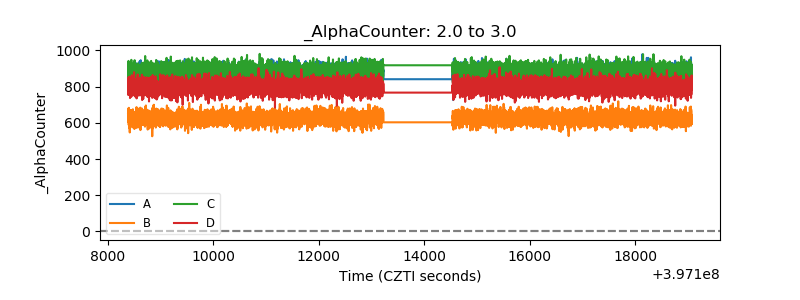 |
| _CPM_Rate | 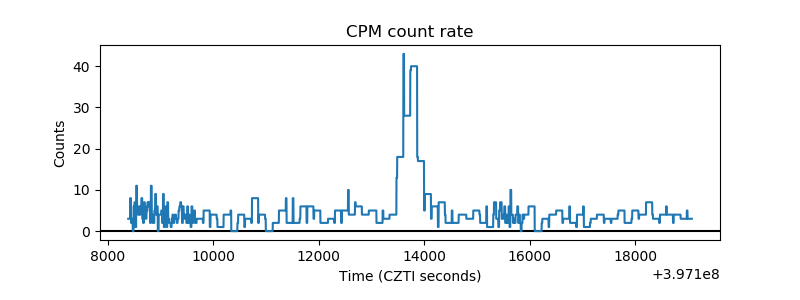 |
| CZT Counter | 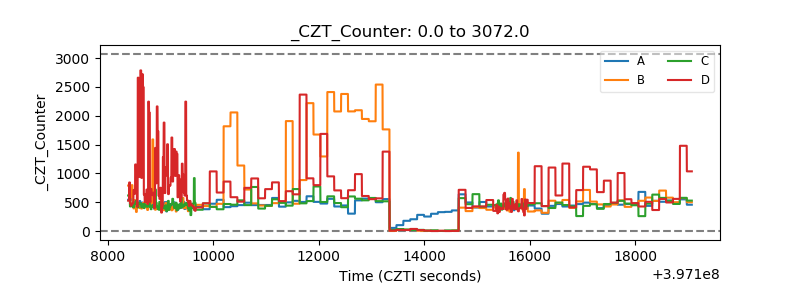 |
| +2.5 Volts monitor | 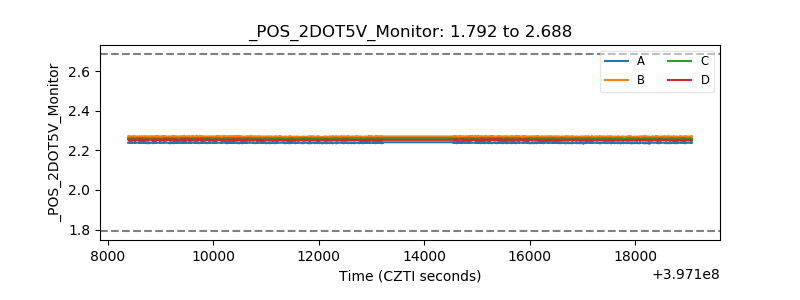 |
| +5 Volts monitor | 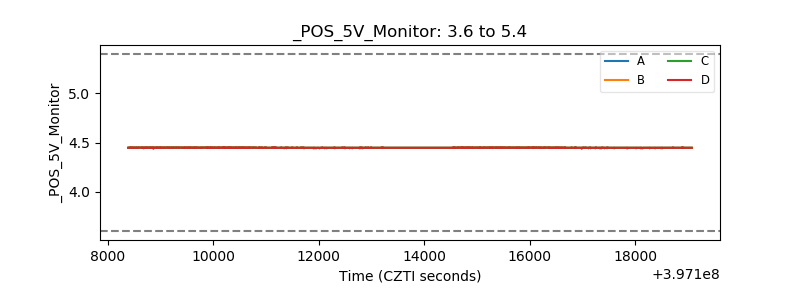 |
| _ROLL_ROT | 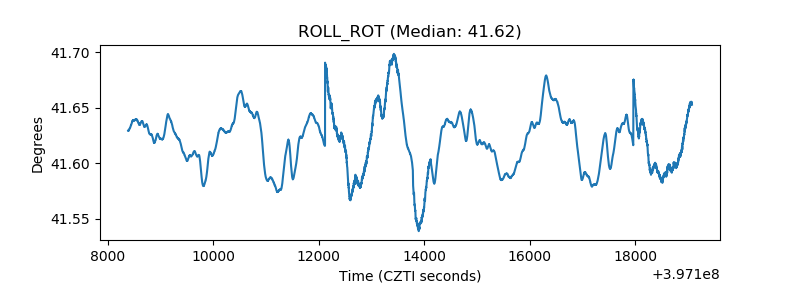 |
| _Roll_DEC | 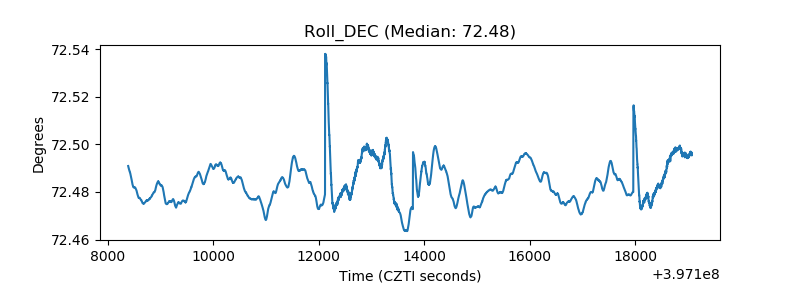 |
| _Roll_RA | 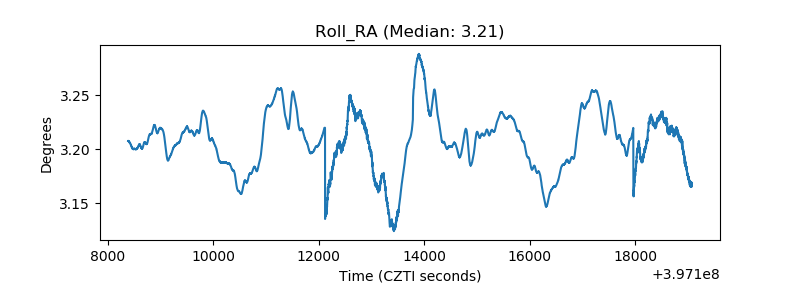 |
| Veto Counter | 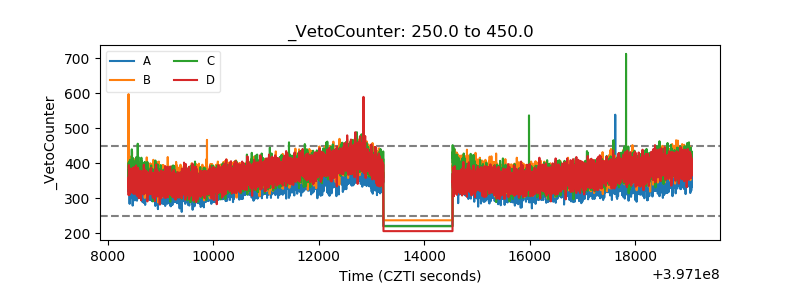 |