| Param | Original file | Final file |
|---|---|---|
| Filename | modeM0/AS1C07_015T01_9000005256_37008cztM0_level2.evt | modeM0/AS1C07_015T01_9000005256_37008cztM0_level2_quad_clean.evt |
| Size (bytes) | 97,845,120 | 23,768,640 |
| Size | 93.3 MB | 22.7 MB |
| Events in quadrant A | 624,370 | 159,980 |
| Events in quadrant B | 734,310 | 158,534 |
| Events in quadrant C | 653,561 | 156,528 |
| Events in quadrant D | 863,945 | 150,899 |
| Mode SS | |||
|---|---|---|---|
| Quadrant | BADHDUFLAG | Total packets | Discarded packets |
| A | 0 | 26 | 0 |
| B | 0 | 26 | 0 |
| C | 0 | 26 | 0 |
| D | 0 | 26 | 0 |
| Mode M0 | |||
|---|---|---|---|
| Quadrant | BADHDUFLAG | Total packets | Discarded packets |
| A | 0 | 2545 | 0 |
| B | 0 | 2907 | 0 |
| C | 0 | 2588 | 0 |
| D | 0 | 3333 | 0 |
| Quadrant | Total seconds | Saturated seconds | Saturation percentage |
|---|---|---|---|
| A | 1234 | 1 | 0.081037% |
| B | 1234 | 19 | 1.539708% |
| C | 1234 | 0 | 0.000000% |
| D | 1234 | 35 | 2.836305% |
Noise dominated data is calculated using 1-second bins in cleaned event files. If a bin has >2000 counts, and if more than 50% of those come from <1% of pixels, then it is considered to be noise-dominated and hence unusable.
| Quadrant | # 1 sec bins | Bins with >0 counts | Bins with >2000 counts | High rate bins dominated by noise | Noise dominated (total time) | Noise dominated (detector-on time) | Marked lightcurve |
|---|---|---|---|---|---|---|---|
| A | 1234 | 1234 | 0 | 0 | 0.00% | 0.00% | 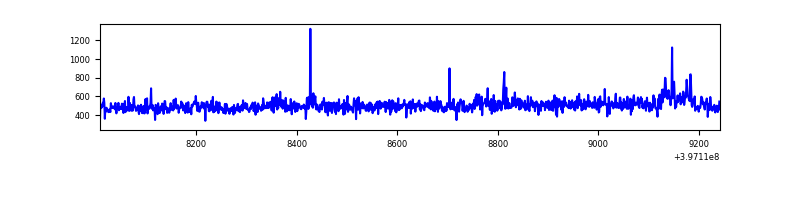 |
| B | 1234 | 1234 | 14 | 14 | 1.13% | 1.13% | 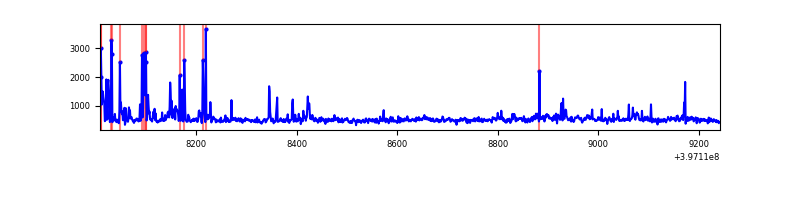 |
| C | 1234 | 1234 | 0 | 0 | 0.00% | 0.00% | 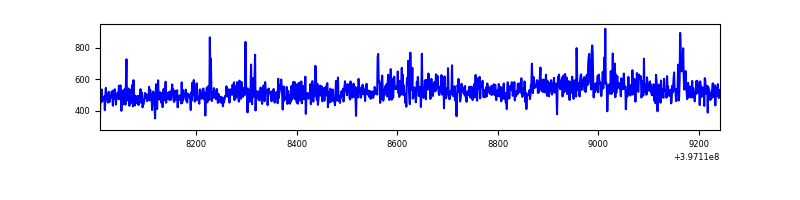 |
| D | 1234 | 1234 | 26 | 26 | 2.11% | 2.11% | 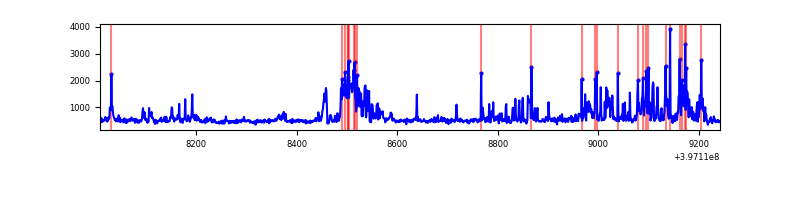 |
Top three noisy pixels from each quadrant. If the there are fewer than three noisy pixels in the level2.evt file, extra rows are filled as -1
| Pixel properties | Quadrant properties | ||||||
|---|---|---|---|---|---|---|---|
| Quadrant | DetID | PixID | Counts | Sigma | Mean | Median | Sigma |
| A | 10 | 83 | 33254 | 1017.0 | 148 | 145 | 32.6 |
| A | 12 | 189 | 9776 | 295.83 | 148 | 145 | 32.6 |
| A | 13 | 6 | 4211 | 124.89 | 148 | 145 | 32.6 |
| B | 5 | 172 | 76410 | 2529.11 | 148 | 144 | 30.2 |
| B | 0 | 213 | 14835 | 487.18 | 148 | 144 | 30.2 |
| B | 15 | 85 | 11120 | 363.98 | 148 | 144 | 30.2 |
| C | 15 | 214 | 50930 | 1370.84 | 149 | 150 | 37.0 |
| C | 0 | 207 | 11027 | 293.63 | 149 | 150 | 37.0 |
| C | 10 | 20 | 3399 | 87.71 | 149 | 150 | 37.0 |
| D | 2 | 250 | 85992 | 2266.27 | 147 | 143 | 37.9 |
| D | 4 | 239 | 74949 | 1974.75 | 147 | 143 | 37.9 |
| D | 1 | 52 | 29224 | 767.69 | 147 | 143 | 37.9 |
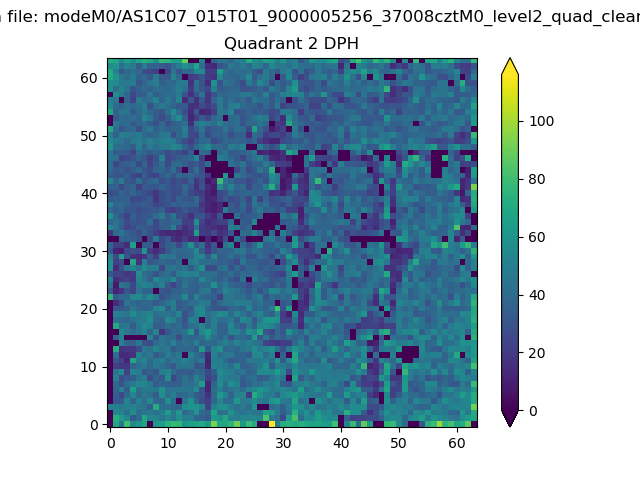
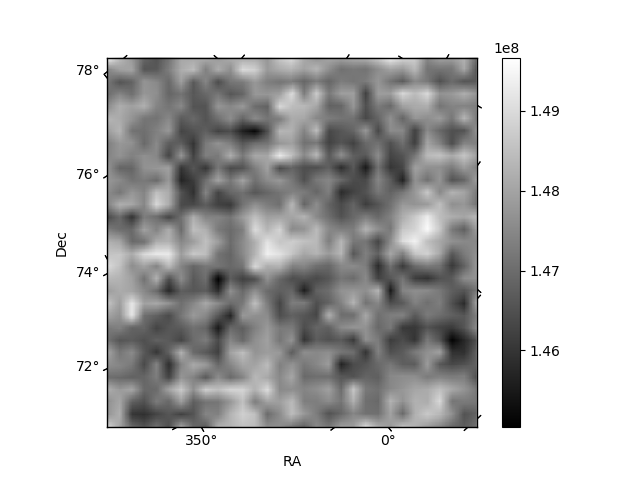
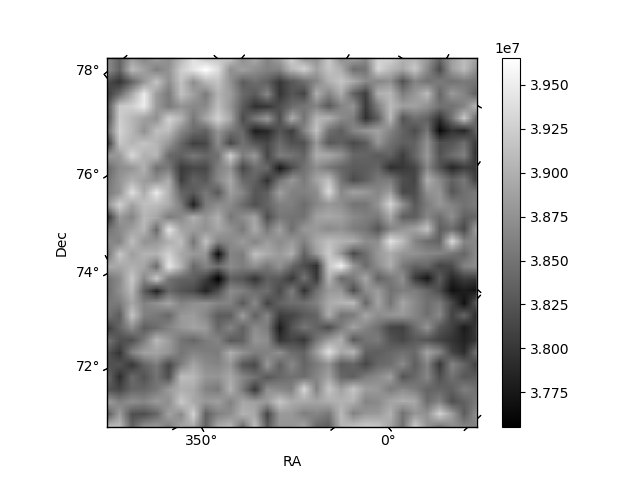
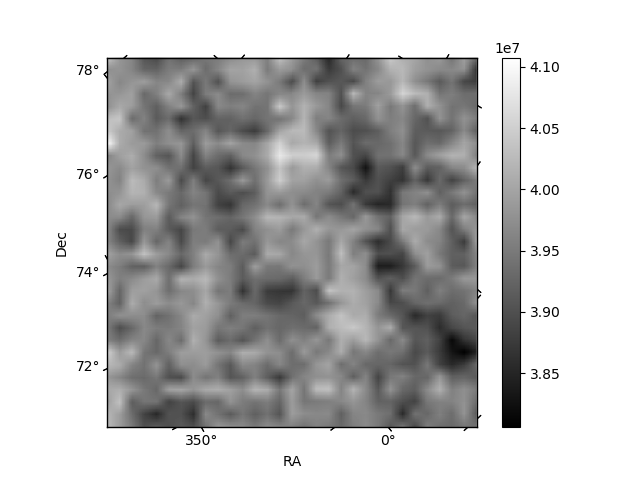
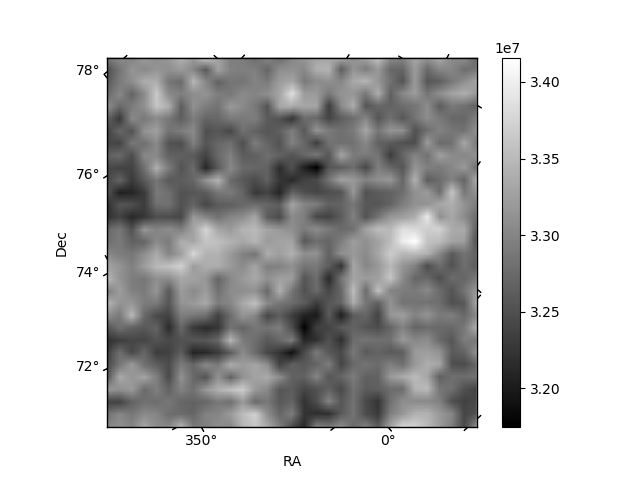
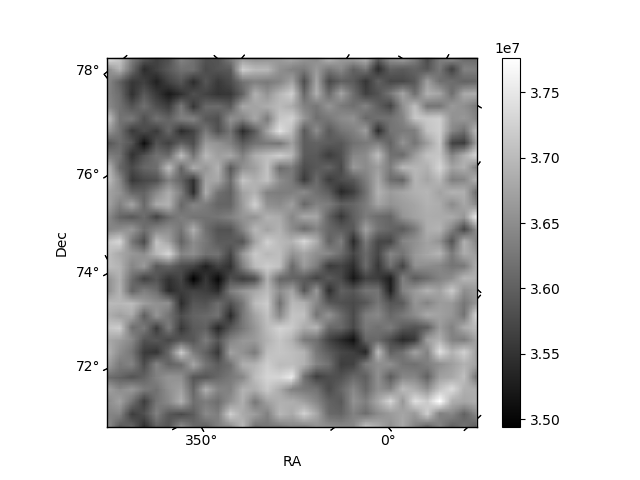
Histogram calculated using DETX and DETY for each event in the final _common_clean file
| Quadrant A | 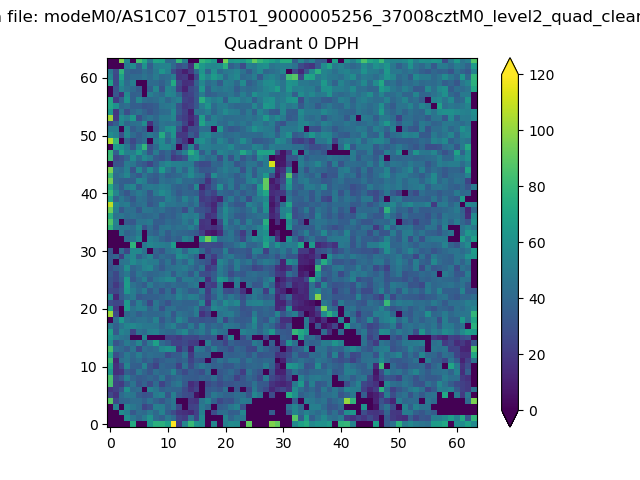 |
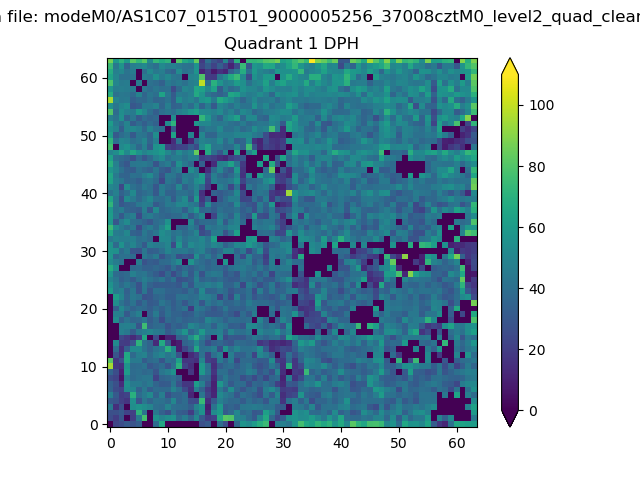 |
Quadrant B |
|---|---|---|---|
| Quadrant D | 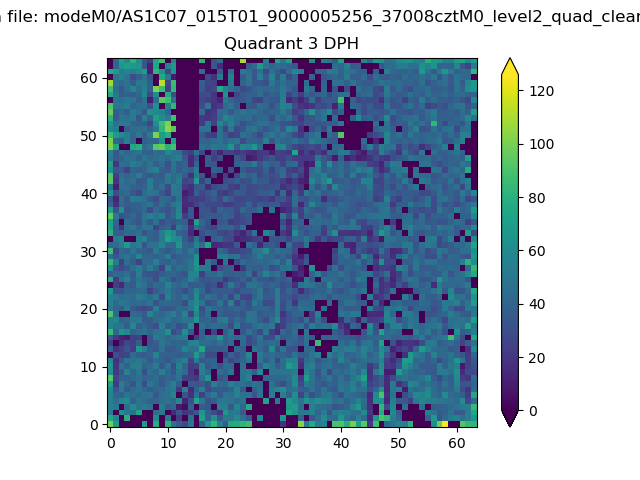 |
 |
Quadrant C |
| Plot type | Count rate plots | Images |
|---|---|---|
| Comparison with Poisson distribution Blue bars denote a histogram of data divided into 1 sec bins. Red curve is a Poisson curve with rate = median count rate of data. |
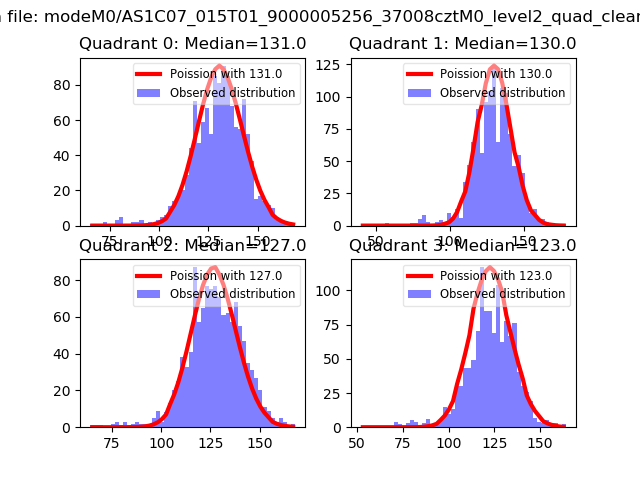 |
 |
| Quadrant-wise count rates Data is divided into 100 sec bins |
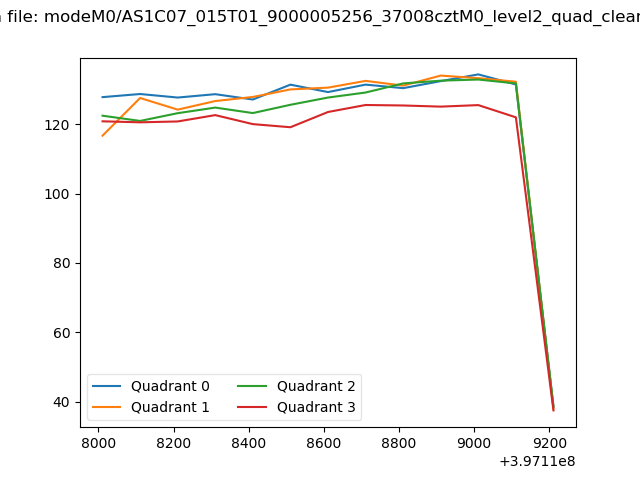 |
|
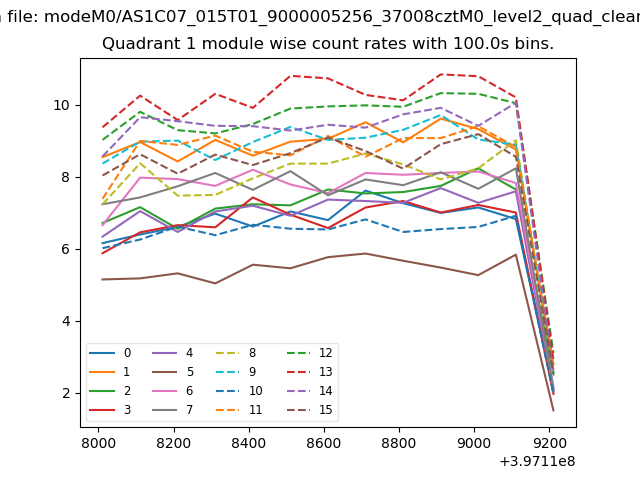
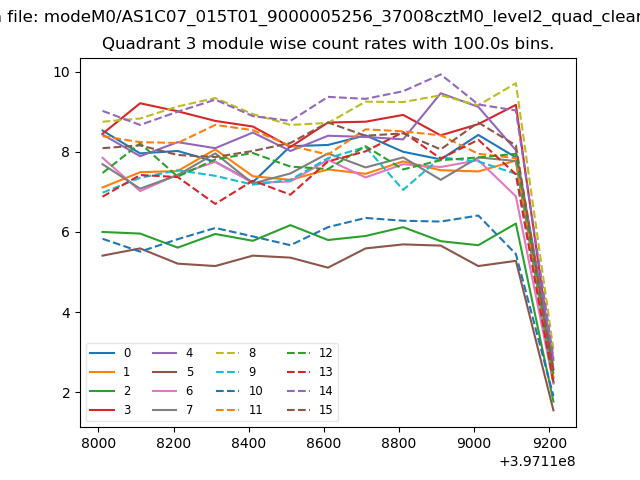
| Module-wise count rates for Quadrant A Data is divided into 100 sec bins |
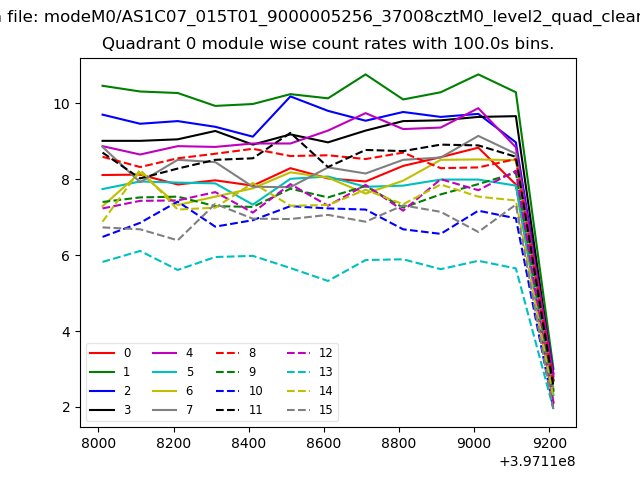 |
 |
| Module-wise count rates for Quadrant B Data is divided into 100 sec bins |
 |
 |
| Module-wise count rates for Quadrant C Data is divided into 100 sec bins |
 |
 |
| Module-wise count rates for Quadrant D Data is divided into 100 sec bins |
 |
 |
| Parameter | Plot |
|---|---|
| CZT HV Monitor | 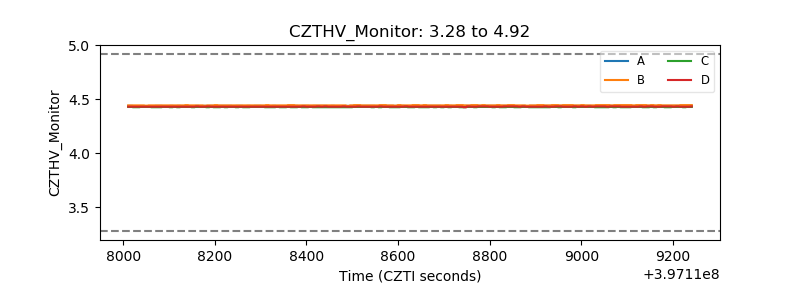 |
| D_VDD | 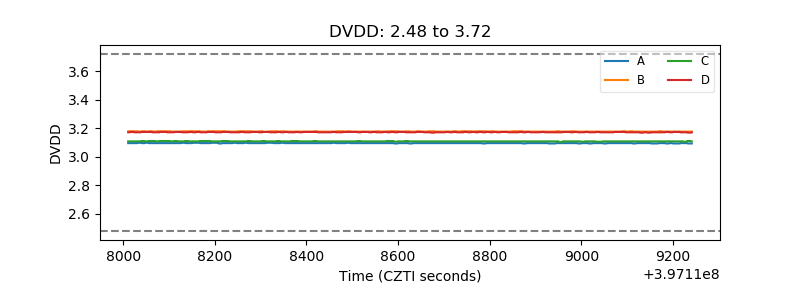 |
| Temperature 1 | 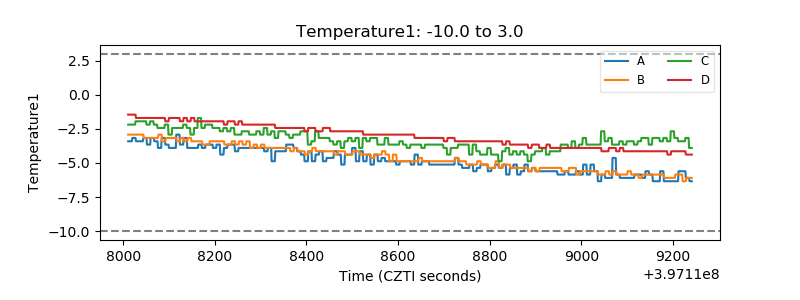 |
| Veto HV Monitor | 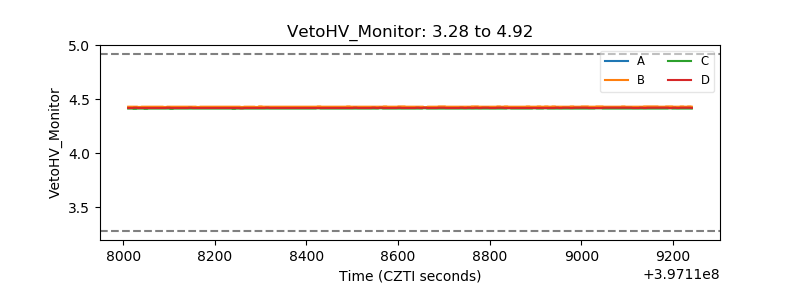 |
| Veto LLD | 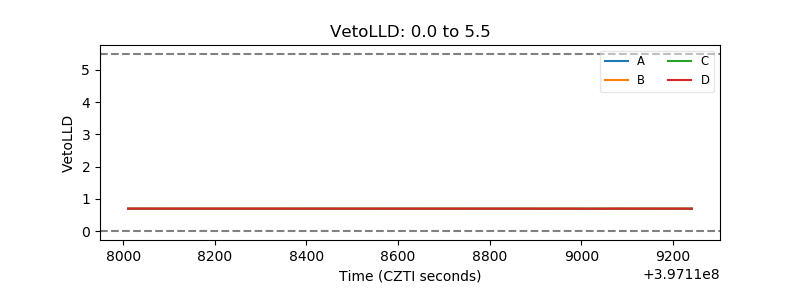 |
| Alpha Counter | 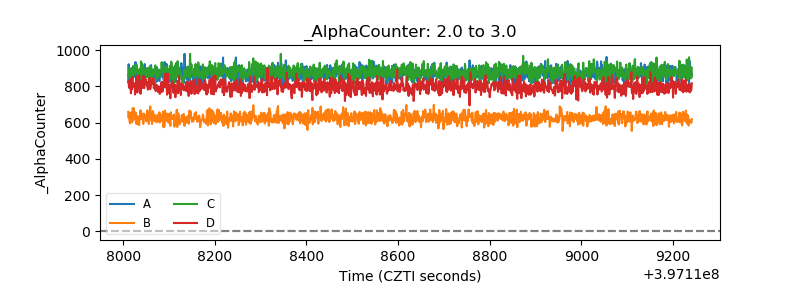 |
| _CPM_Rate | 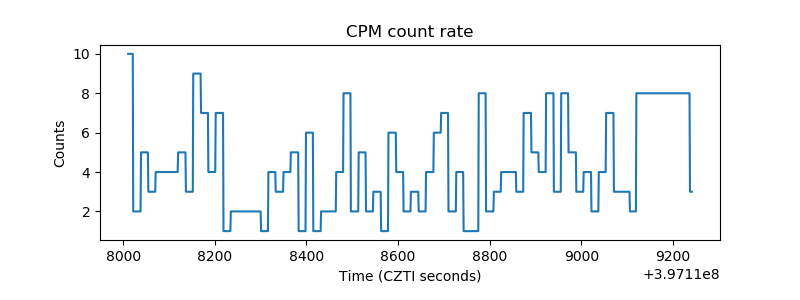 |
| CZT Counter | 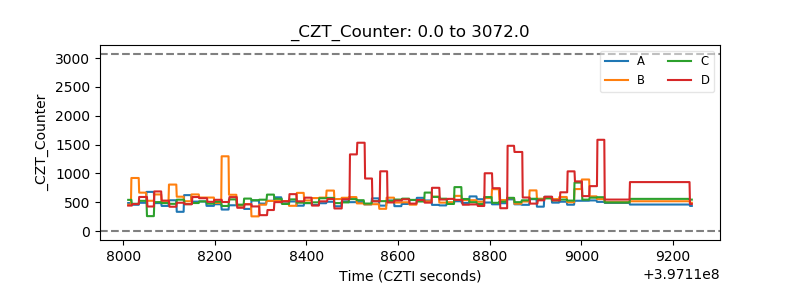 |
| +2.5 Volts monitor | 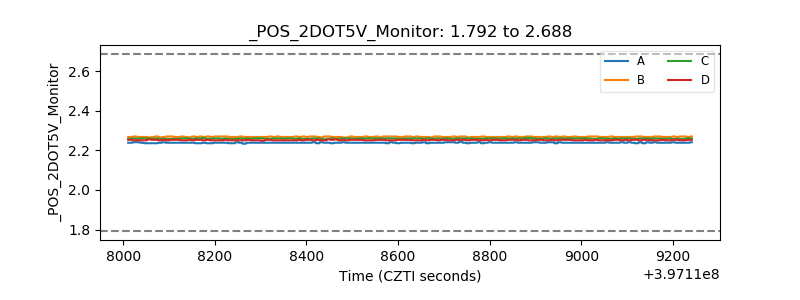 |
| +5 Volts monitor | 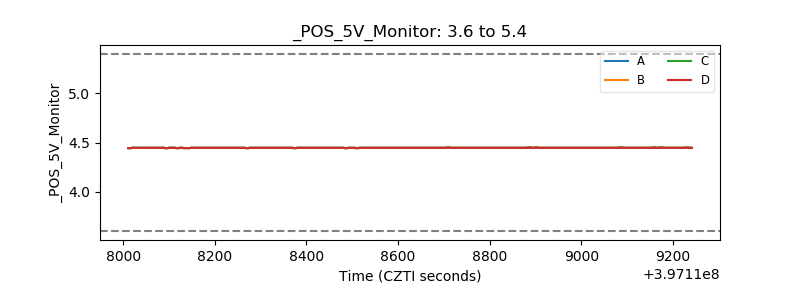 |
| _ROLL_ROT | 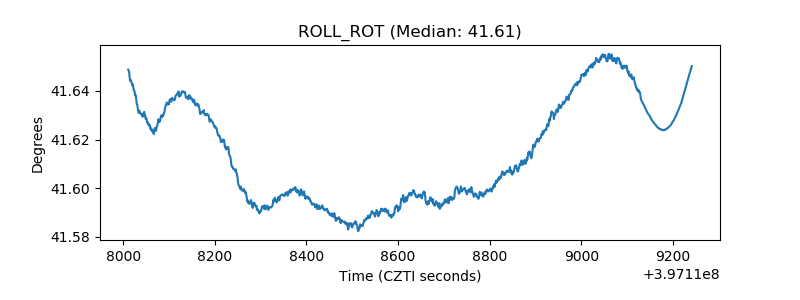 |
| _Roll_DEC | 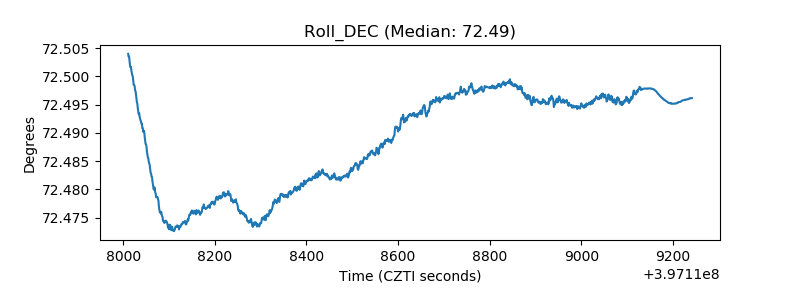 |
| _Roll_RA | 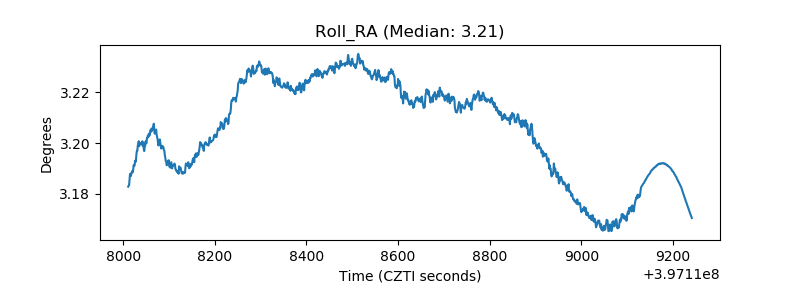 |
| Veto Counter | 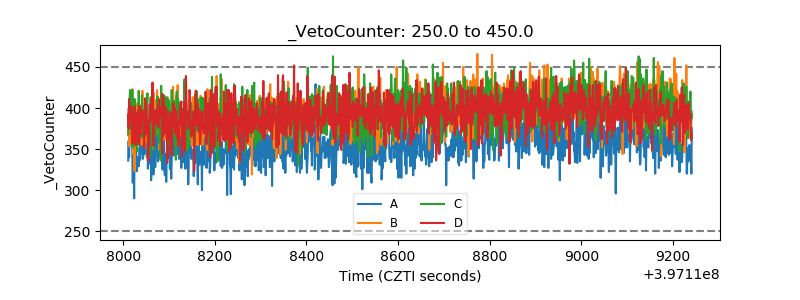 |