| Param | Original file | Final file |
|---|---|---|
| Filename | modeM0/AS1C07_015T02_9000005258cztM0_level2.fits | modeM0/AS1C07_015T02_9000005258cztM0_level2_quad_clean.evt |
| Size (bytes) | 80,498,880 | 86,711,040 |
| Size | 76.8 MB | 82.7 MB |
| Events in quadrant A | 486,408 | 525,890 |
| Events in quadrant B | 460,770 | 519,836 |
| Events in quadrant C | 470,474 | 504,810 |
| Events in quadrant D | 402,088 | 456,531 |
| Mode M0 | |||
|---|---|---|---|
| Quadrant | BADHDUFLAG | Total packets | Discarded packets |
| A | 0 | 18306 | 0 |
| B | 0 | 19034 | 0 |
| C | 0 | 19340 | 0 |
| D | 0 | 24680 | 0 |
| Mode SS | |||
|---|---|---|---|
| Quadrant | BADHDUFLAG | Total packets | Discarded packets |
| A | 0 | 181 | 0 |
| B | 0 | 180 | 0 |
| C | 0 | 178 | 0 |
| D | 0 | 180 | 0 |
| Mode M9 | |||
|---|---|---|---|
| Quadrant | BADHDUFLAG | Total packets | Discarded packets |
| A | 0 | 17 | 0 |
| B | 0 | 17 | 0 |
| C | 0 | 17 | 0 |
| D | 0 | 17 | 0 |
| Quadrant | Total seconds | Saturated seconds | Saturation percentage |
|---|---|---|---|
| A | 8918 | 12 | 0.134559% |
| B | 8915 | 59 | 0.661806% |
| C | 8906 | 66 | 0.741073% |
| D | 8915 | 395 | 4.430735% |
Noise dominated data is calculated using 1-second bins in cleaned event files. If a bin has >2000 counts, and if more than 50% of those come from <1% of pixels, then it is considered to be noise-dominated and hence unusable.
| Quadrant | # 1 sec bins | Bins with >0 counts | Bins with >2000 counts | High rate bins dominated by noise | Noise dominated (total time) | Noise dominated (detector-on time) | Marked lightcurve |
|---|---|---|---|---|---|---|---|
| A | 10482 | 8949 | 0 | 0 | 0.00% | 0.00% | 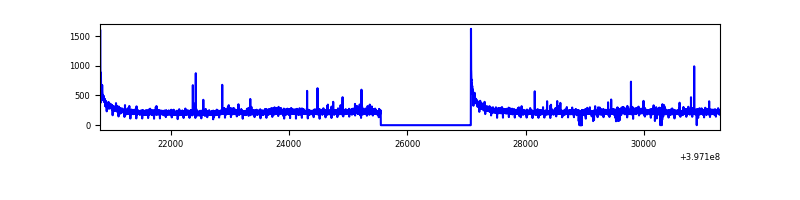 |
| B | 10482 | 8939 | 0 | 0 | 0.00% | 0.00% | 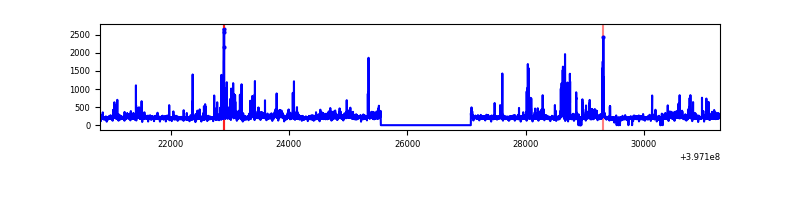 |
| C | 10482 | 8933 | 0 | 0 | 0.00% | 0.00% |  |
| D | 10482 | 8939 | 0 | 0 | 0.00% | 0.00% |  |
Top three noisy pixels from each quadrant. If the there are fewer than three noisy pixels in the level2.evt file, extra rows are filled as -1
| Pixel properties | Quadrant properties | ||||||
|---|---|---|---|---|---|---|---|
| Quadrant | DetID | PixID | Counts | Sigma | Mean | Median | Sigma |
| A | 7 | 110 | 405 | 8.45 | 127 | 119 | 33.9 |
| A | 0 | 29 | 393 | 8.09 | 127 | 119 | 33.9 |
| A | 9 | 19 | 384 | 7.83 | 127 | 119 | 33.9 |
| B | 2 | 9 | 394 | 10.77 | 122 | 116 | 25.8 |
| B | 3 | 80 | 352 | 9.14 | 122 | 116 | 25.8 |
| B | 2 | 8 | 334 | 8.44 | 122 | 116 | 25.8 |
| C | 1 | 80 | 389 | 8.07 | 124 | 116 | 33.8 |
| C | 1 | 81 | 386 | 7.99 | 124 | 116 | 33.8 |
| C | 3 | 202 | 380 | 7.81 | 124 | 116 | 33.8 |
| D | 4 | 160 | 303 | 6.2 | 114 | 104 | 32.1 |
| D | 12 | 6 | 296 | 5.99 | 114 | 104 | 32.1 |
| D | 10 | 113 | 296 | 5.99 | 114 | 104 | 32.1 |
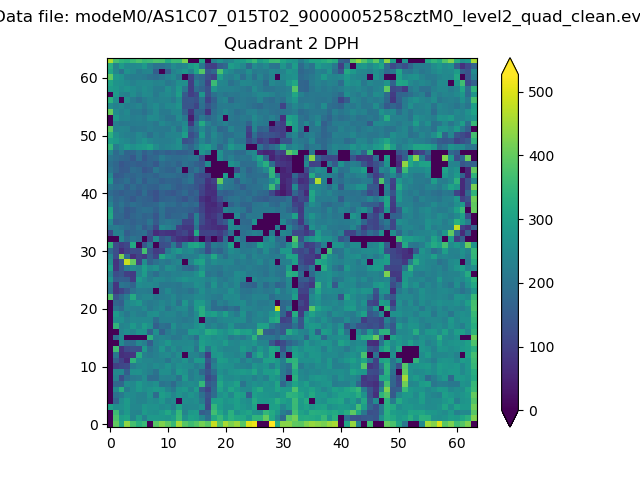
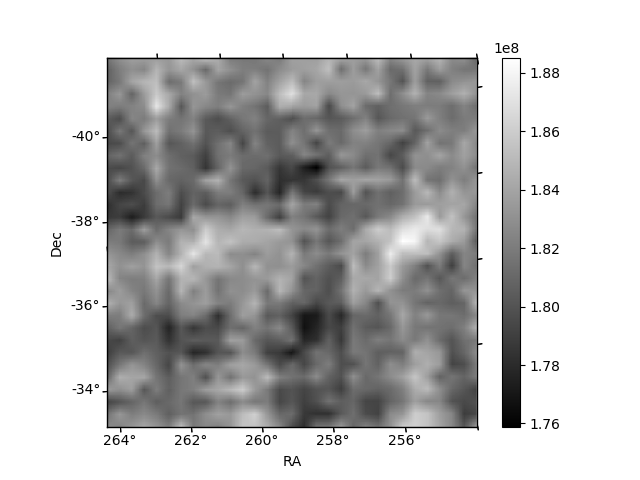
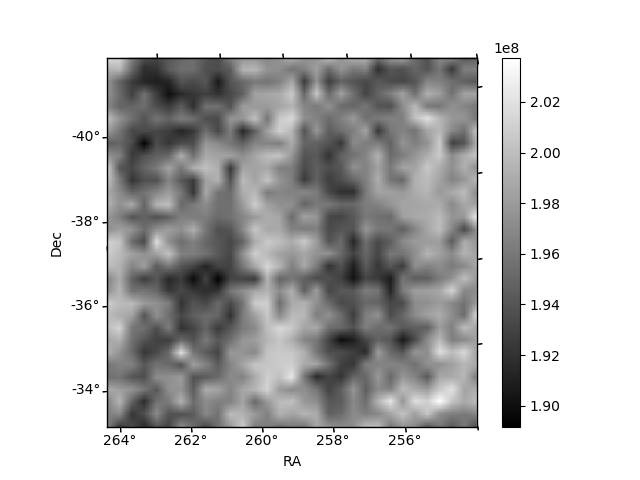
Histogram calculated using DETX and DETY for each event in the final _common_clean file
| Quadrant A | 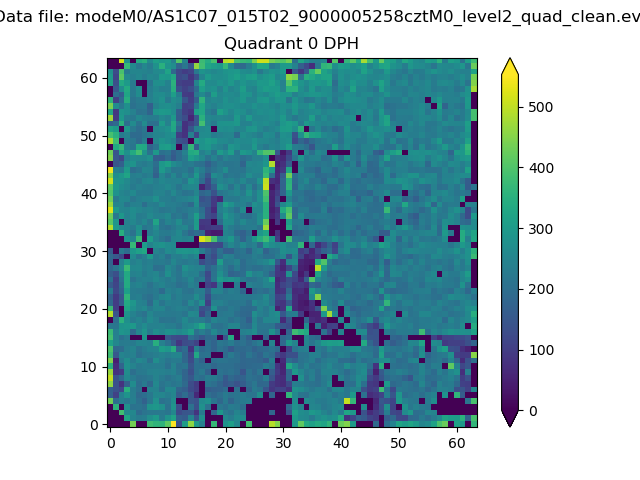 |
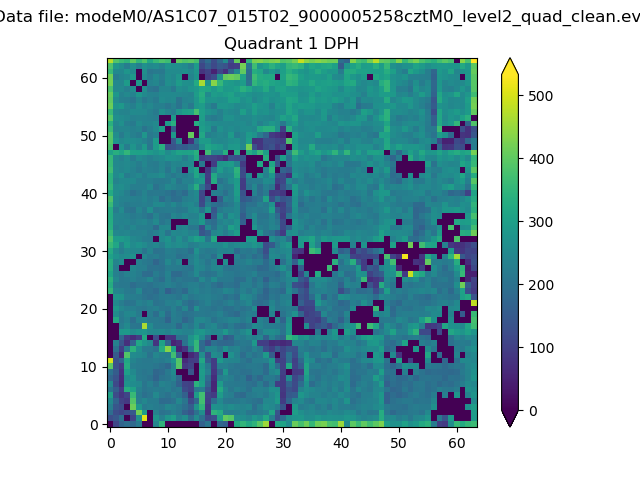 |
Quadrant B |
|---|---|---|---|
| Quadrant D | 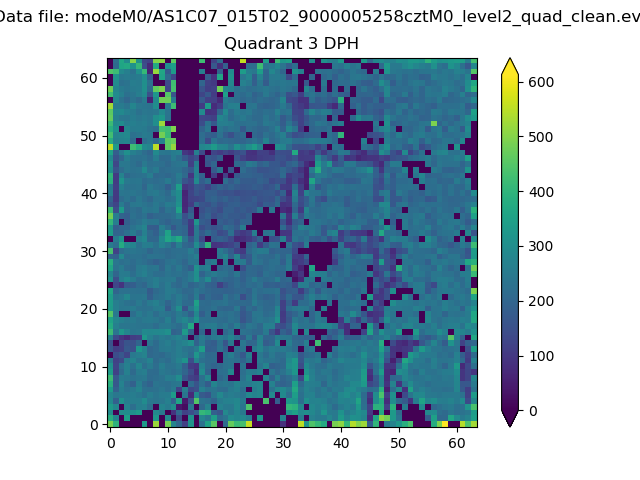 |
 |
Quadrant C |
| Plot type | Count rate plots | Images |
|---|---|---|
| Comparison with Poisson distribution Blue bars denote a histogram of data divided into 1 sec bins. Red curve is a Poisson curve with rate = median count rate of data. |
 |
 |
| Quadrant-wise count rates Data is divided into 100 sec bins |
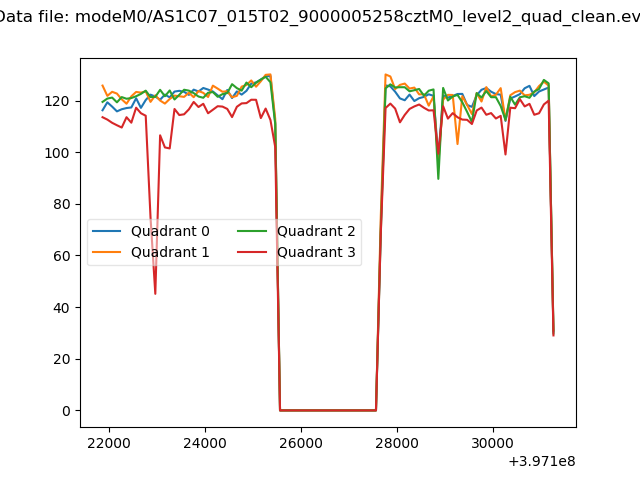 |
|
| Module-wise count rates for Quadrant A Data is divided into 100 sec bins |
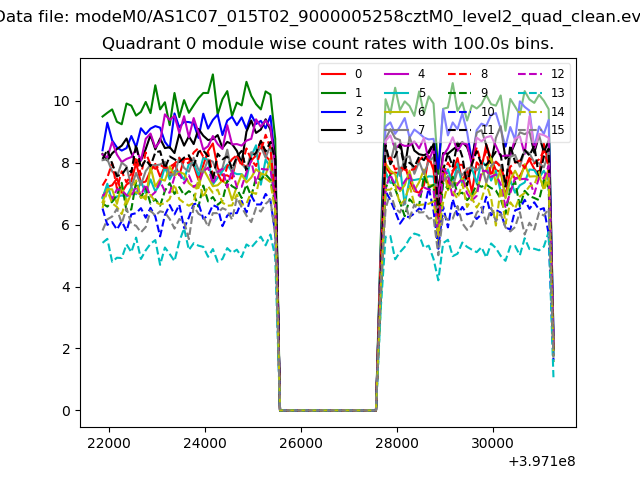 |
 |
| Module-wise count rates for Quadrant B Data is divided into 100 sec bins |
 |
 |
| Module-wise count rates for Quadrant C Data is divided into 100 sec bins |
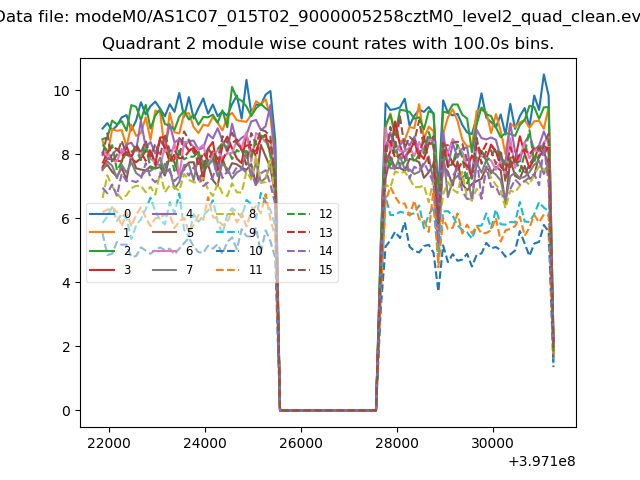 |
 |
| Module-wise count rates for Quadrant D Data is divided into 100 sec bins |
 |
 |
| Parameter | Plot |
|---|---|
| CZT HV Monitor | 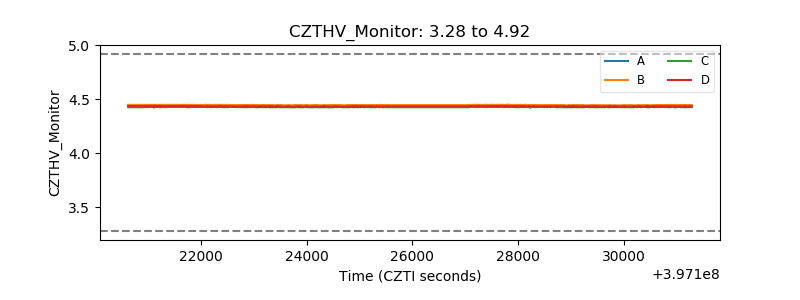 |
| D_VDD | 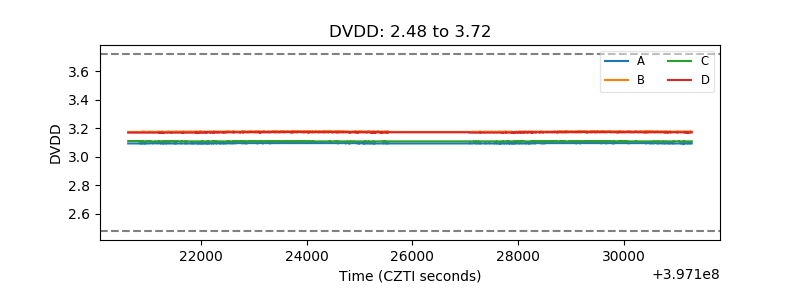 |
| Temperature 1 | 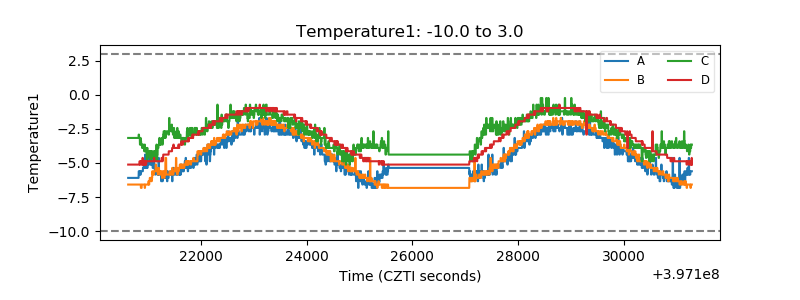 |
| Veto HV Monitor | 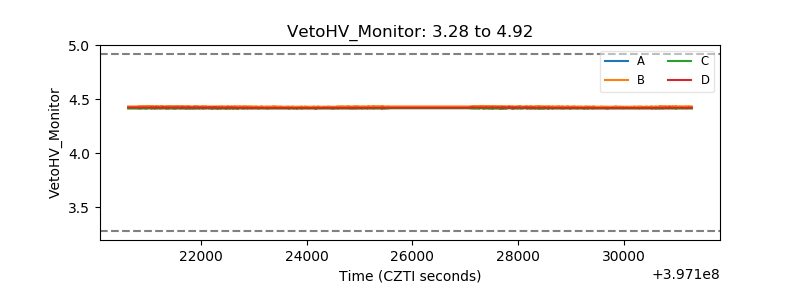 |
| Veto LLD | 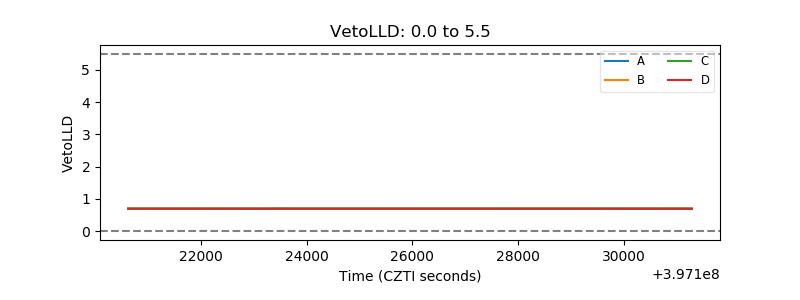 |
| Alpha Counter | 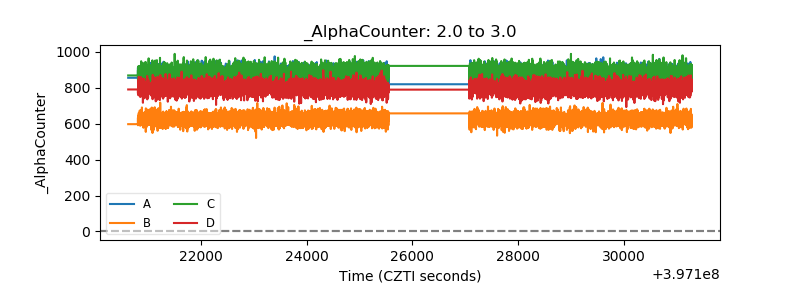 |
| _CPM_Rate | 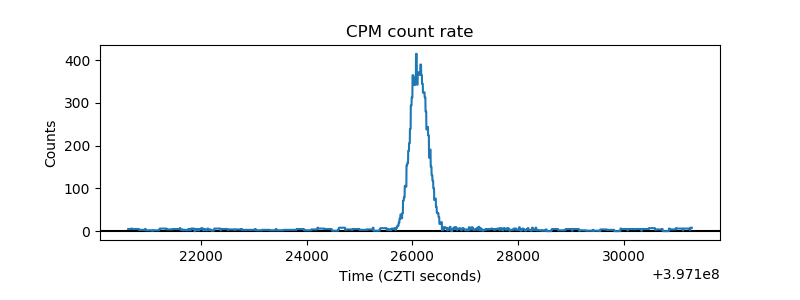 |
| CZT Counter | 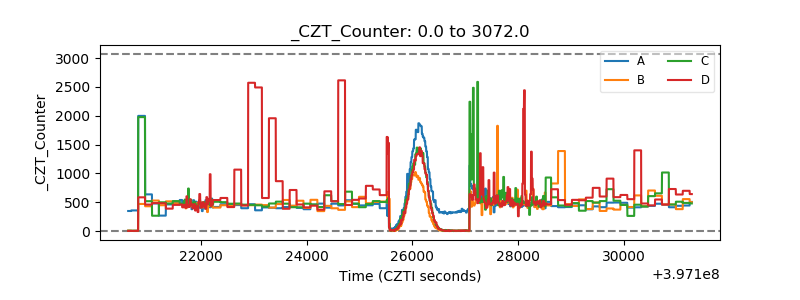 |
| +2.5 Volts monitor |  |
| +5 Volts monitor |  |
| _ROLL_ROT | 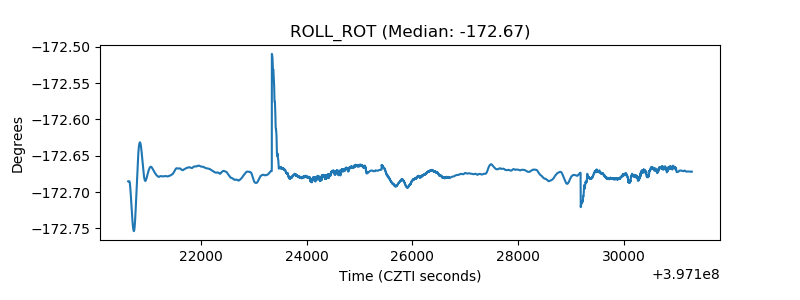 |
| _Roll_DEC | 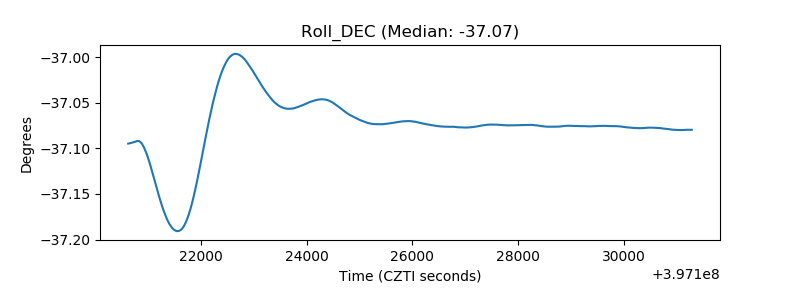 |
| _Roll_RA | 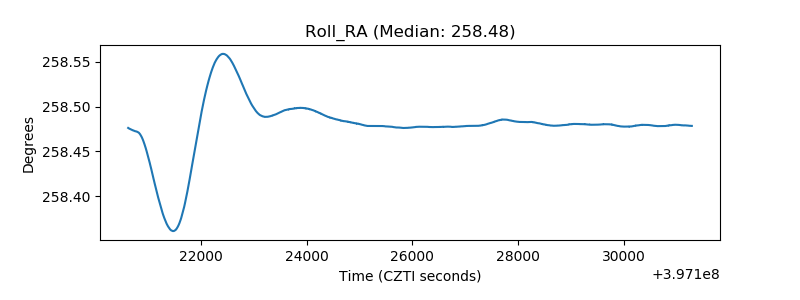 |
| Veto Counter | 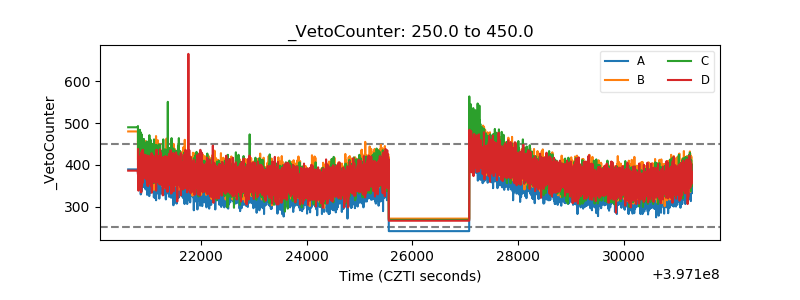 |