| Param | Original file | Final file |
|---|---|---|
| Filename | modeM0/AS1C07_015T02_9000005258_37008cztM0_level2.evt | modeM0/AS1C07_015T02_9000005258_37008cztM0_level2_quad_clean.evt |
| Size (bytes) | 430,084,800 | 76,904,640 |
| Size | 410.2 MB | 73.3 MB |
| Events in quadrant A | 2,790,545 | 490,555 |
| Events in quadrant B | 2,856,955 | 496,676 |
| Events in quadrant C | 2,976,924 | 493,680 |
| Events in quadrant D | 4,013,175 | 449,045 |
| Mode M0 | |||
|---|---|---|---|
| Quadrant | BADHDUFLAG | Total packets | Discarded packets |
| A | 0 | 11833 | 3 |
| B | 0 | 12043 | 2 |
| C | 0 | 12292 | 2 |
| D | 0 | 15741 | 2 |
| Mode SS | |||
|---|---|---|---|
| Quadrant | BADHDUFLAG | Total packets | Discarded packets |
| A | 0 | 118 | 0 |
| B | 0 | 118 | 0 |
| C | 0 | 118 | 0 |
| D | 0 | 118 | 0 |
| Mode M9 | |||
|---|---|---|---|
| Quadrant | BADHDUFLAG | Total packets | Discarded packets |
| A | 0 | 17 | 0 |
| B | 0 | 17 | 0 |
| C | 0 | 17 | 0 |
| D | 0 | 17 | 0 |
| Quadrant | Total seconds | Saturated seconds | Saturation percentage |
|---|---|---|---|
| A | 5696 | 11 | 0.193118% |
| B | 5696 | 28 | 0.491573% |
| C | 5696 | 51 | 0.895365% |
| D | 5696 | 335 | 5.881320% |
Noise dominated data is calculated using 1-second bins in cleaned event files. If a bin has >2000 counts, and if more than 50% of those come from <1% of pixels, then it is considered to be noise-dominated and hence unusable.
| Quadrant | # 1 sec bins | Bins with >0 counts | Bins with >2000 counts | High rate bins dominated by noise | Noise dominated (total time) | Noise dominated (detector-on time) | Marked lightcurve |
|---|---|---|---|---|---|---|---|
| A | 7219 | 5697 | 0 | 0 | 0.00% | 0.00% | 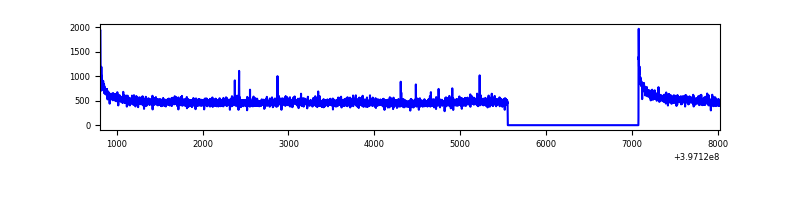 |
| B | 7219 | 5697 | 17 | 17 | 0.24% | 0.30% | 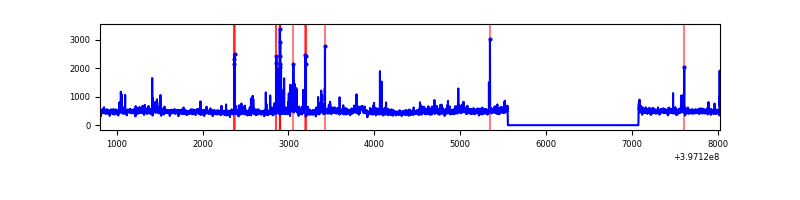 |
| C | 7219 | 5697 | 36 | 36 | 0.50% | 0.63% | 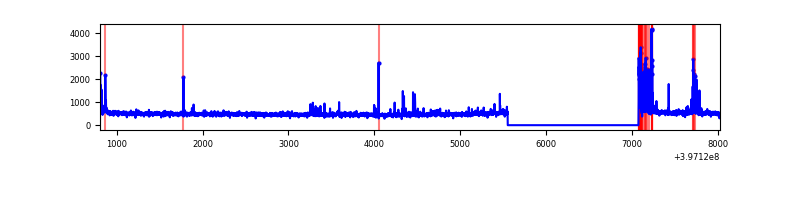 |
| D | 7219 | 5697 | 306 | 306 | 4.24% | 5.37% | 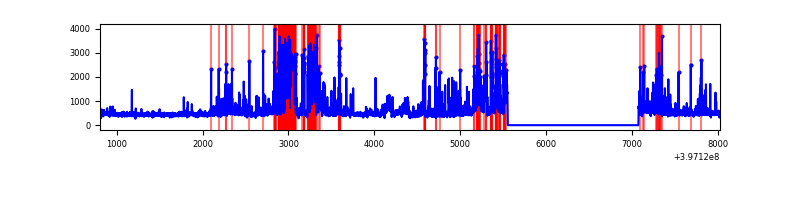 |
Top three noisy pixels from each quadrant. If the there are fewer than three noisy pixels in the level2.evt file, extra rows are filled as -1
| Pixel properties | Quadrant properties | ||||||
|---|---|---|---|---|---|---|---|
| Quadrant | DetID | PixID | Counts | Sigma | Mean | Median | Sigma |
| A | 10 | 83 | 241592 | 1816.76 | 652 | 638 | 132.6 |
| A | 13 | 6 | 13462 | 96.69 | 652 | 638 | 132.6 |
| A | 12 | 189 | 9079 | 63.64 | 652 | 638 | 132.6 |
| B | 5 | 172 | 78717 | 628.56 | 646 | 629 | 124.2 |
| B | 0 | 229 | 41905 | 332.24 | 646 | 629 | 124.2 |
| B | 15 | 85 | 39444 | 312.43 | 646 | 629 | 124.2 |
| C | 15 | 214 | 243041 | 1634.61 | 632 | 637 | 148.3 |
| C | 10 | 20 | 111278 | 746.09 | 632 | 637 | 148.3 |
| C | 0 | 10 | 88559 | 592.89 | 632 | 637 | 148.3 |
| D | 2 | 250 | 994160 | 6530.21 | 618 | 600 | 152.1 |
| D | 2 | 153 | 208615 | 1367.19 | 618 | 600 | 152.1 |
| D | 1 | 52 | 158362 | 1036.9 | 618 | 600 | 152.1 |
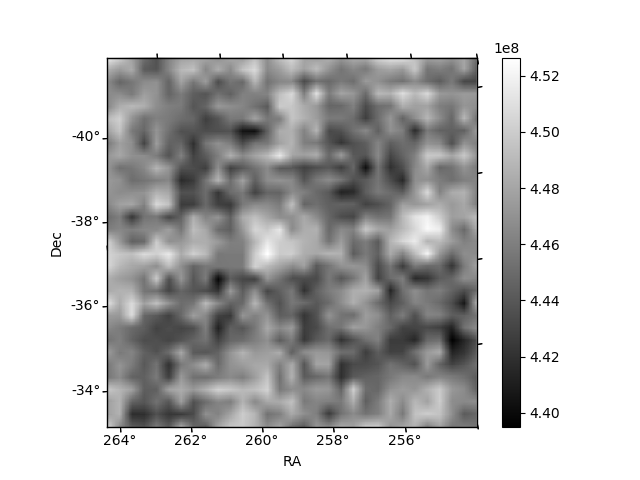
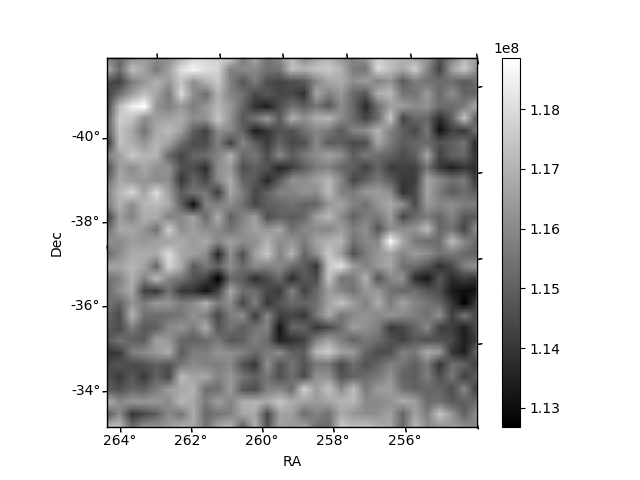
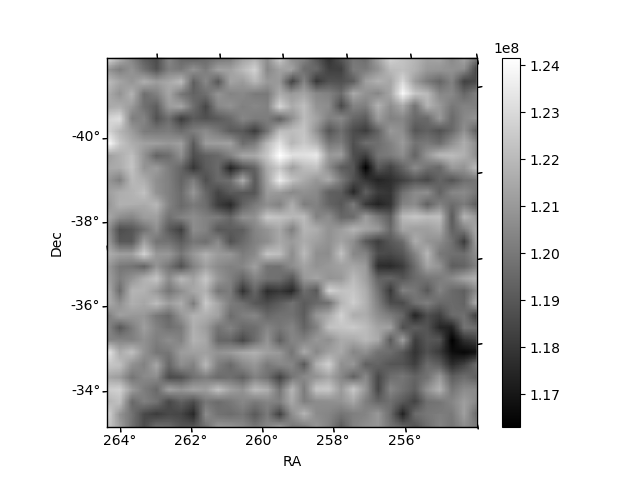
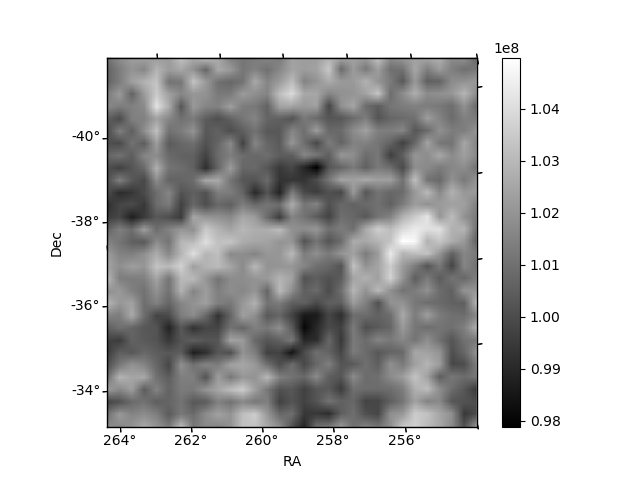
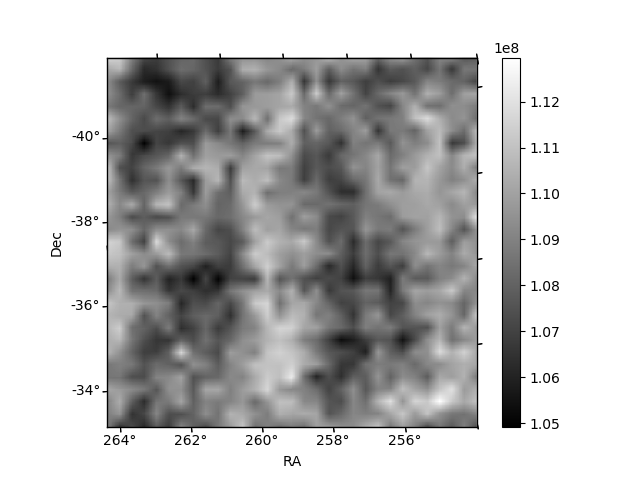
Histogram calculated using DETX and DETY for each event in the final _common_clean file
| Quadrant A | 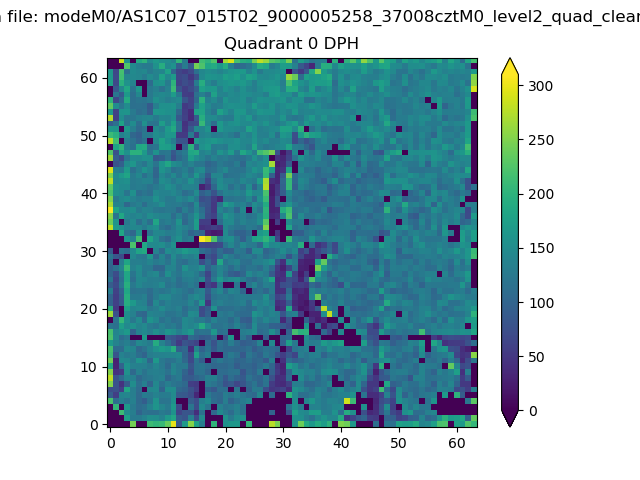 |
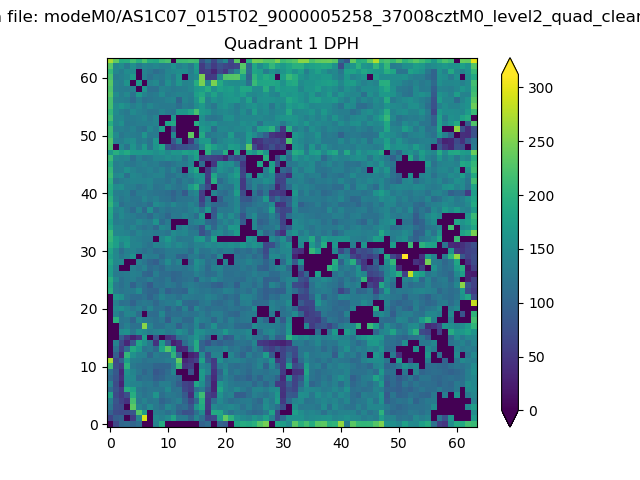 |
Quadrant B |
|---|---|---|---|
| Quadrant D | 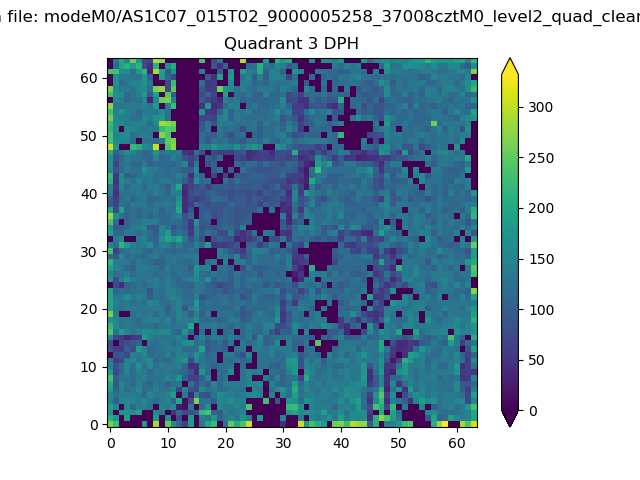 |
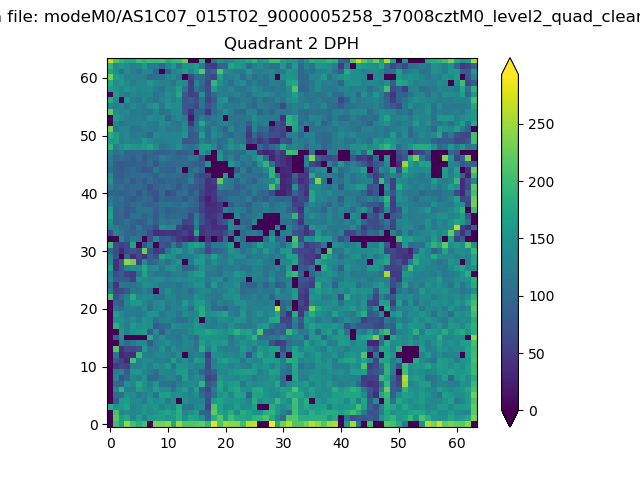 |
Quadrant C |
| Plot type | Count rate plots | Images |
|---|---|---|
| Comparison with Poisson distribution Blue bars denote a histogram of data divided into 1 sec bins. Red curve is a Poisson curve with rate = median count rate of data. |
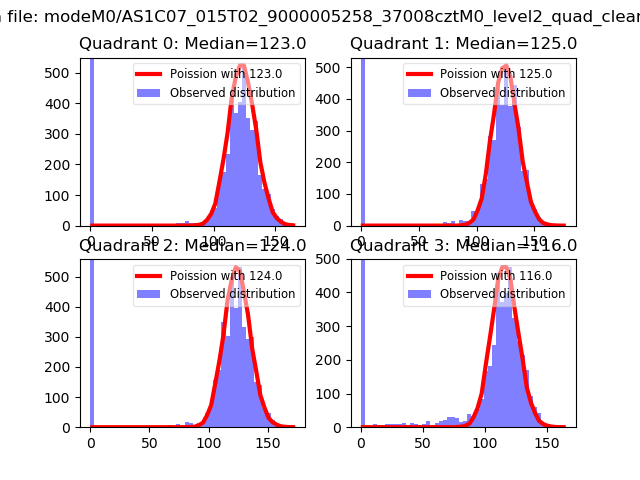 |
 |
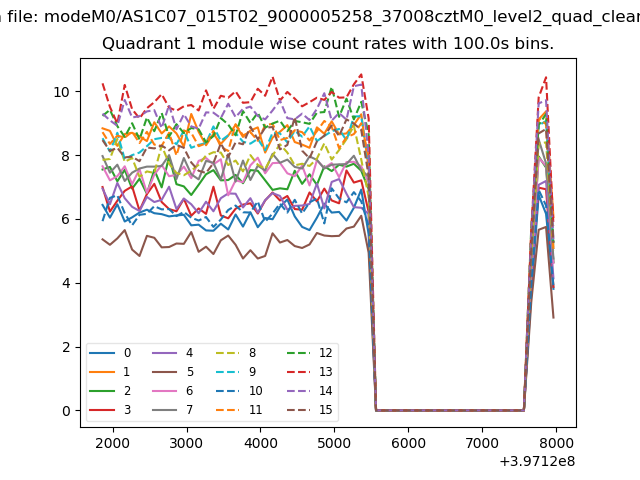
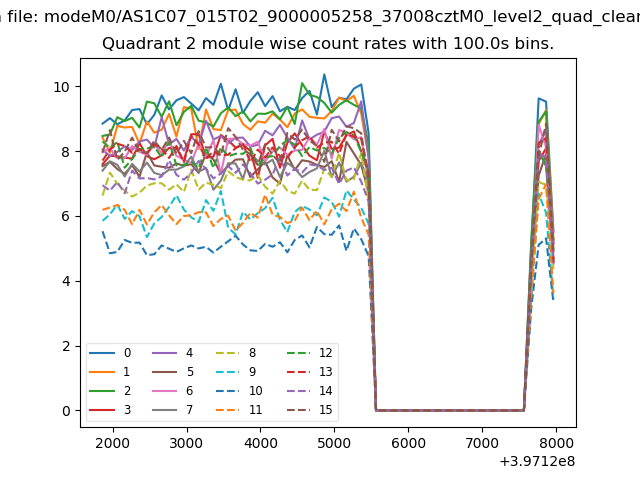
| Quadrant-wise count rates Data is divided into 100 sec bins |
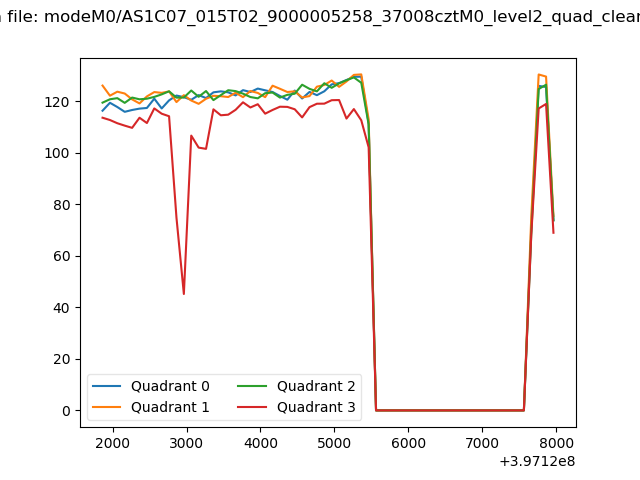 |
|
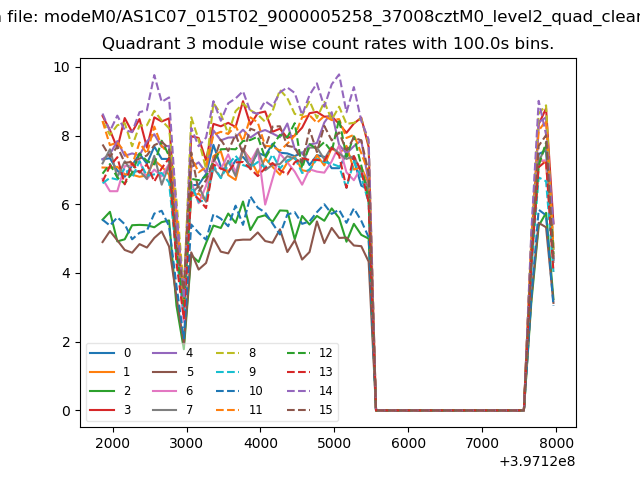
| Module-wise count rates for Quadrant A Data is divided into 100 sec bins |
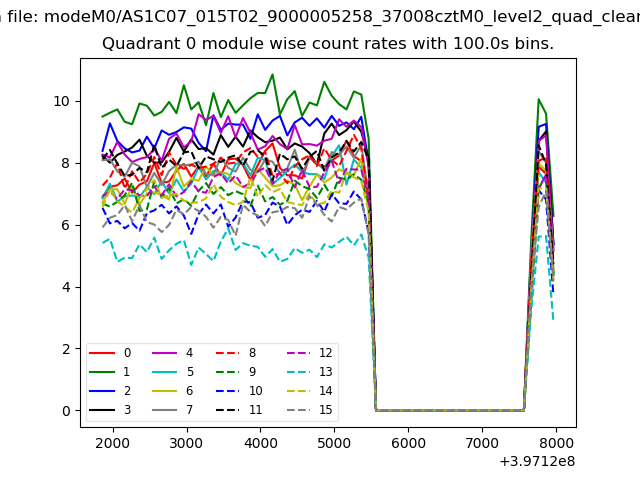 |
 |
| Module-wise count rates for Quadrant B Data is divided into 100 sec bins |
 |
 |
| Module-wise count rates for Quadrant C Data is divided into 100 sec bins |
 |
 |
| Module-wise count rates for Quadrant D Data is divided into 100 sec bins |
 |
 |
| Parameter | Plot |
|---|---|
| CZT HV Monitor | 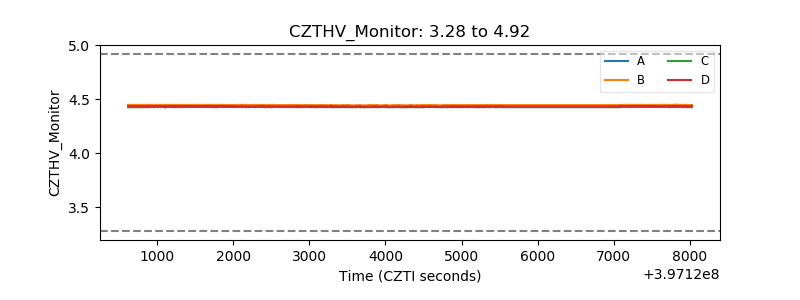 |
| D_VDD | 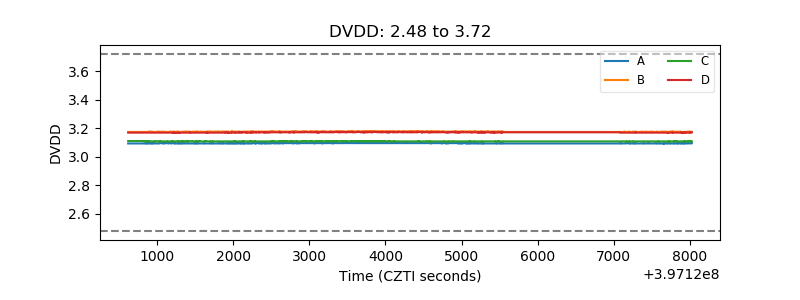 |
| Temperature 1 | 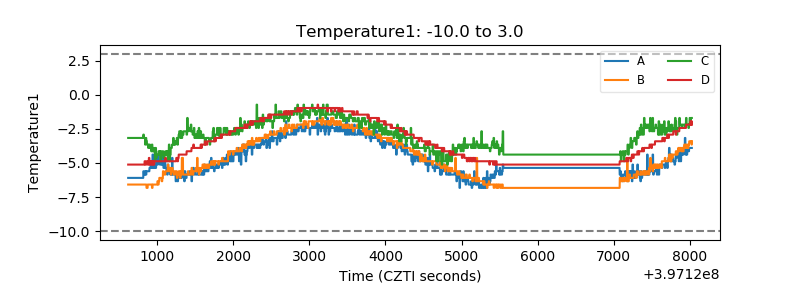 |
| Veto HV Monitor | 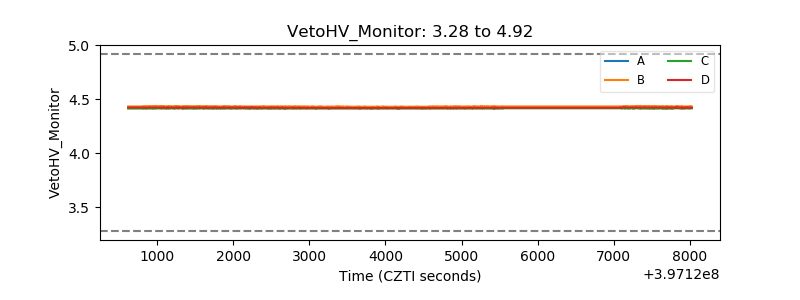 |
| Veto LLD | 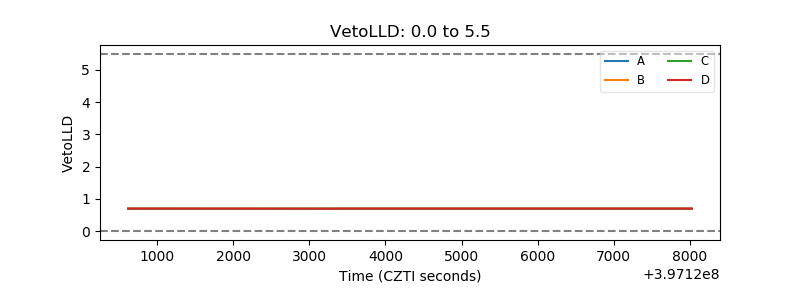 |
| Alpha Counter | 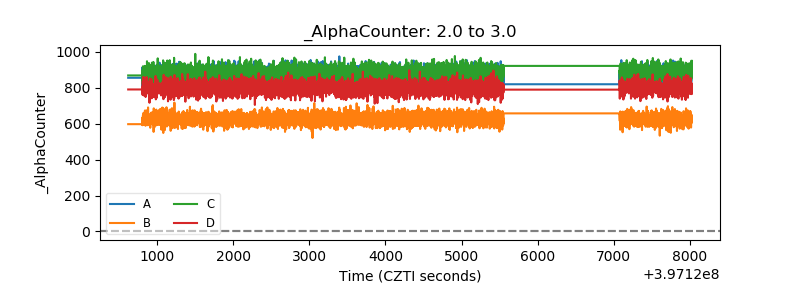 |
| _CPM_Rate | 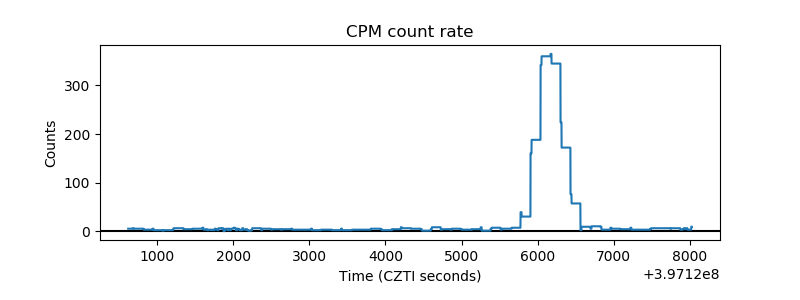 |
| CZT Counter | 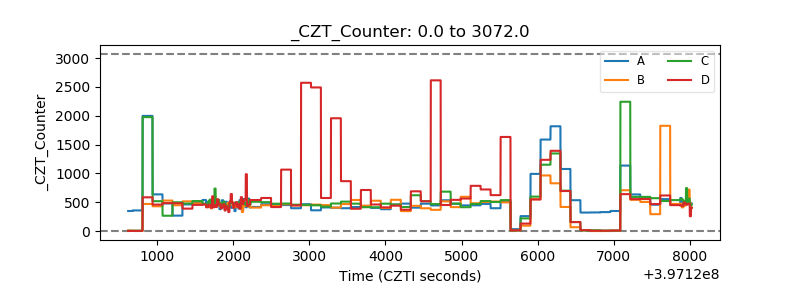 |
| +2.5 Volts monitor | 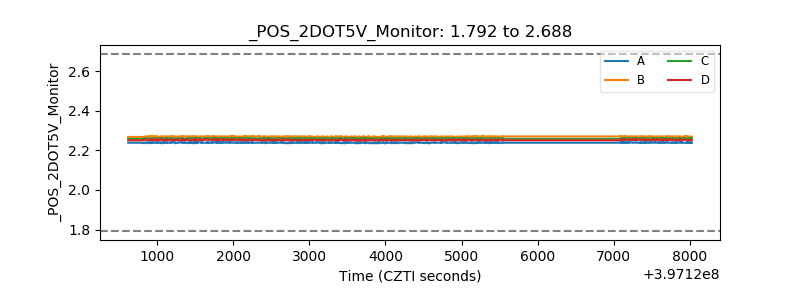 |
| +5 Volts monitor | 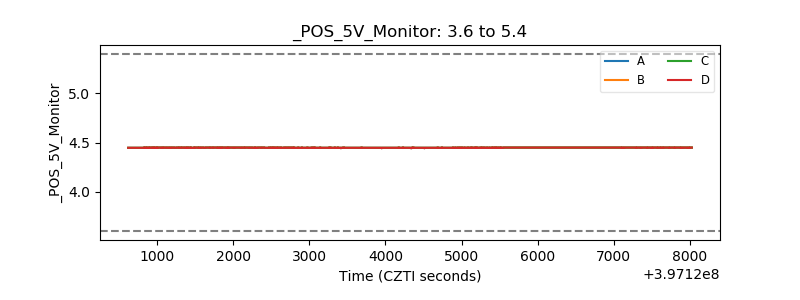 |
| _ROLL_ROT | 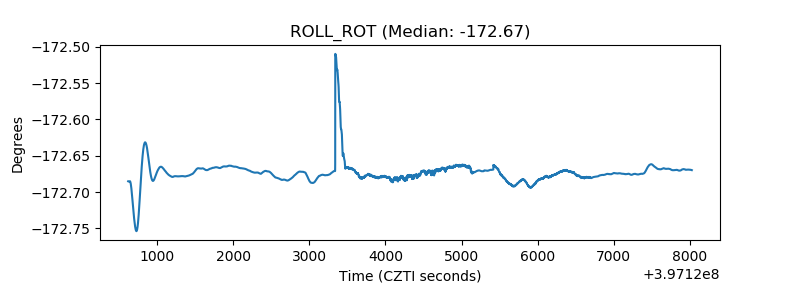 |
| _Roll_DEC | 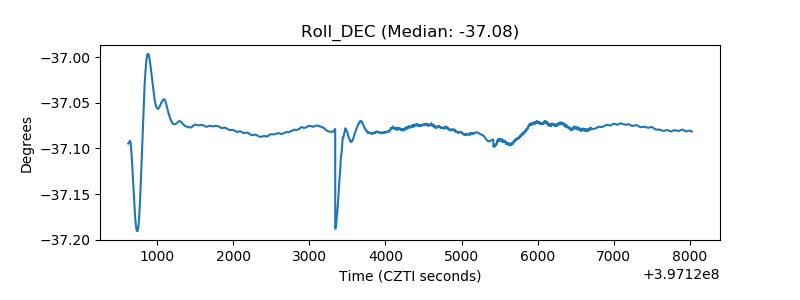 |
| _Roll_RA | 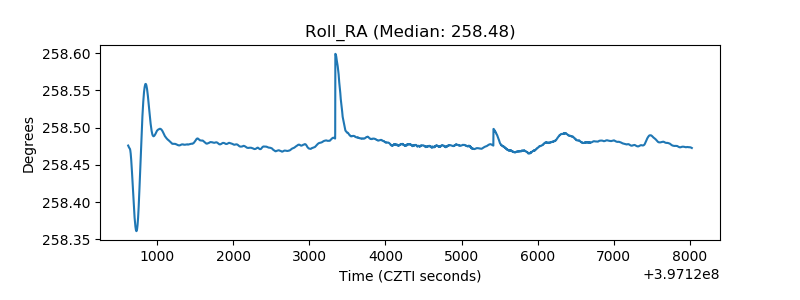 |
| Veto Counter | 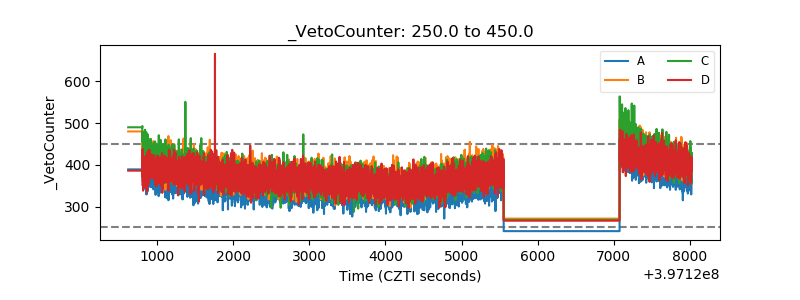 |