| Param | Original file | Final file |
|---|---|---|
| Filename | modeM0/AS1C07_015T02_9000005258_37009cztM0_level2.evt | modeM0/AS1C07_015T02_9000005258_37009cztM0_level2_quad_clean.evt |
| Size (bytes) | 318,801,600 | 66,444,480 |
| Size | 304.0 MB | 63.4 MB |
| Events in quadrant A | 2,013,138 | 436,408 |
| Events in quadrant B | 2,106,053 | 435,986 |
| Events in quadrant C | 2,365,563 | 434,123 |
| Events in quadrant D | 2,886,575 | 412,291 |
| Mode M0 | |||
|---|---|---|---|
| Quadrant | BADHDUFLAG | Total packets | Discarded packets |
| A | 0 | 8681 | 67 |
| B | 0 | 9020 | 70 |
| C | 0 | 9635 | 86 |
| D | 0 | 11444 | 94 |
| Mode SS | |||
|---|---|---|---|
| Quadrant | BADHDUFLAG | Total packets | Discarded packets |
| A | 0 | 83 | 0 |
| B | 0 | 84 | 2 |
| C | 0 | 83 | 3 |
| D | 0 | 84 | 2 |
| Mode M9 | |||
|---|---|---|---|
| Quadrant | BADHDUFLAG | Total packets | Discarded packets |
| A | 0 | 9 | 0 |
| B | 0 | 9 | 0 |
| C | 0 | 9 | 0 |
| D | 0 | 10 | 0 |
| Quadrant | Total seconds | Saturated seconds | Saturation percentage |
|---|---|---|---|
| A | 4171 | 7 | 0.167825% |
| B | 4168 | 35 | 0.839731% |
| C | 4159 | 59 | 1.418610% |
| D | 4168 | 83 | 1.991363% |
Noise dominated data is calculated using 1-second bins in cleaned event files. If a bin has >2000 counts, and if more than 50% of those come from <1% of pixels, then it is considered to be noise-dominated and hence unusable.
| Quadrant | # 1 sec bins | Bins with >0 counts | Bins with >2000 counts | High rate bins dominated by noise | Noise dominated (total time) | Noise dominated (detector-on time) | Marked lightcurve |
|---|---|---|---|---|---|---|---|
| A | 4213 | 4203 | 0 | 0 | 0.00% | 0.00% | 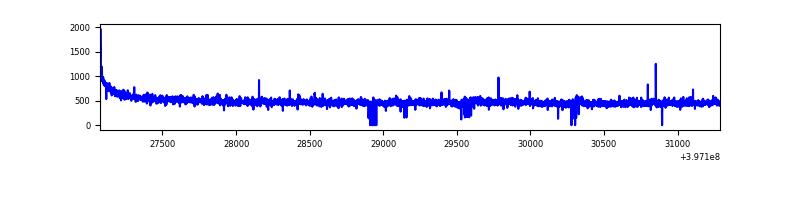 |
| B | 4213 | 4193 | 28 | 28 | 0.66% | 0.67% | 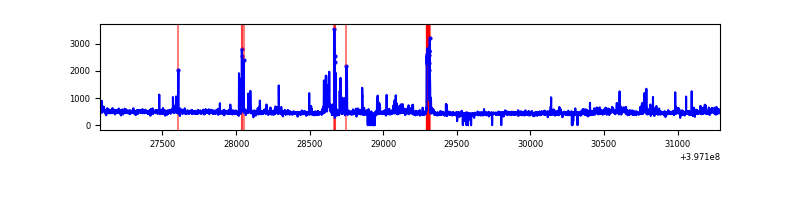 |
| C | 4213 | 4187 | 50 | 50 | 1.19% | 1.19% | 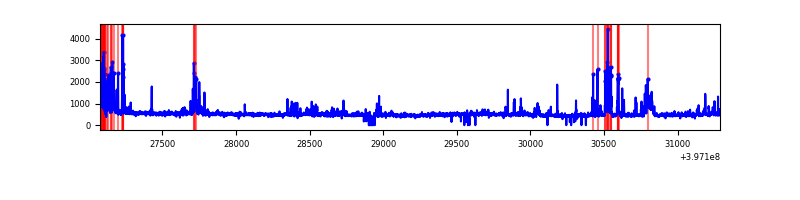 |
| D | 4213 | 4196 | 82 | 82 | 1.95% | 1.95% | 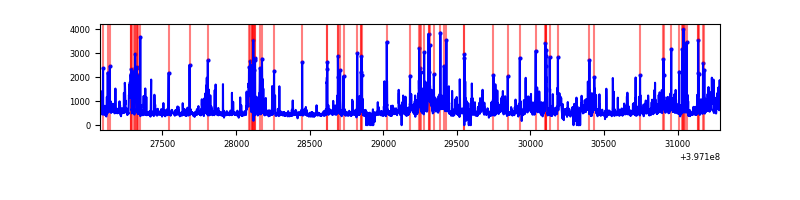 |
Top three noisy pixels from each quadrant. If the there are fewer than three noisy pixels in the level2.evt file, extra rows are filled as -1
| Pixel properties | Quadrant properties | ||||||
|---|---|---|---|---|---|---|---|
| Quadrant | DetID | PixID | Counts | Sigma | Mean | Median | Sigma |
| A | 10 | 83 | 151727 | 1561.76 | 472 | 464 | 96.9 |
| A | 12 | 189 | 21054 | 212.59 | 472 | 464 | 96.9 |
| A | 13 | 6 | 11406 | 112.97 | 472 | 464 | 96.9 |
| B | 5 | 172 | 128153 | 1427.15 | 464 | 453 | 89.5 |
| B | 0 | 213 | 45756 | 506.3 | 464 | 453 | 89.5 |
| B | 5 | 255 | 31086 | 342.35 | 464 | 453 | 89.5 |
| C | 1 | 23 | 176084 | 1658.62 | 452 | 456 | 105.9 |
| C | 15 | 214 | 173503 | 1634.25 | 452 | 456 | 105.9 |
| C | 10 | 20 | 143645 | 1352.27 | 452 | 456 | 105.9 |
| D | 2 | 153 | 319965 | 2863.79 | 454 | 442 | 111.6 |
| D | 1 | 52 | 298844 | 2674.49 | 454 | 442 | 111.6 |
| D | 12 | 235 | 218889 | 1957.88 | 454 | 442 | 111.6 |
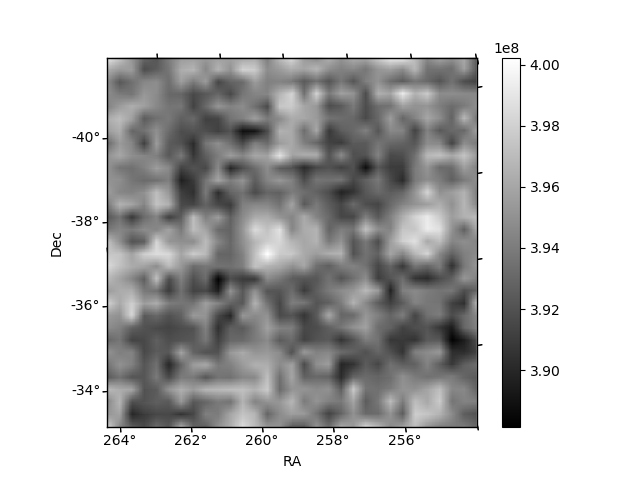
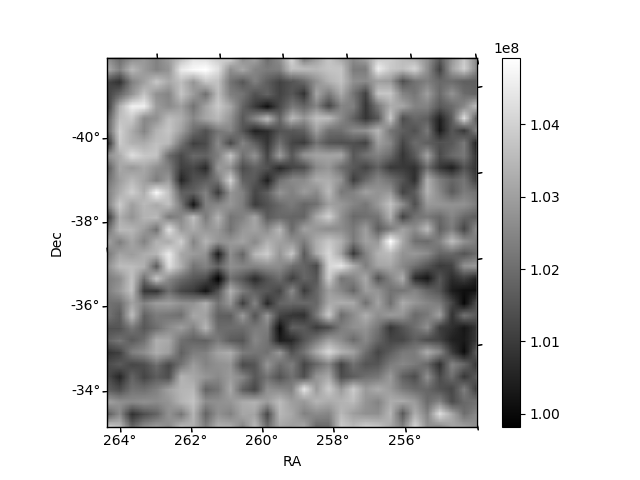
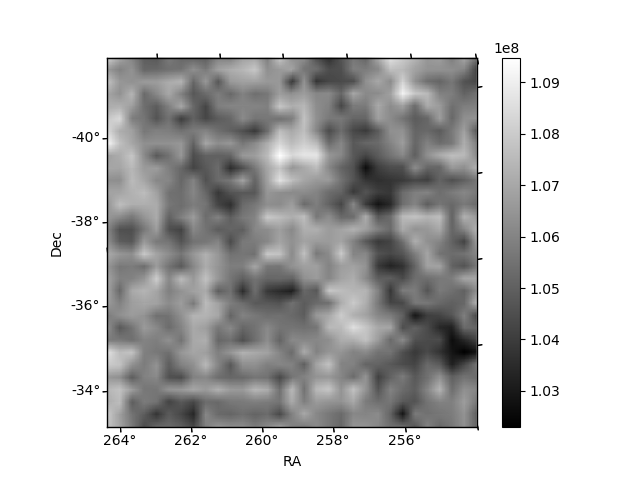
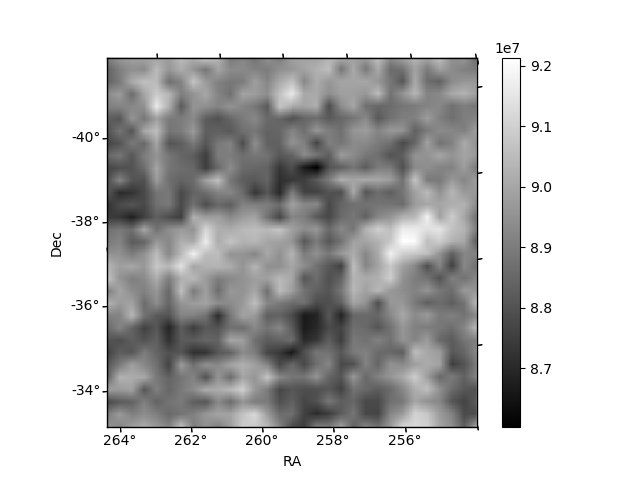
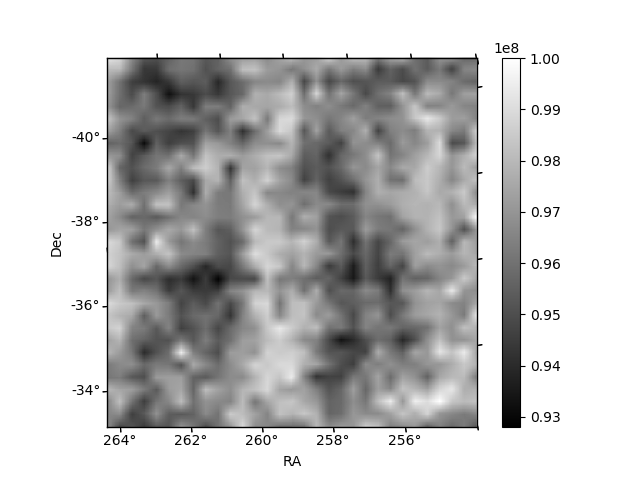
Histogram calculated using DETX and DETY for each event in the final _common_clean file
| Quadrant A | 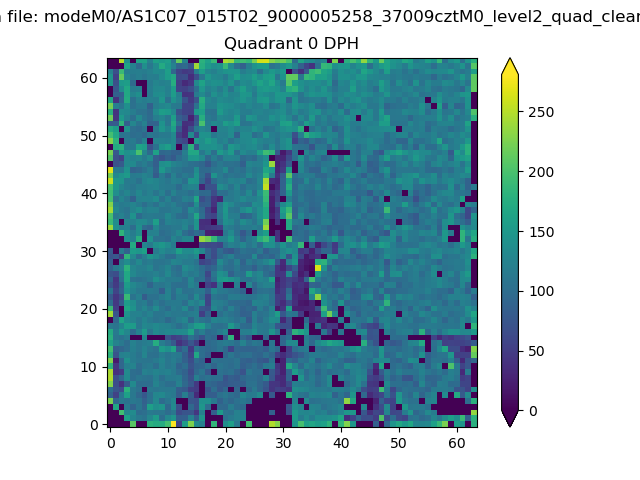 |
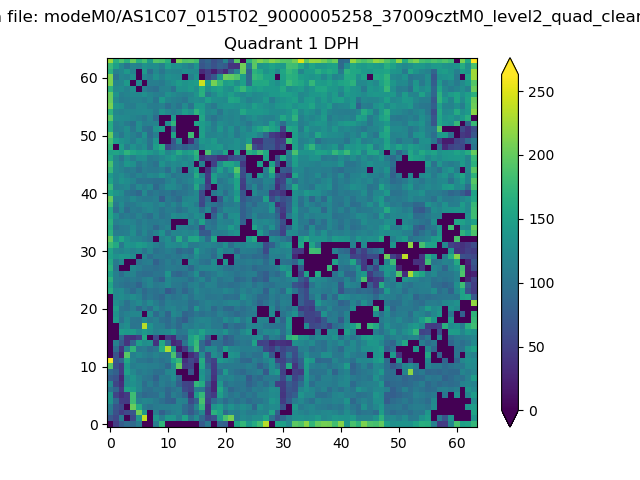 |
Quadrant B |
|---|---|---|---|
| Quadrant D | 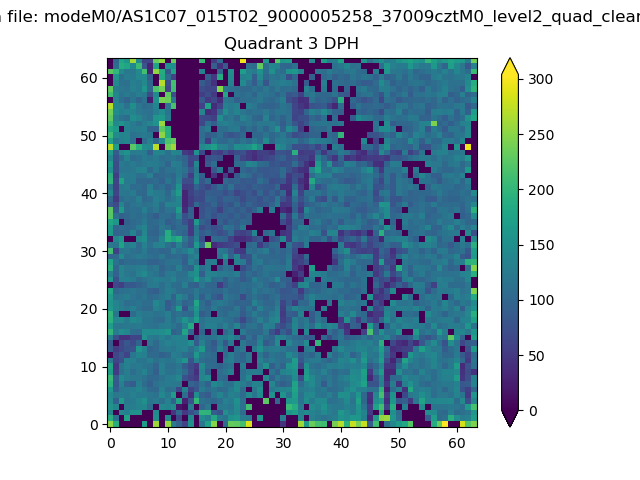 |
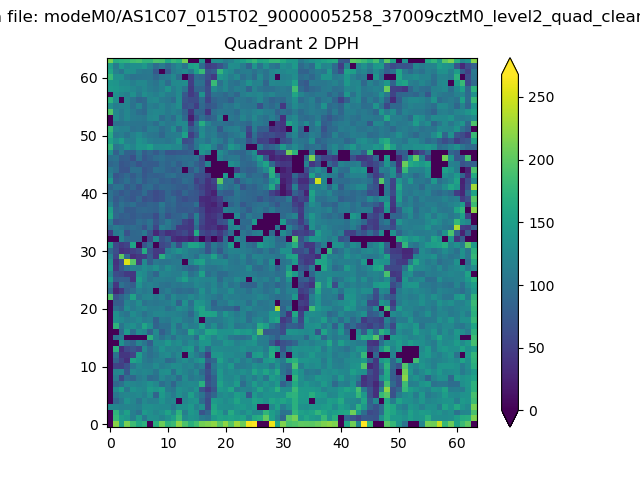 |
Quadrant C |
| Plot type | Count rate plots | Images |
|---|---|---|
| Comparison with Poisson distribution Blue bars denote a histogram of data divided into 1 sec bins. Red curve is a Poisson curve with rate = median count rate of data. |
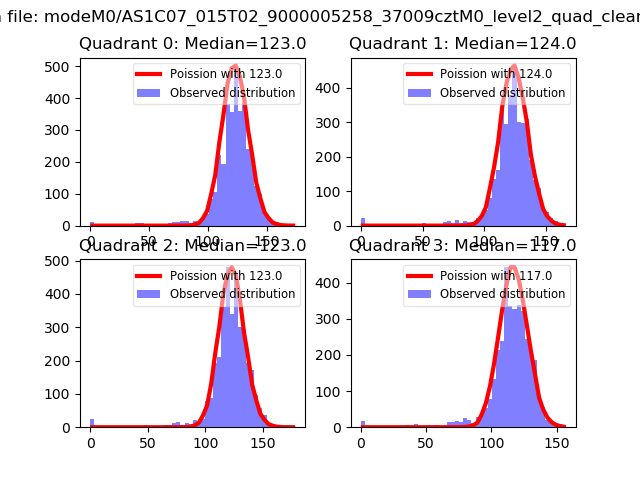 |
 |
| Quadrant-wise count rates Data is divided into 100 sec bins |
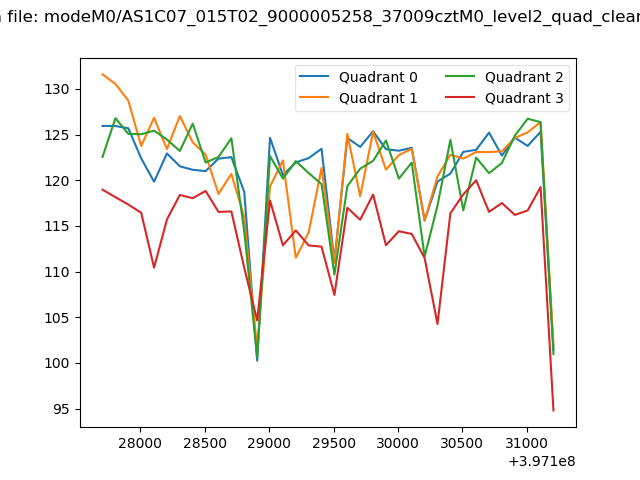 |
|
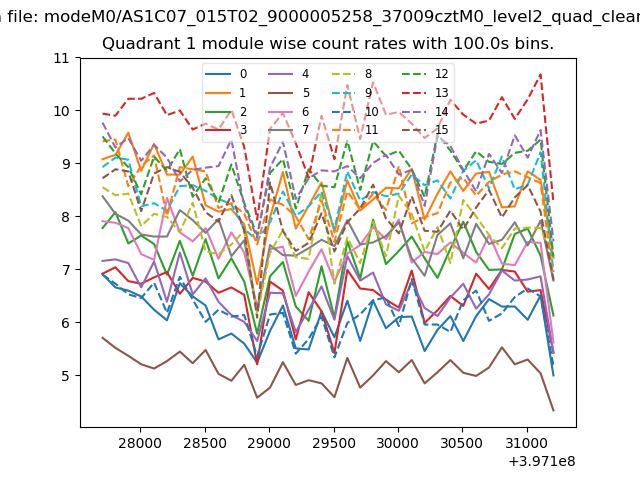
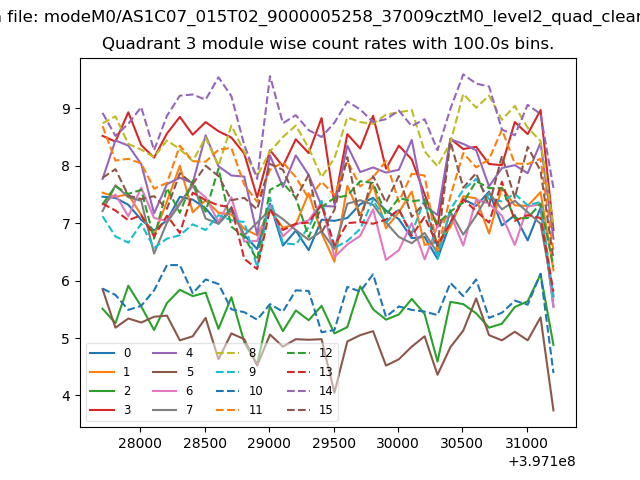
| Module-wise count rates for Quadrant A Data is divided into 100 sec bins |
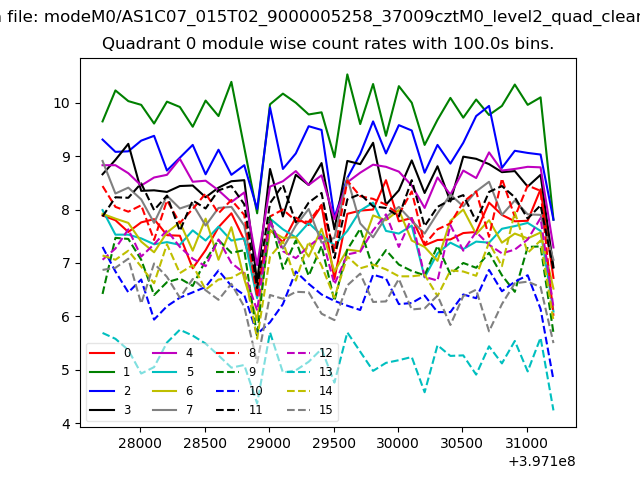 |
 |
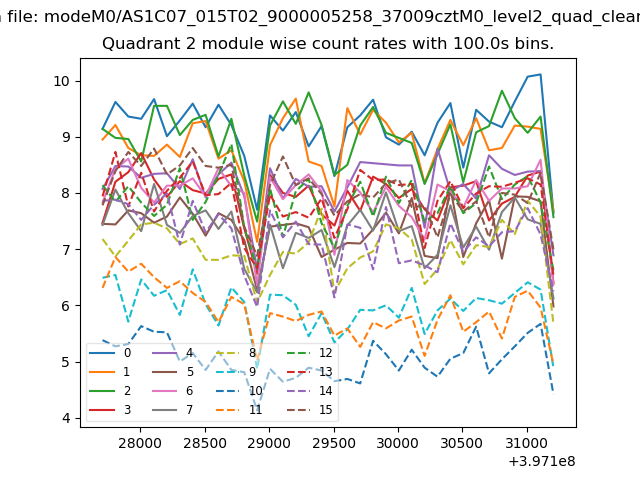
| Module-wise count rates for Quadrant B Data is divided into 100 sec bins |
 |
 |
| Module-wise count rates for Quadrant C Data is divided into 100 sec bins |
 |
 |
| Module-wise count rates for Quadrant D Data is divided into 100 sec bins |
 |
 |
| Parameter | Plot |
|---|---|
| CZT HV Monitor | 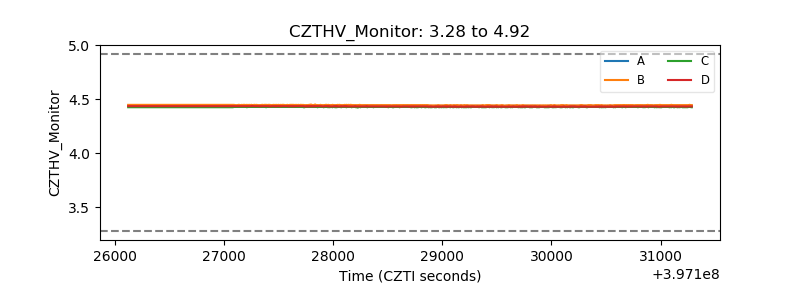 |
| D_VDD | 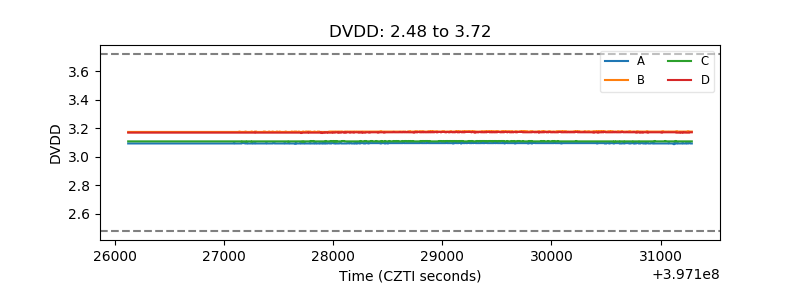 |
| Temperature 1 |  |
| Veto HV Monitor | 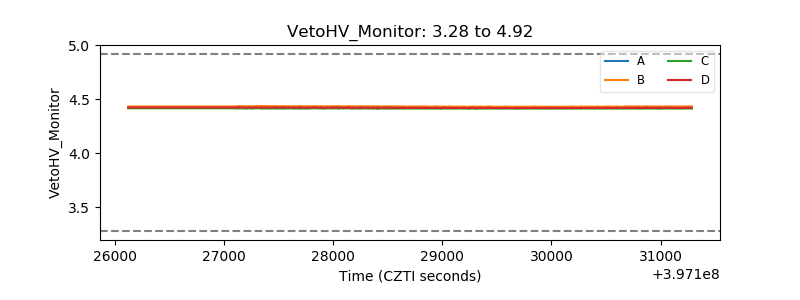 |
| Veto LLD | 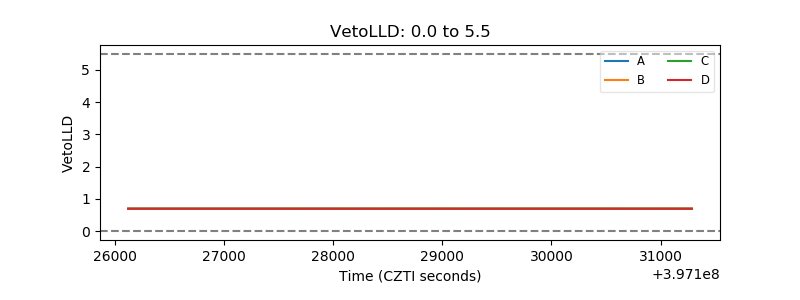 |
| Alpha Counter | 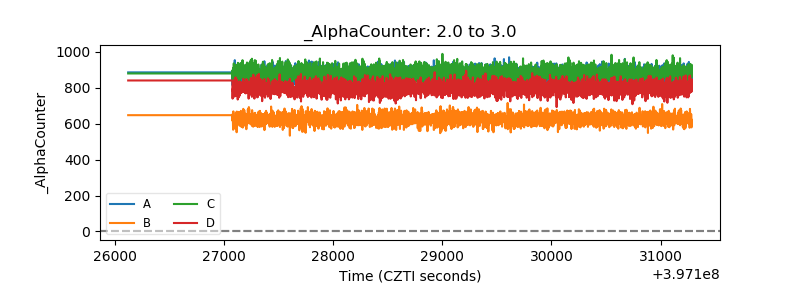 |
| _CPM_Rate | 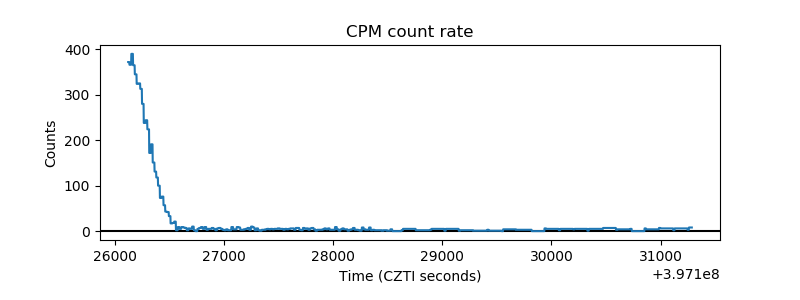 |
| CZT Counter | 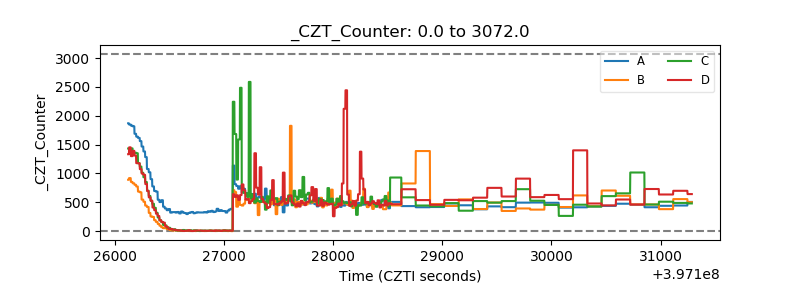 |
| +2.5 Volts monitor |  |
| +5 Volts monitor |  |
| _ROLL_ROT | 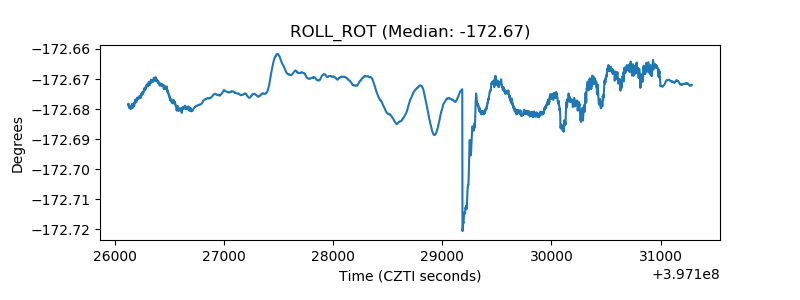 |
| _Roll_DEC | 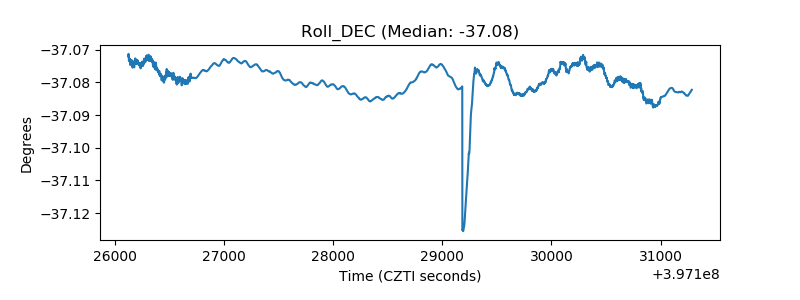 |
| _Roll_RA | 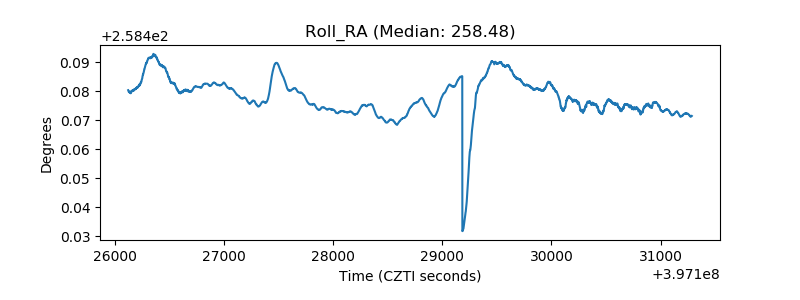 |
| Veto Counter | 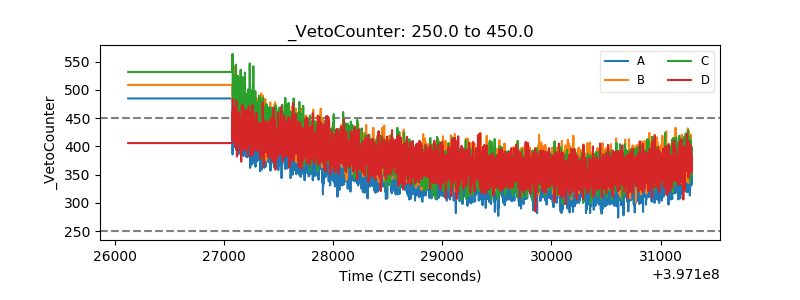 |