| Param | Original file | Final file |
|---|---|---|
| Filename | modeM0/AS1C07_015T03_9000005260cztM0_level2.fits | modeM0/AS1C07_015T03_9000005260cztM0_level2_quad_clean.evt |
| Size (bytes) | 78,644,160 | 80,997,120 |
| Size | 75.0 MB | 77.2 MB |
| Events in quadrant A | 487,400 | 499,069 |
| Events in quadrant B | 461,148 | 499,062 |
| Events in quadrant C | 471,664 | 472,584 |
| Events in quadrant D | 417,620 | 437,392 |
| Mode SS | |||
|---|---|---|---|
| Quadrant | BADHDUFLAG | Total packets | Discarded packets |
| A | 0 | 160 | 0 |
| B | 0 | 160 | 0 |
| C | 0 | 160 | 0 |
| D | 0 | 160 | 0 |
| Mode M9 | |||
|---|---|---|---|
| Quadrant | BADHDUFLAG | Total packets | Discarded packets |
| A | 0 | 26 | 0 |
| B | 0 | 26 | 0 |
| C | 0 | 26 | 0 |
| D | 0 | 26 | 0 |
| Mode M0 | |||
|---|---|---|---|
| Quadrant | BADHDUFLAG | Total packets | Discarded packets |
| A | 0 | 16551 | 0 |
| B | 0 | 18680 | 0 |
| C | 0 | 19691 | 0 |
| D | 0 | 17861 | 0 |
| Quadrant | Total seconds | Saturated seconds | Saturation percentage |
|---|---|---|---|
| A | 7823 | 19 | 0.242874% |
| B | 7823 | 215 | 2.748306% |
| C | 7823 | 200 | 2.556564% |
| D | 7823 | 79 | 1.009843% |
Noise dominated data is calculated using 1-second bins in cleaned event files. If a bin has >2000 counts, and if more than 50% of those come from <1% of pixels, then it is considered to be noise-dominated and hence unusable.
| Quadrant | # 1 sec bins | Bins with >0 counts | Bins with >2000 counts | High rate bins dominated by noise | Noise dominated (total time) | Noise dominated (detector-on time) | Marked lightcurve |
|---|---|---|---|---|---|---|---|
| A | 9615 | 7822 | 0 | 0 | 0.00% | 0.00% |  |
| B | 9615 | 7817 | 0 | 0 | 0.00% | 0.00% |  |
| C | 9615 | 7819 | 0 | 0 | 0.00% | 0.00% |  |
| D | 9615 | 7819 | 0 | 0 | 0.00% | 0.00% |  |
Top three noisy pixels from each quadrant. If the there are fewer than three noisy pixels in the level2.evt file, extra rows are filled as -1
| Pixel properties | Quadrant properties | ||||||
|---|---|---|---|---|---|---|---|
| Quadrant | DetID | PixID | Counts | Sigma | Mean | Median | Sigma |
| A | 9 | 19 | 422 | 9.15 | 127 | 120 | 33.0 |
| A | 0 | 29 | 389 | 8.15 | 127 | 120 | 33.0 |
| A | 7 | 110 | 384 | 8.0 | 127 | 120 | 33.0 |
| B | 2 | 9 | 404 | 11.01 | 121 | 116 | 26.2 |
| B | 2 | 8 | 329 | 8.14 | 121 | 116 | 26.2 |
| B | 3 | 17 | 320 | 7.8 | 121 | 116 | 26.2 |
| C | 1 | 81 | 368 | 7.36 | 125 | 118 | 34.0 |
| C | 1 | 80 | 364 | 7.24 | 125 | 118 | 34.0 |
| C | 3 | 203 | 363 | 7.21 | 125 | 118 | 34.0 |
| D | 10 | 189 | 336 | 6.86 | 119 | 109 | 33.1 |
| D | 7 | 3 | 312 | 6.14 | 119 | 109 | 33.1 |
| D | 11 | 66 | 295 | 5.62 | 119 | 109 | 33.1 |
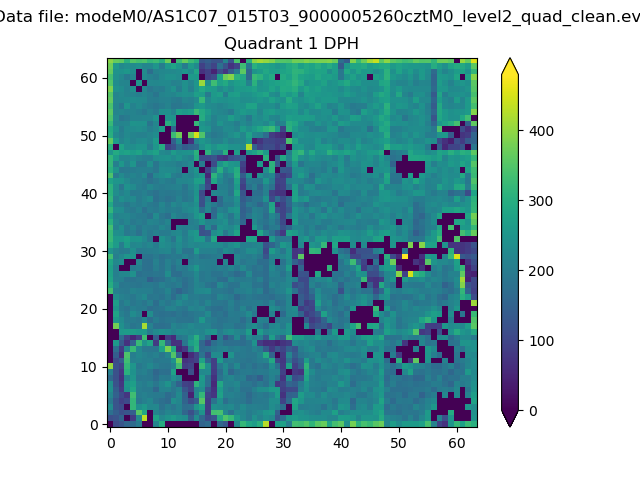
Histogram calculated using DETX and DETY for each event in the final _common_clean file
| Quadrant A |  |
 |
Quadrant B |
|---|---|---|---|
| Quadrant D |  |
 |
Quadrant C |
| Plot type | Count rate plots | Images |
|---|---|---|
| Comparison with Poisson distribution Blue bars denote a histogram of data divided into 1 sec bins. Red curve is a Poisson curve with rate = median count rate of data. |
 |
 |
| Quadrant-wise count rates Data is divided into 100 sec bins |
 |
|
| Module-wise count rates for Quadrant A Data is divided into 100 sec bins |
 |
 |
| Module-wise count rates for Quadrant B Data is divided into 100 sec bins |
 |
 |
| Module-wise count rates for Quadrant C Data is divided into 100 sec bins |
 |
 |
| Module-wise count rates for Quadrant D Data is divided into 100 sec bins |
 |
 |
| Parameter | Plot |
|---|---|
| CZT HV Monitor |  |
| D_VDD |  |
| Temperature 1 |  |
| Veto HV Monitor |  |
| Veto LLD |  |
| Alpha Counter |  |
| _CPM_Rate |  |
| CZT Counter |  |
| +2.5 Volts monitor |  |
| +5 Volts monitor |  |
| _ROLL_ROT |  |
| _Roll_DEC |  |
| _Roll_RA |  |
| Veto Counter |  |