| Param | Original file | Final file |
|---|---|---|
| Filename | modeM0/AS1C07_015T03_9000005260_37011cztM0_level2.evt | modeM0/AS1C07_015T03_9000005260_37011cztM0_level2_quad_clean.evt |
| Size (bytes) | 438,834,240 | 71,645,760 |
| Size | 418.5 MB | 68.3 MB |
| Events in quadrant A | 2,754,216 | 458,128 |
| Events in quadrant B | 3,313,577 | 464,337 |
| Events in quadrant C | 3,745,224 | 445,040 |
| Events in quadrant D | 3,114,813 | 428,339 |
| Mode SS | |||
|---|---|---|---|
| Quadrant | BADHDUFLAG | Total packets | Discarded packets |
| A | 0 | 110 | 0 |
| B | 0 | 110 | 0 |
| C | 0 | 110 | 0 |
| D | 0 | 110 | 0 |
| Mode M9 | |||
|---|---|---|---|
| Quadrant | BADHDUFLAG | Total packets | Discarded packets |
| A | 0 | 26 | 0 |
| B | 0 | 26 | 0 |
| C | 0 | 26 | 0 |
| D | 0 | 26 | 0 |
| Mode M0 | |||
|---|---|---|---|
| Quadrant | BADHDUFLAG | Total packets | Discarded packets |
| A | 0 | 11526 | 3 |
| B | 0 | 13213 | 2 |
| C | 0 | 14498 | 2 |
| D | 0 | 12742 | 2 |
| Quadrant | Total seconds | Saturated seconds | Saturation percentage |
|---|---|---|---|
| A | 5329 | 19 | 0.356540% |
| B | 5329 | 206 | 3.865641% |
| C | 5329 | 188 | 3.527866% |
| D | 5329 | 76 | 1.426159% |
Noise dominated data is calculated using 1-second bins in cleaned event files. If a bin has >2000 counts, and if more than 50% of those come from <1% of pixels, then it is considered to be noise-dominated and hence unusable.
| Quadrant | # 1 sec bins | Bins with >0 counts | Bins with >2000 counts | High rate bins dominated by noise | Noise dominated (total time) | Noise dominated (detector-on time) | Marked lightcurve |
|---|---|---|---|---|---|---|---|
| A | 7122 | 5330 | 2 | 2 | 0.03% | 0.04% | 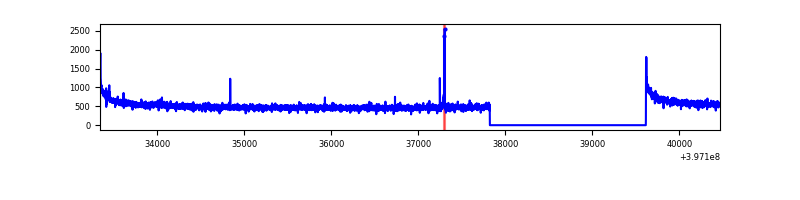 |
| B | 7122 | 5330 | 127 | 127 | 1.78% | 2.38% | 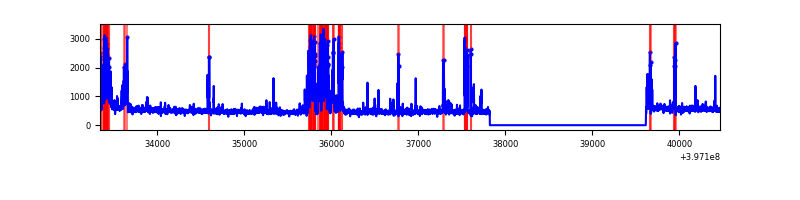 |
| C | 7122 | 5330 | 177 | 177 | 2.49% | 3.32% | 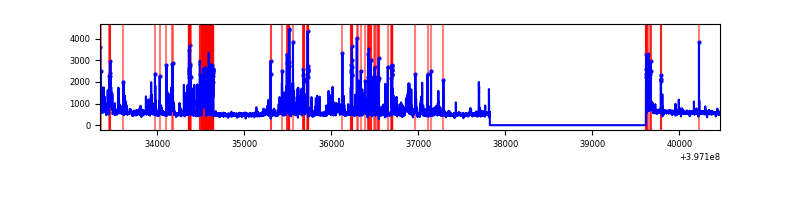 |
| D | 7122 | 5330 | 65 | 65 | 0.91% | 1.22% | 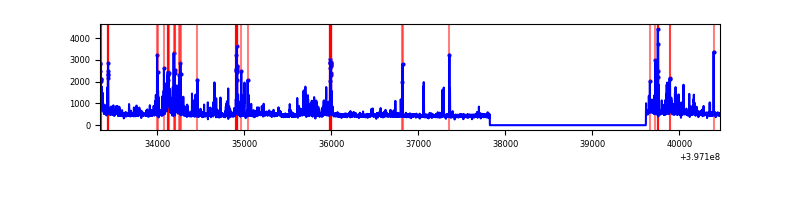 |
Top three noisy pixels from each quadrant. If the there are fewer than three noisy pixels in the level2.evt file, extra rows are filled as -1
| Pixel properties | Quadrant properties | ||||||
|---|---|---|---|---|---|---|---|
| Quadrant | DetID | PixID | Counts | Sigma | Mean | Median | Sigma |
| A | 10 | 83 | 211902 | 1612.9 | 652 | 639 | 131.0 |
| A | 9 | 143 | 18665 | 137.62 | 652 | 639 | 131.0 |
| A | 3 | 137 | 6658 | 45.95 | 652 | 639 | 131.0 |
| B | 5 | 172 | 733249 | 6028.53 | 638 | 622 | 121.5 |
| B | 4 | 81 | 38213 | 309.32 | 638 | 622 | 121.5 |
| B | 0 | 213 | 29911 | 241.0 | 638 | 622 | 121.5 |
| C | 1 | 23 | 826517 | 5692.69 | 629 | 636 | 145.1 |
| C | 15 | 214 | 228935 | 1573.64 | 629 | 636 | 145.1 |
| C | 10 | 20 | 110516 | 757.39 | 629 | 636 | 145.1 |
| D | 2 | 250 | 161449 | 1058.15 | 629 | 613 | 152.0 |
| D | 12 | 235 | 134876 | 883.32 | 629 | 613 | 152.0 |
| D | 1 | 52 | 131996 | 864.38 | 629 | 613 | 152.0 |
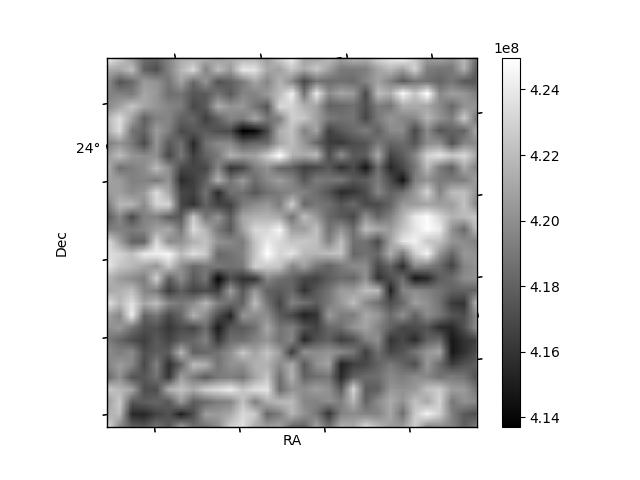
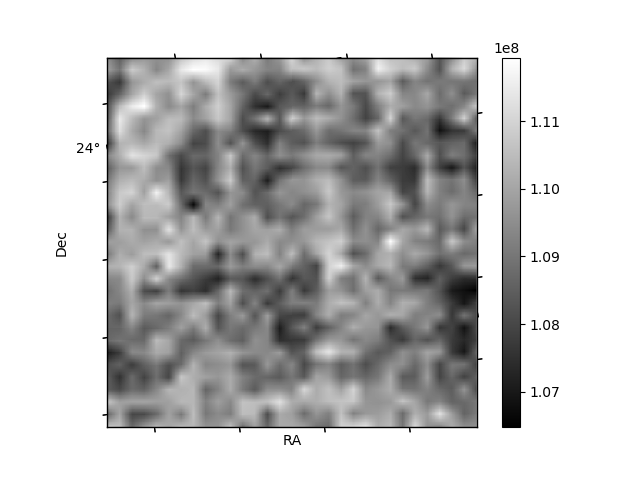
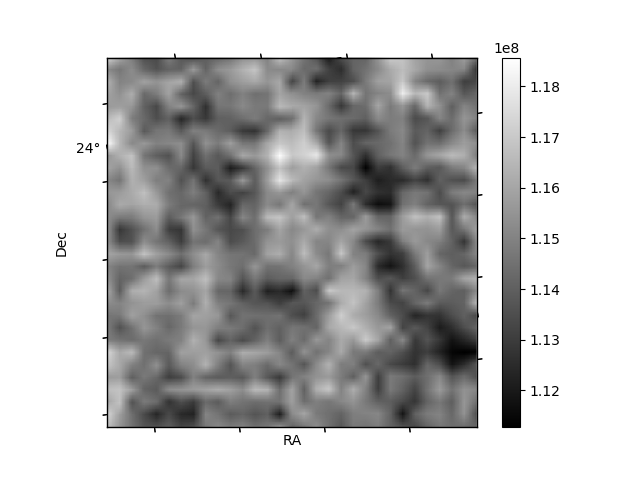
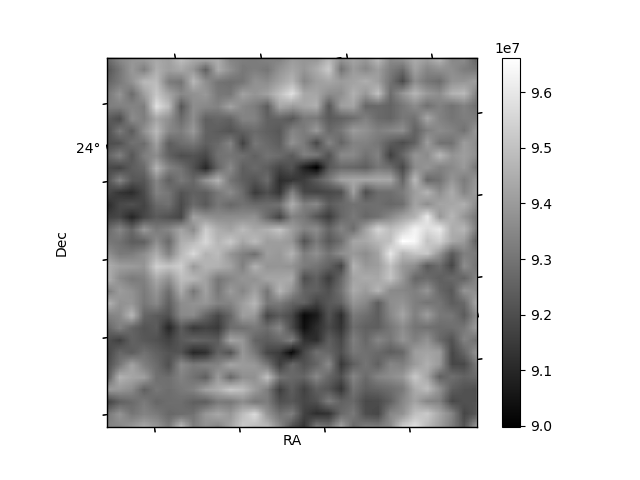
Histogram calculated using DETX and DETY for each event in the final _common_clean file
| Quadrant A | 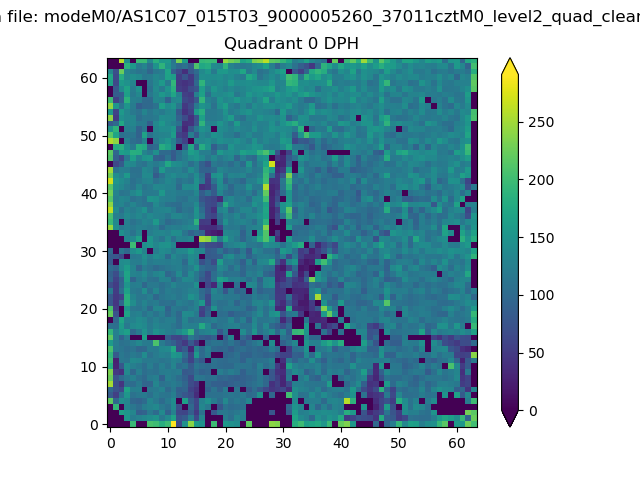 |
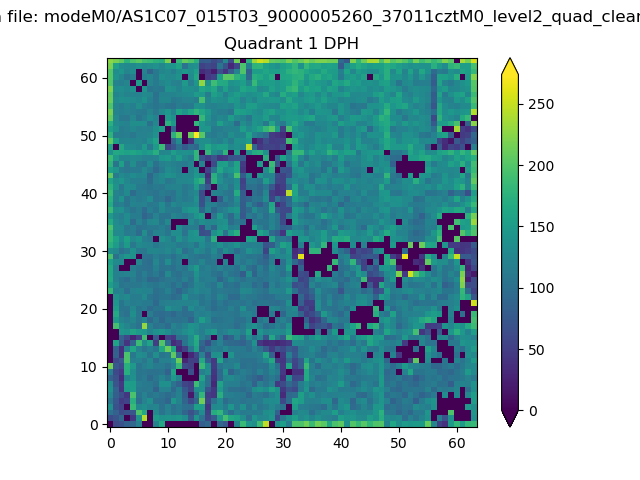 |
Quadrant B |
|---|---|---|---|
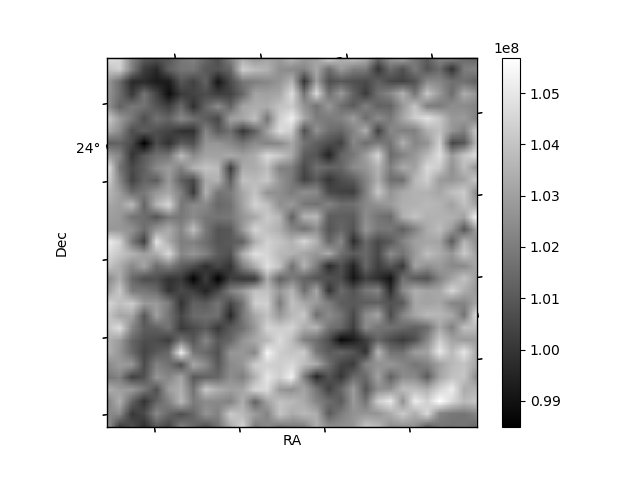
| Quadrant D | 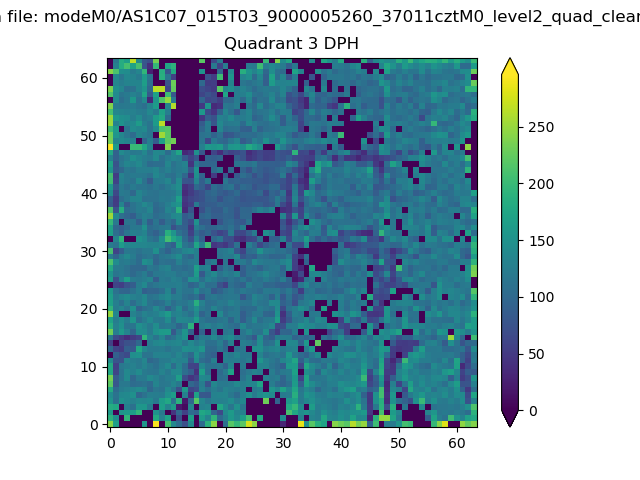 |
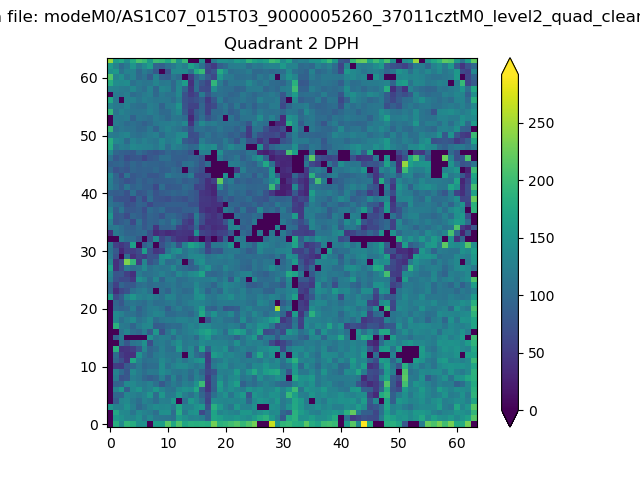 |
Quadrant C |
| Plot type | Count rate plots | Images |
|---|---|---|
| Comparison with Poisson distribution Blue bars denote a histogram of data divided into 1 sec bins. Red curve is a Poisson curve with rate = median count rate of data. |
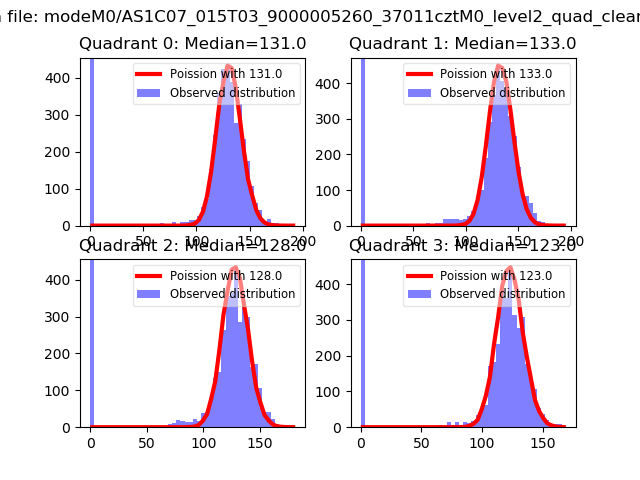 |
 |
| Quadrant-wise count rates Data is divided into 100 sec bins |
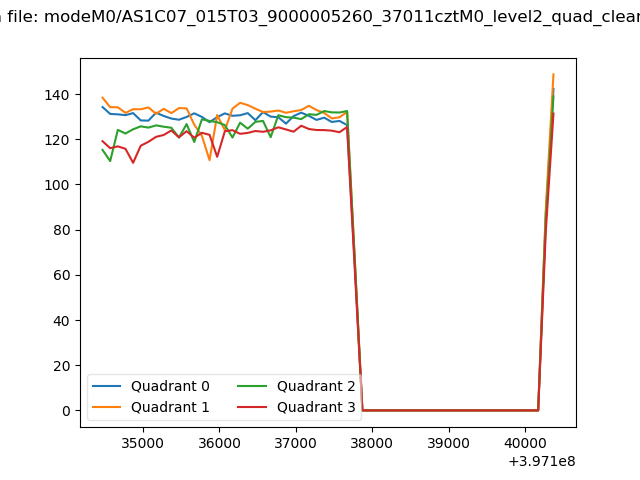 |
|
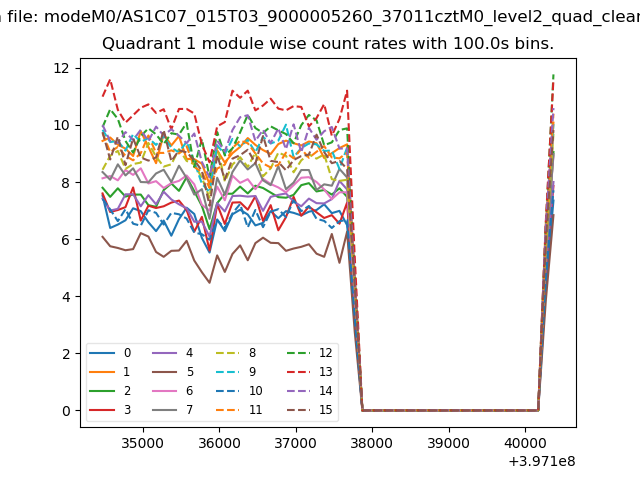
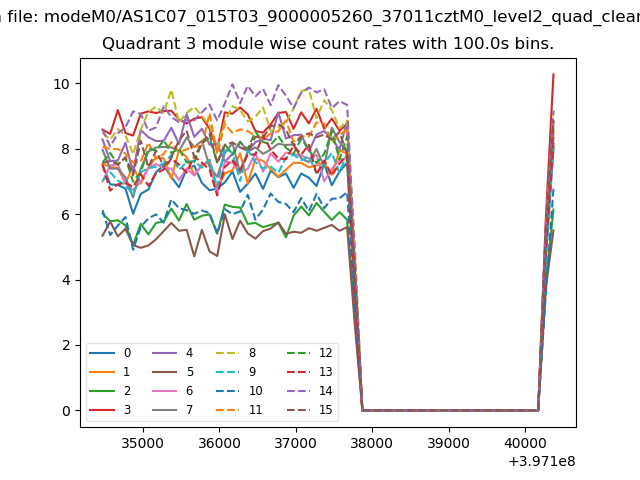
| Module-wise count rates for Quadrant A Data is divided into 100 sec bins |
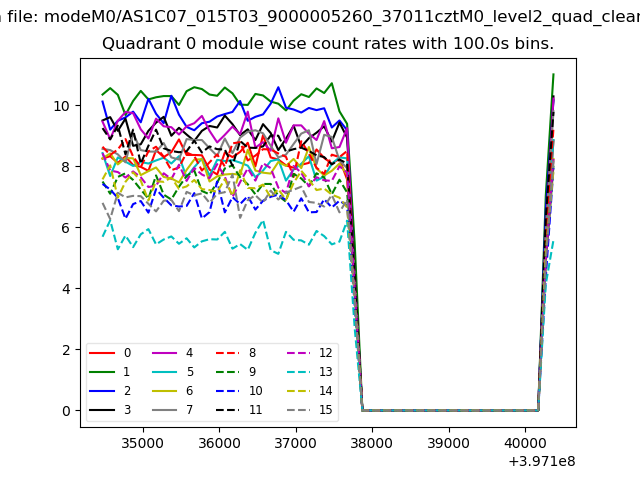 |
 |
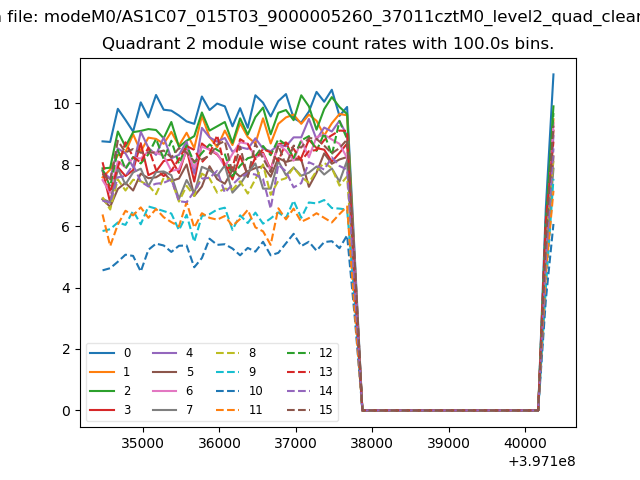
| Module-wise count rates for Quadrant B Data is divided into 100 sec bins |
 |
 |
| Module-wise count rates for Quadrant C Data is divided into 100 sec bins |
 |
 |
| Module-wise count rates for Quadrant D Data is divided into 100 sec bins |
 |
 |
| Parameter | Plot |
|---|---|
| CZT HV Monitor | 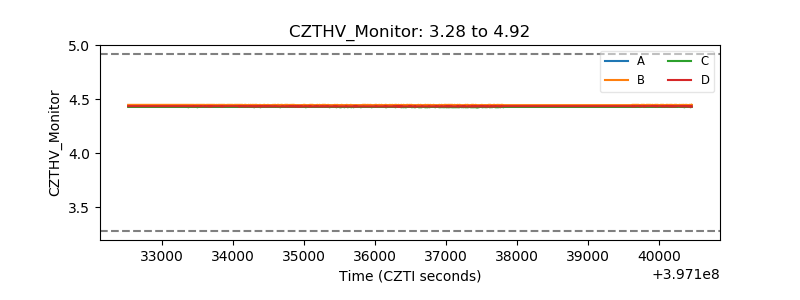 |
| D_VDD | 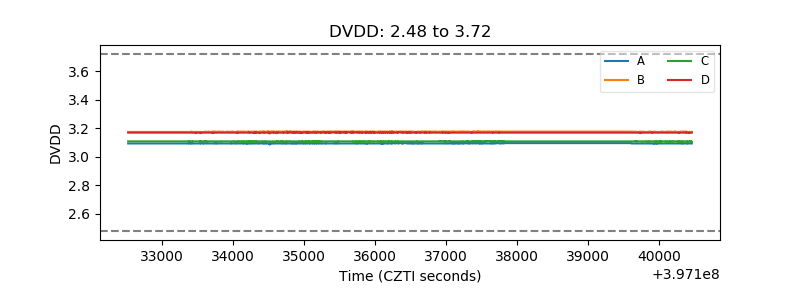 |
| Temperature 1 | 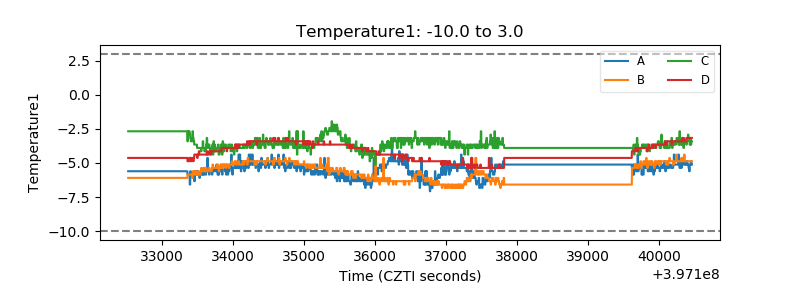 |
| Veto HV Monitor | 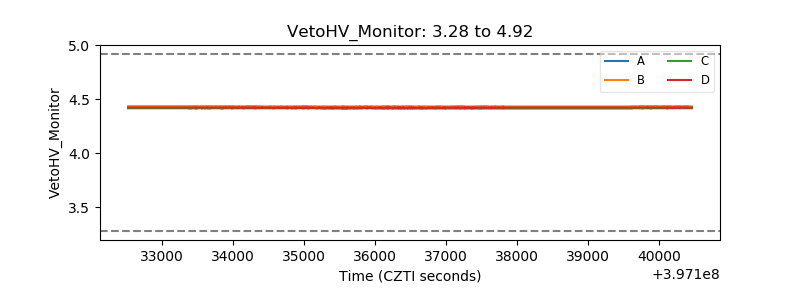 |
| Veto LLD | 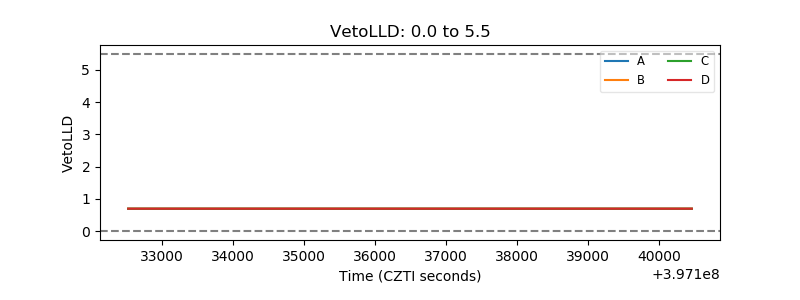 |
| Alpha Counter | 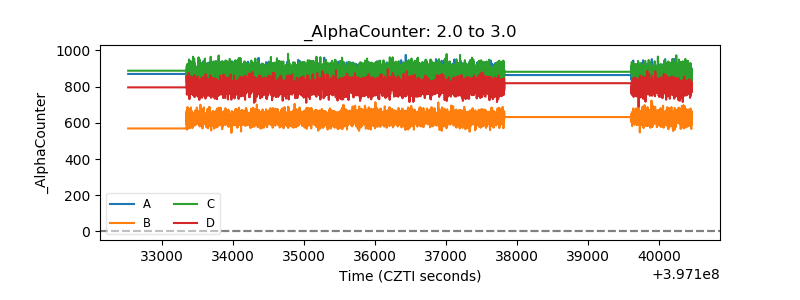 |
| _CPM_Rate | 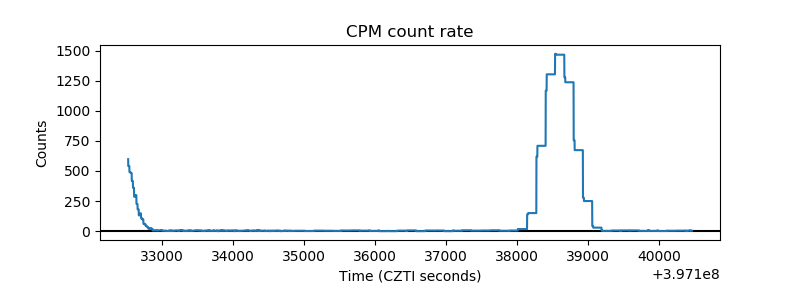 |
| CZT Counter | 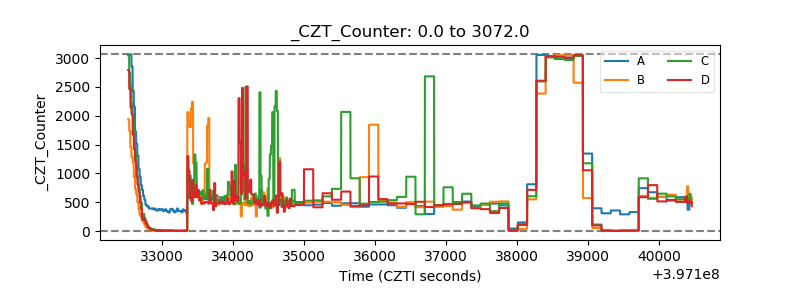 |
| +2.5 Volts monitor | 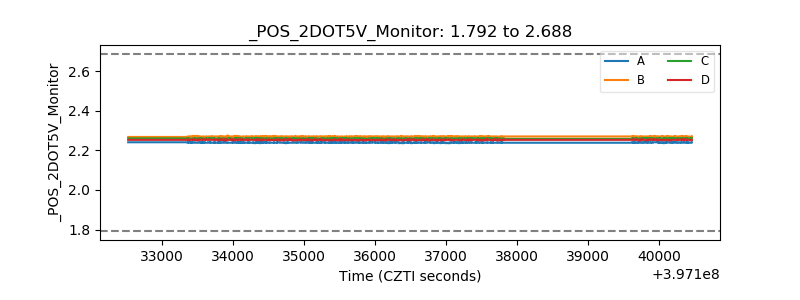 |
| +5 Volts monitor | 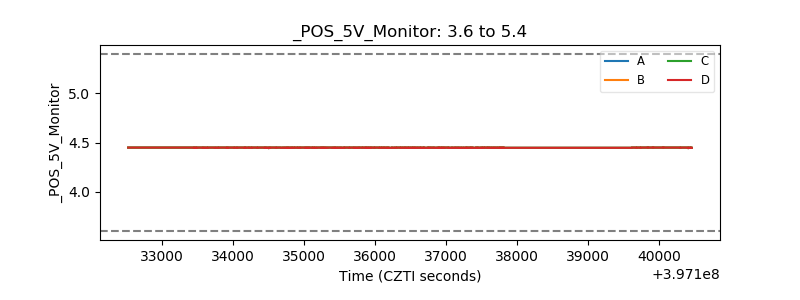 |
| _ROLL_ROT | 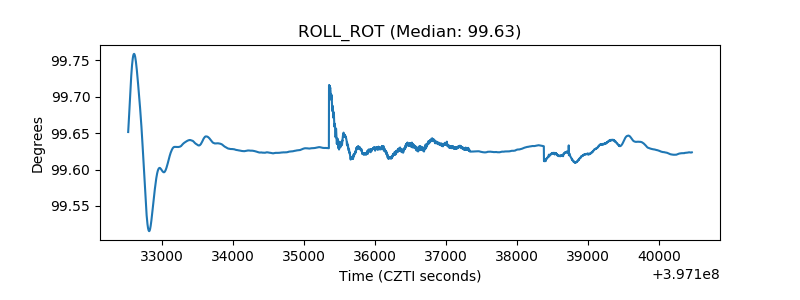 |
| _Roll_DEC | 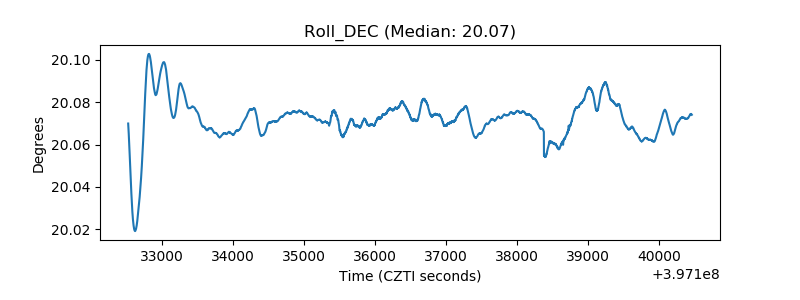 |
| _Roll_RA | 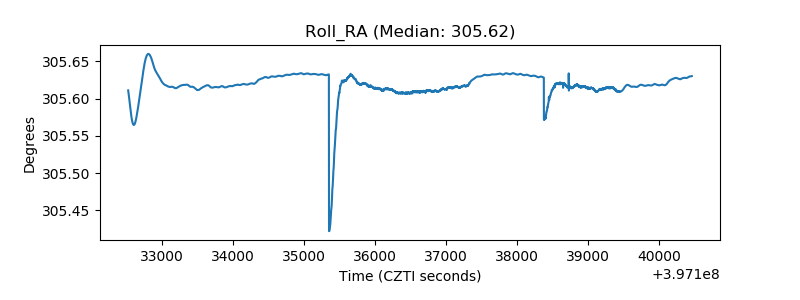 |
| Veto Counter | 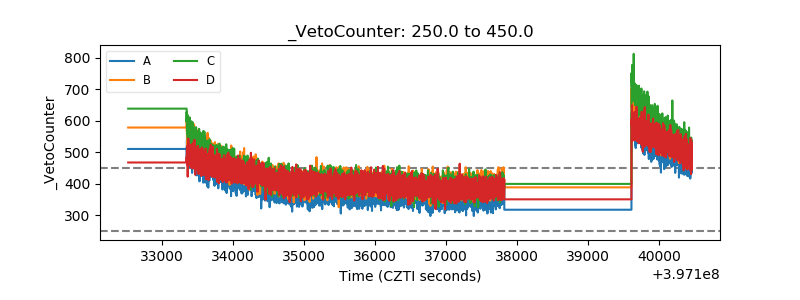 |