| Param | Original file | Final file |
|---|---|---|
| Filename | modeM0/AS1C07_015T03_9000005260_37012cztM0_level2.evt | modeM0/AS1C07_015T03_9000005260_37012cztM0_level2_quad_clean.evt |
| Size (bytes) | 295,542,720 | 70,004,160 |
| Size | 281.9 MB | 66.8 MB |
| Events in quadrant A | 2,083,421 | 462,120 |
| Events in quadrant B | 2,258,110 | 473,050 |
| Events in quadrant C | 2,261,434 | 459,370 |
| Events in quadrant D | 2,069,644 | 438,148 |
| Mode SS | |||
|---|---|---|---|
| Quadrant | BADHDUFLAG | Total packets | Discarded packets |
| A | 0 | 86 | 0 |
| B | 0 | 86 | 0 |
| C | 0 | 86 | 0 |
| D | 0 | 86 | 0 |
| Mode M9 | |||
|---|---|---|---|
| Quadrant | BADHDUFLAG | Total packets | Discarded packets |
| A | 0 | 17 | 0 |
| B | 0 | 17 | 0 |
| C | 0 | 17 | 0 |
| D | 0 | 17 | 0 |
| Mode M0 | |||
|---|---|---|---|
| Quadrant | BADHDUFLAG | Total packets | Discarded packets |
| A | 0 | 8687 | 1 |
| B | 0 | 9203 | 1 |
| C | 0 | 9045 | 1 |
| D | 0 | 8801 | 1 |
| Quadrant | Total seconds | Saturated seconds | Saturation percentage |
|---|---|---|---|
| A | 4063 | 7 | 0.172286% |
| B | 4063 | 51 | 1.255230% |
| C | 4063 | 33 | 0.812208% |
| D | 4063 | 16 | 0.393798% |
Noise dominated data is calculated using 1-second bins in cleaned event files. If a bin has >2000 counts, and if more than 50% of those come from <1% of pixels, then it is considered to be noise-dominated and hence unusable.
| Quadrant | # 1 sec bins | Bins with >0 counts | Bins with >2000 counts | High rate bins dominated by noise | Noise dominated (total time) | Noise dominated (detector-on time) | Marked lightcurve |
|---|---|---|---|---|---|---|---|
| A | 5856 | 4064 | 2 | 2 | 0.03% | 0.05% | 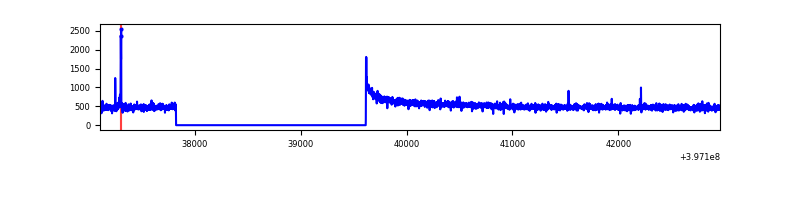 |
| B | 5856 | 4064 | 32 | 32 | 0.55% | 0.79% | 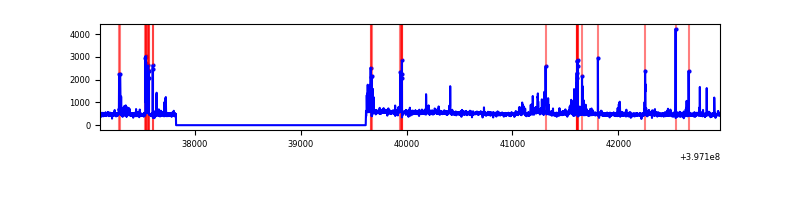 |
| C | 5856 | 4064 | 27 | 27 | 0.46% | 0.66% | 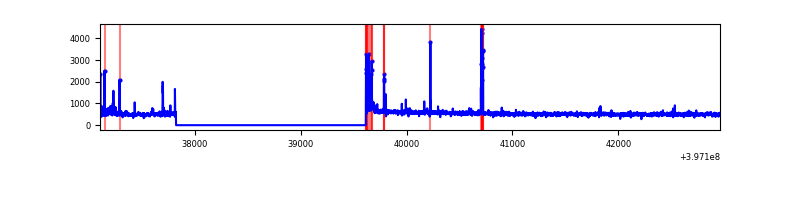 |
| D | 5856 | 4064 | 10 | 10 | 0.17% | 0.25% | 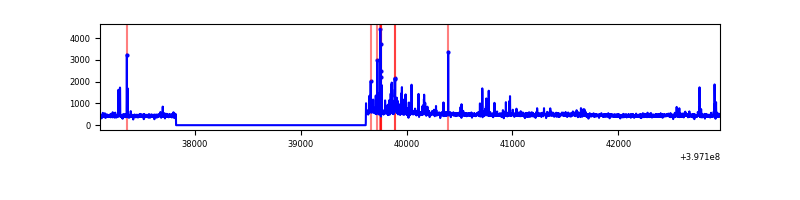 |
Top three noisy pixels from each quadrant. If the there are fewer than three noisy pixels in the level2.evt file, extra rows are filled as -1
| Pixel properties | Quadrant properties | ||||||
|---|---|---|---|---|---|---|---|
| Quadrant | DetID | PixID | Counts | Sigma | Mean | Median | Sigma |
| A | 10 | 83 | 132255 | 1308.65 | 501 | 492 | 100.7 |
| A | 9 | 143 | 16969 | 163.65 | 501 | 492 | 100.7 |
| A | 3 | 137 | 5025 | 45.02 | 501 | 492 | 100.7 |
| B | 5 | 172 | 166500 | 1764.33 | 494 | 483 | 94.1 |
| B | 4 | 81 | 124121 | 1313.95 | 494 | 483 | 94.1 |
| B | 12 | 111 | 11349 | 115.48 | 494 | 483 | 94.1 |
| C | 15 | 214 | 172193 | 1496.84 | 491 | 495 | 114.7 |
| C | 0 | 10 | 67555 | 584.62 | 491 | 495 | 114.7 |
| C | 1 | 23 | 61469 | 531.56 | 491 | 495 | 114.7 |
| D | 2 | 250 | 104381 | 868.11 | 490 | 478 | 119.7 |
| D | 12 | 235 | 34994 | 288.38 | 490 | 478 | 119.7 |
| D | 2 | 153 | 34086 | 280.8 | 490 | 478 | 119.7 |
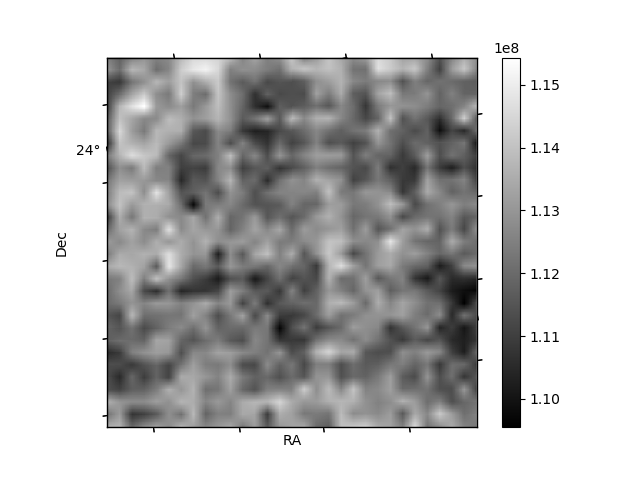
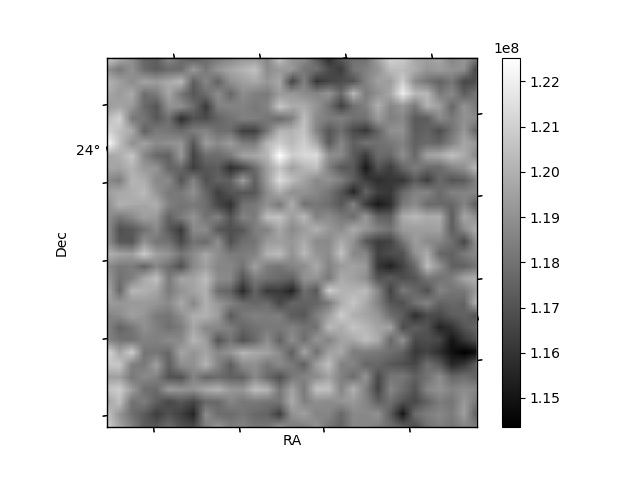
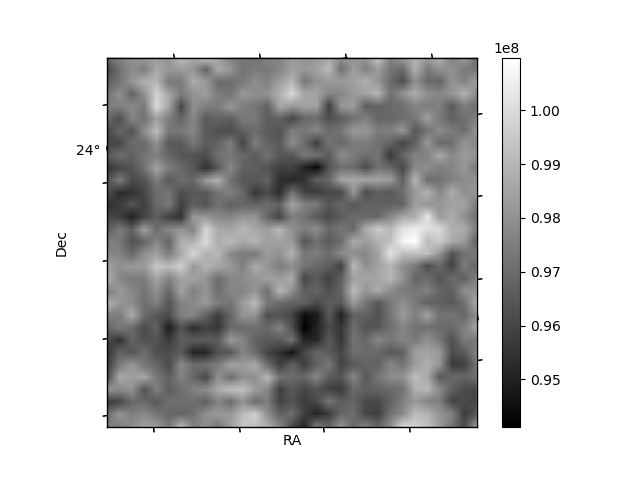
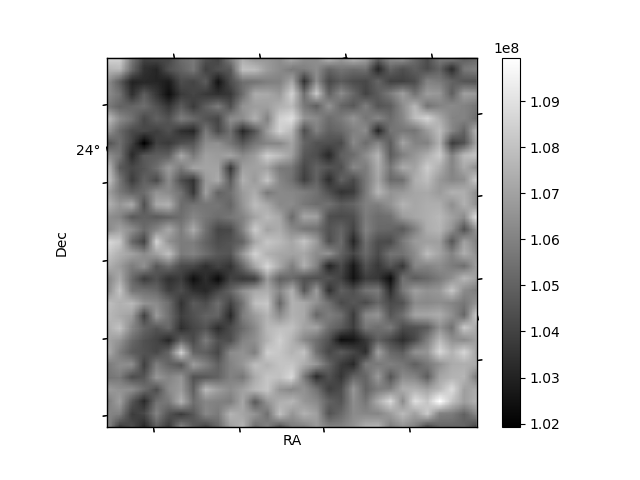
Histogram calculated using DETX and DETY for each event in the final _common_clean file
| Quadrant A | 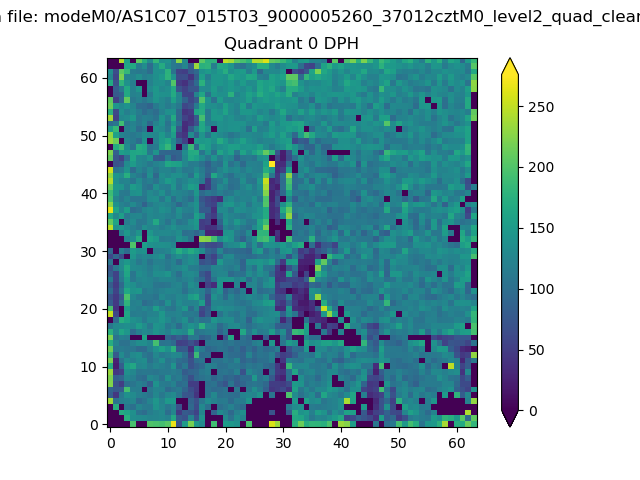 |
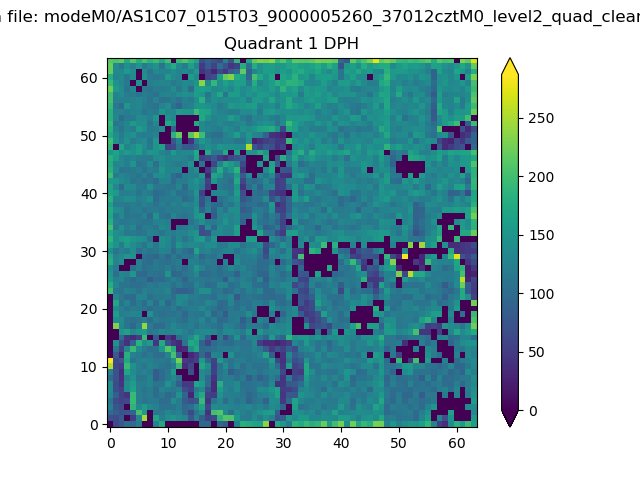 |
Quadrant B |
|---|---|---|---|
| Quadrant D | 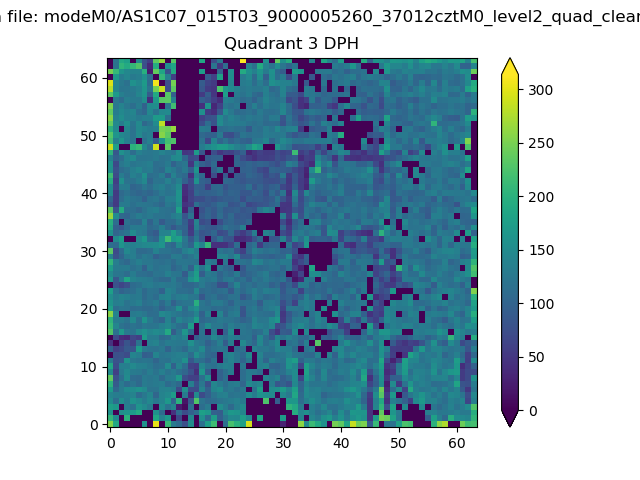 |
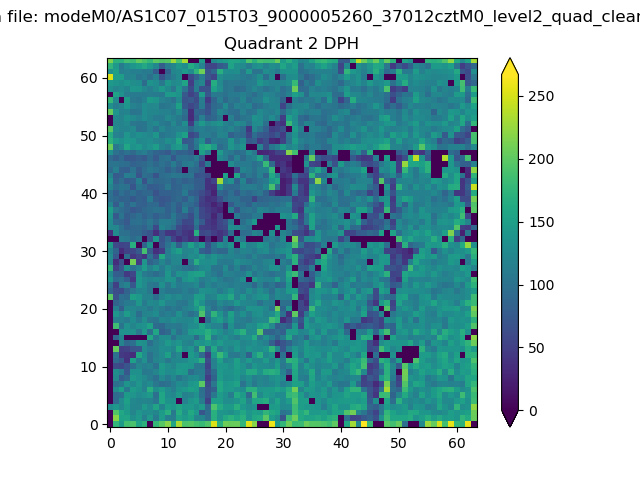 |
Quadrant C |
| Plot type | Count rate plots | Images |
|---|---|---|
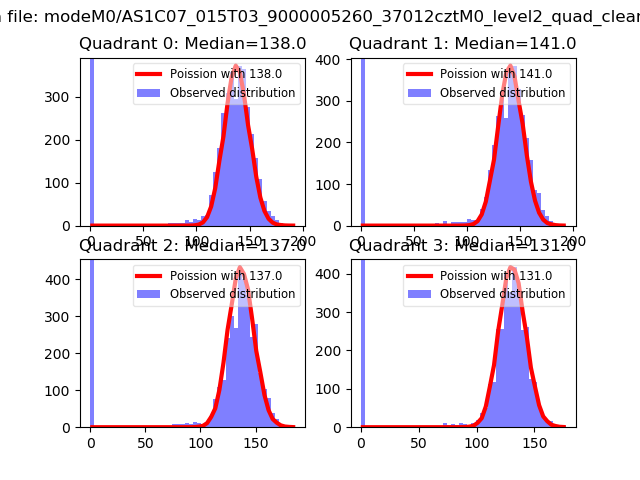
| Comparison with Poisson distribution Blue bars denote a histogram of data divided into 1 sec bins. Red curve is a Poisson curve with rate = median count rate of data. |
 |
 |
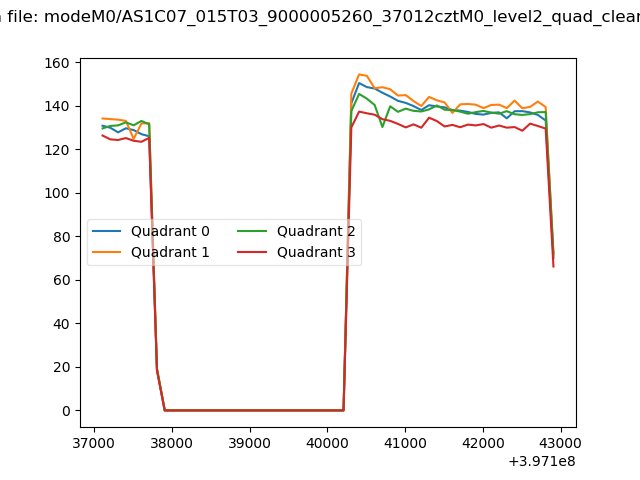
| Quadrant-wise count rates Data is divided into 100 sec bins |
 |
|
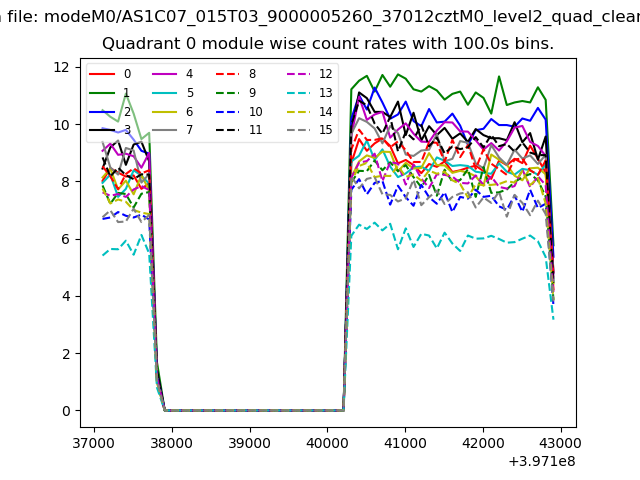
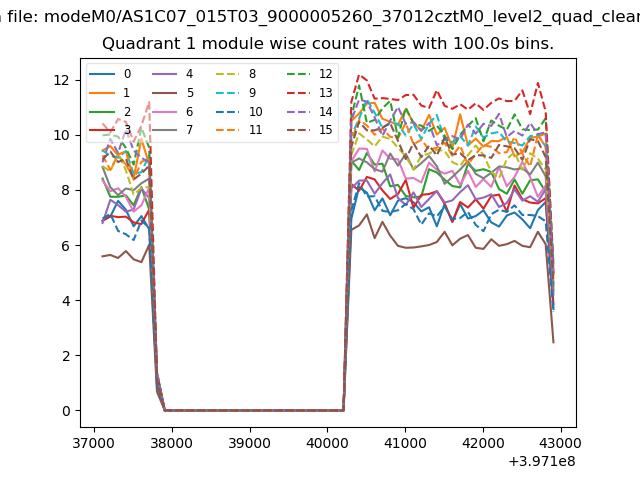
| Module-wise count rates for Quadrant A Data is divided into 100 sec bins |
 |
 |
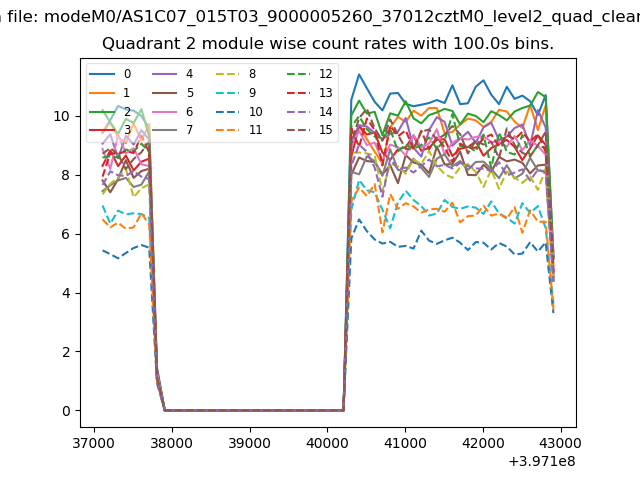
| Module-wise count rates for Quadrant B Data is divided into 100 sec bins |
 |
 |
| Module-wise count rates for Quadrant C Data is divided into 100 sec bins |
 |
 |
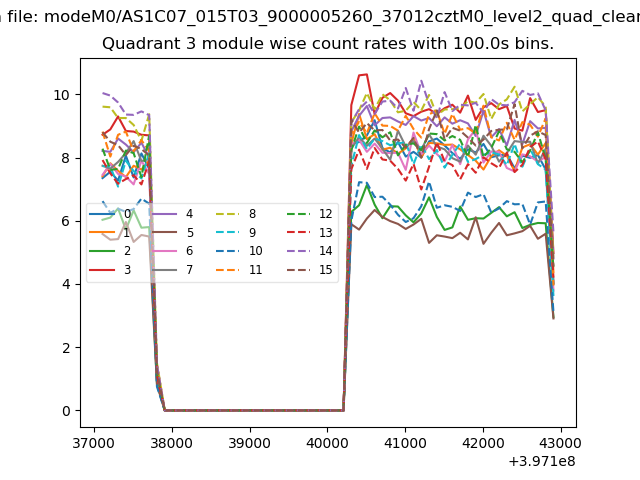
| Module-wise count rates for Quadrant D Data is divided into 100 sec bins |
 |
 |
| Parameter | Plot |
|---|---|
| CZT HV Monitor |  |
| D_VDD | 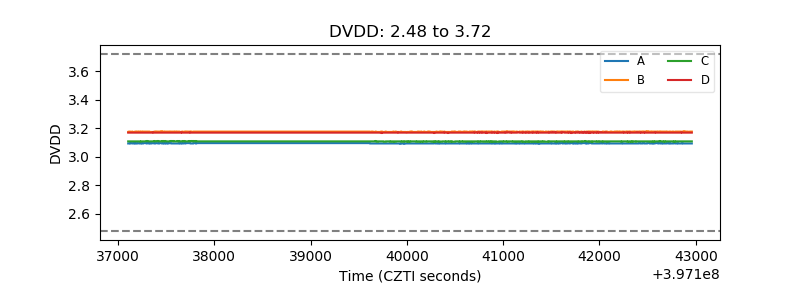 |
| Temperature 1 | 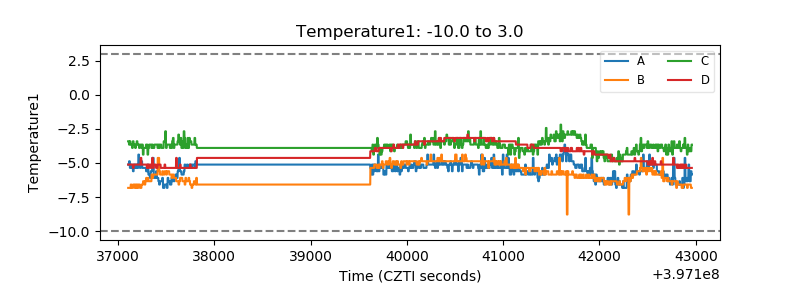 |
| Veto HV Monitor | 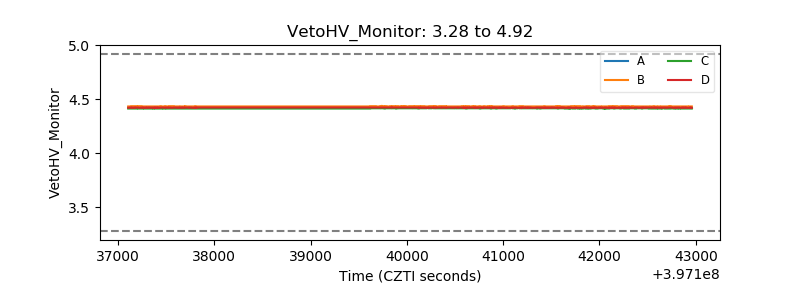 |
| Veto LLD | 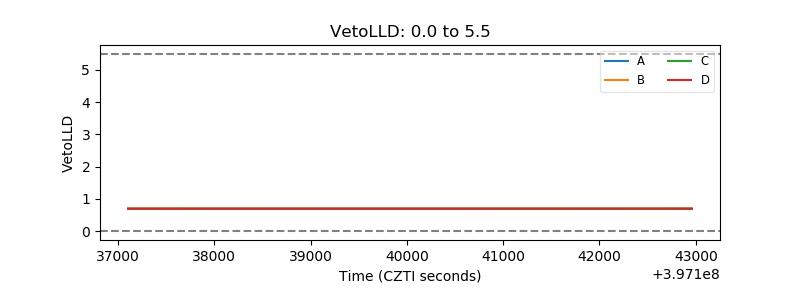 |
| Alpha Counter | 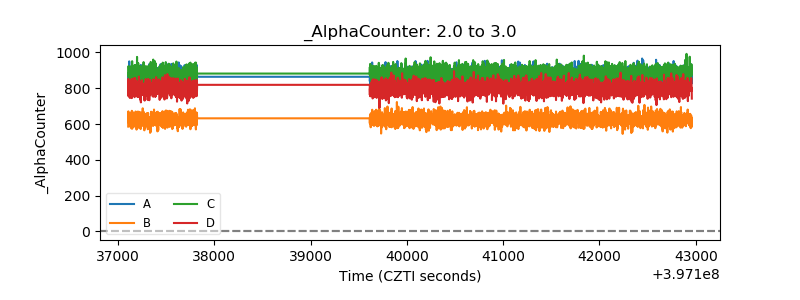 |
| _CPM_Rate | 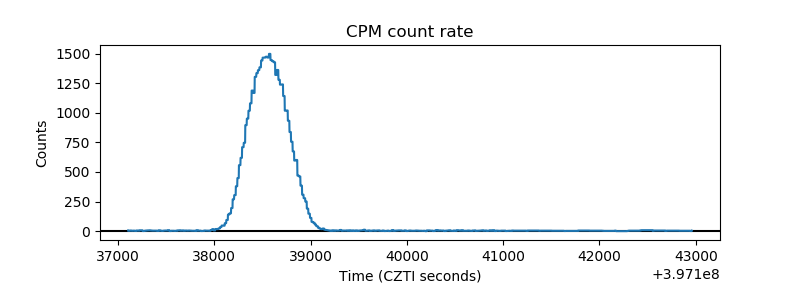 |
| CZT Counter | 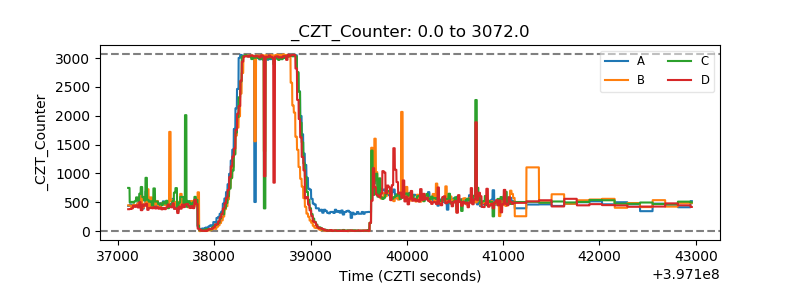 |
| +2.5 Volts monitor | 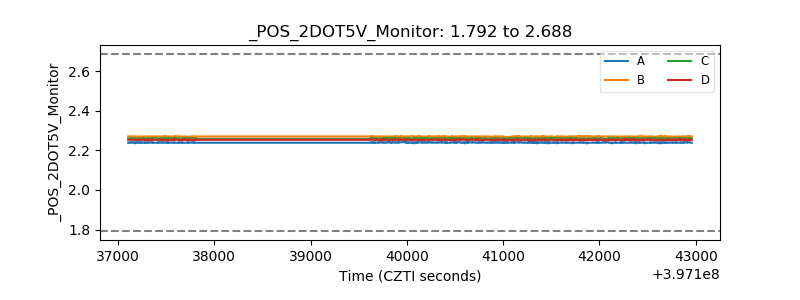 |
| +5 Volts monitor | 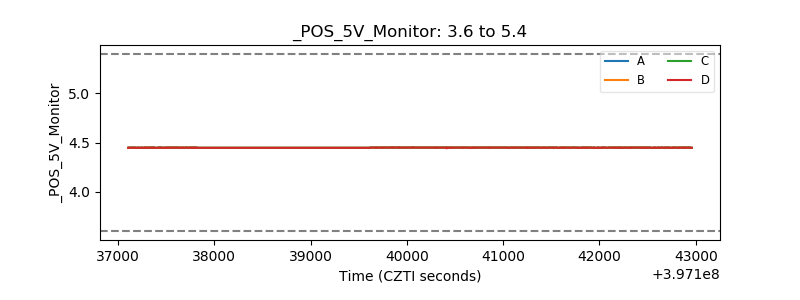 |
| _ROLL_ROT | 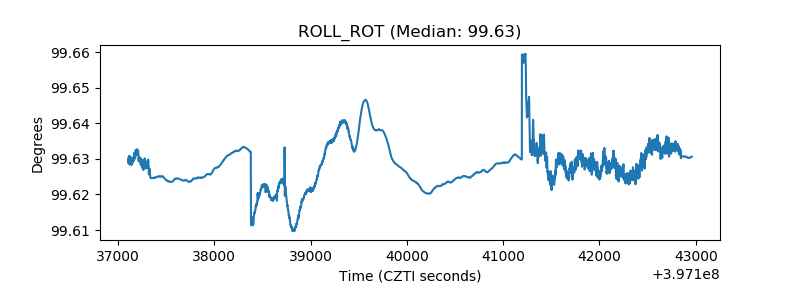 |
| _Roll_DEC | 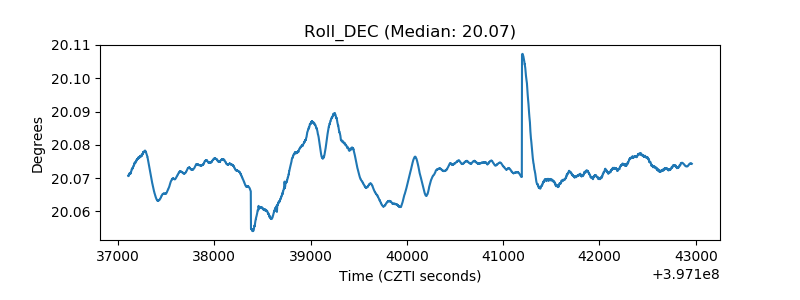 |
| _Roll_RA | 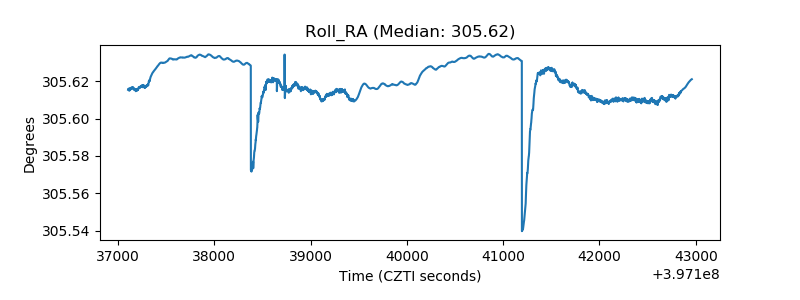 |
| Veto Counter | 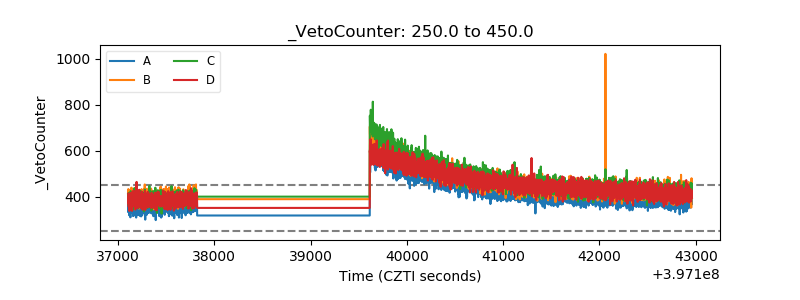 |