| Param | Original file | Final file |
|---|---|---|
| Filename | modeM0/AS1C07_015T04_9000005262cztM0_level2.fits | modeM0/AS1C07_015T04_9000005262cztM0_level2_quad_clean.evt |
| Size (bytes) | 186,007,680 | 158,132,160 |
| Size | 177.4 MB | 150.8 MB |
| Events in quadrant A | 1,180,186 | 942,324 |
| Events in quadrant B | 1,106,270 | 939,714 |
| Events in quadrant C | 1,145,202 | 889,076 |
| Events in quadrant D | 990,824 | 805,693 |
| Mode SS | |||
|---|---|---|---|
| Quadrant | BADHDUFLAG | Total packets | Discarded packets |
| A | 0 | 360 | 0 |
| B | 0 | 360 | 0 |
| C | 0 | 360 | 0 |
| D | 0 | 360 | 0 |
| Mode M9 | |||
|---|---|---|---|
| Quadrant | BADHDUFLAG | Total packets | Discarded packets |
| A | 0 | 102 | 0 |
| B | 0 | 102 | 0 |
| C | 0 | 102 | 0 |
| D | 0 | 102 | 0 |
| Mode M0 | |||
|---|---|---|---|
| Quadrant | BADHDUFLAG | Total packets | Discarded packets |
| A | 0 | 39615 | 0 |
| B | 0 | 45700 | 0 |
| C | 0 | 45150 | 0 |
| D | 0 | 54593 | 0 |
| Quadrant | Total seconds | Saturated seconds | Saturation percentage |
|---|---|---|---|
| A | 17558 | 49 | 0.279075% |
| B | 17565 | 590 | 3.358952% |
| C | 17564 | 390 | 2.220451% |
| D | 17559 | 871 | 4.960419% |
Noise dominated data is calculated using 1-second bins in cleaned event files. If a bin has >2000 counts, and if more than 50% of those come from <1% of pixels, then it is considered to be noise-dominated and hence unusable.
| Quadrant | # 1 sec bins | Bins with >0 counts | Bins with >2000 counts | High rate bins dominated by noise | Noise dominated (total time) | Noise dominated (detector-on time) | Marked lightcurve |
|---|---|---|---|---|---|---|---|
| A | 25937 | 17563 | 0 | 0 | 0.00% | 0.00% |  |
| B | 25937 | 17564 | 0 | 0 | 0.00% | 0.00% |  |
| C | 25937 | 17561 | 0 | 0 | 0.00% | 0.00% |  |
| D | 25937 | 17556 | 0 | 0 | 0.00% | 0.00% |  |
Top three noisy pixels from each quadrant. If the there are fewer than three noisy pixels in the level2.evt file, extra rows are filled as -1
| Pixel properties | Quadrant properties | ||||||
|---|---|---|---|---|---|---|---|
| Quadrant | DetID | PixID | Counts | Sigma | Mean | Median | Sigma |
| A | 7 | 110 | 928 | 8.3 | 309 | 294 | 76.4 |
| A | 9 | 19 | 914 | 8.12 | 309 | 294 | 76.4 |
| A | 0 | 29 | 914 | 8.12 | 309 | 294 | 76.4 |
| B | 2 | 9 | 927 | 10.72 | 294 | 282 | 60.2 |
| B | 3 | 80 | 876 | 9.87 | 294 | 282 | 60.2 |
| B | 3 | 17 | 791 | 8.46 | 294 | 282 | 60.2 |
| C | 3 | 203 | 930 | 8.37 | 303 | 289 | 76.6 |
| C | 3 | 202 | 881 | 7.73 | 303 | 289 | 76.6 |
| C | 1 | 81 | 846 | 7.27 | 303 | 289 | 76.6 |
| D | 10 | 189 | 754 | 6.51 | 283 | 261 | 75.7 |
| D | 10 | 113 | 745 | 6.4 | 283 | 261 | 75.7 |
| D | 7 | 3 | 720 | 6.06 | 283 | 261 | 75.7 |
Histogram calculated using DETX and DETY for each event in the final _common_clean file
| Quadrant A | 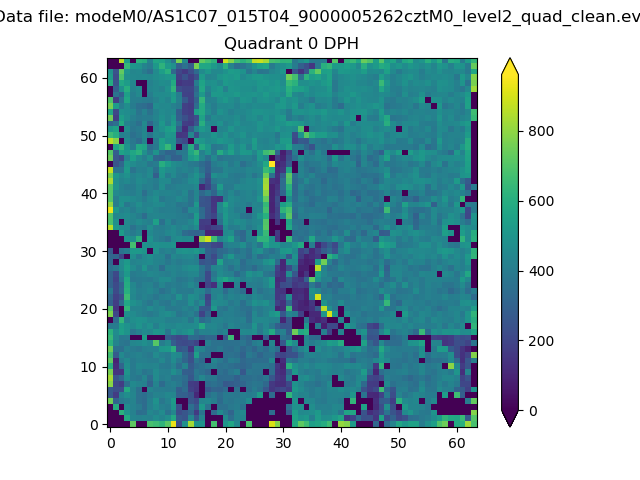 |
 |
Quadrant B |
|---|---|---|---|
| Quadrant D | 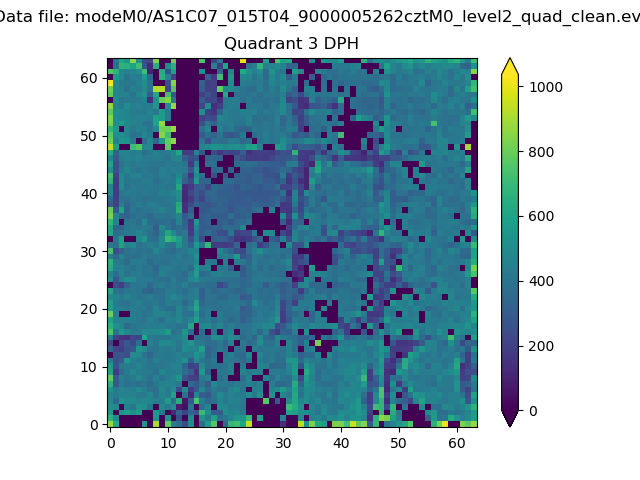 |
 |
Quadrant C |
| Plot type | Count rate plots | Images |
|---|---|---|
| Comparison with Poisson distribution Blue bars denote a histogram of data divided into 1 sec bins. Red curve is a Poisson curve with rate = median count rate of data. |
 |
 |
| Quadrant-wise count rates Data is divided into 100 sec bins |
 |
|
| Module-wise count rates for Quadrant A Data is divided into 100 sec bins |
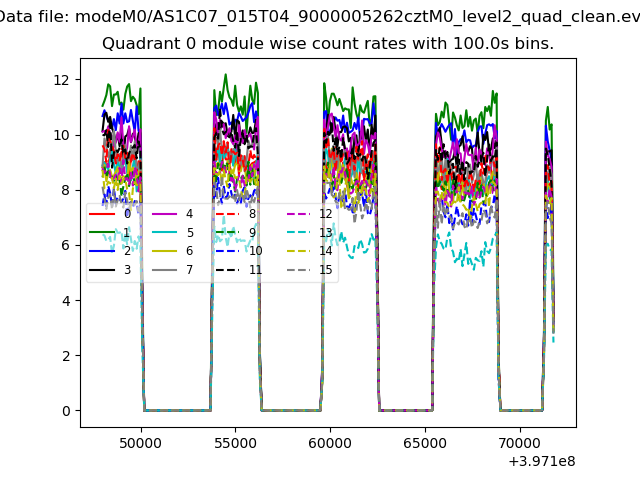 |
 |
| Module-wise count rates for Quadrant B Data is divided into 100 sec bins |
 |
 |
| Module-wise count rates for Quadrant C Data is divided into 100 sec bins |
 |
 |
| Module-wise count rates for Quadrant D Data is divided into 100 sec bins |
 |
 |
| Parameter | Plot |
|---|---|
| CZT HV Monitor |  |
| D_VDD | 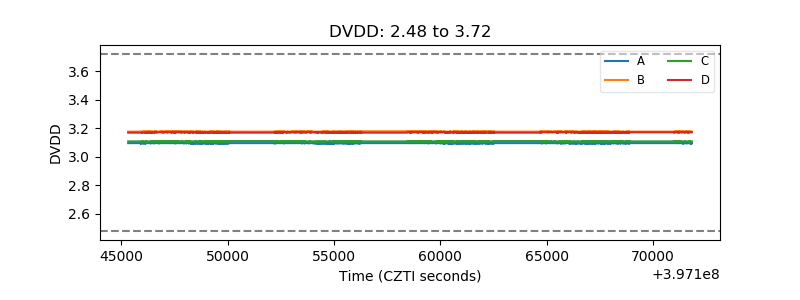 |
| Temperature 1 |  |
| Veto HV Monitor |  |
| Veto LLD | 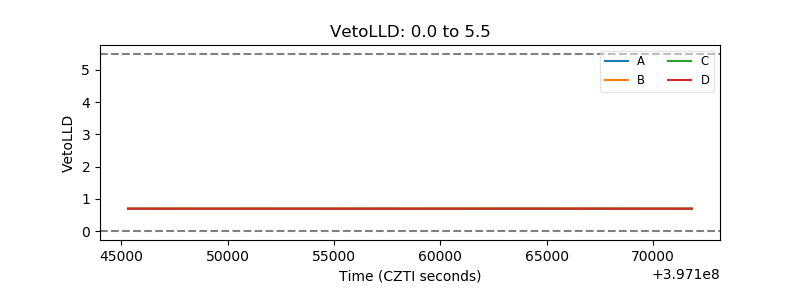 |
| Alpha Counter |  |
| _CPM_Rate |  |
| CZT Counter |  |
| +2.5 Volts monitor | 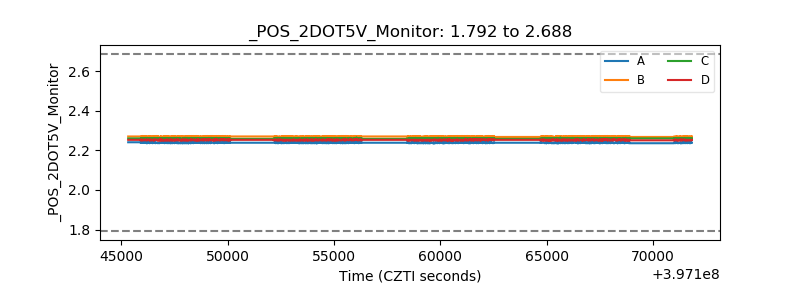 |
| +5 Volts monitor |  |
| _ROLL_ROT |  |
| _Roll_DEC |  |
| _Roll_RA |  |
| Veto Counter |  |