| Param | Original file | Final file |
|---|---|---|
| Filename | modeM0/AS1C07_015T04_9000005262_37013cztM0_level2.evt | modeM0/AS1C07_015T04_9000005262_37013cztM0_level2_quad_clean.evt |
| Size (bytes) | 497,577,600 | 51,480,000 |
| Size | 474.5 MB | 49.1 MB |
| Events in quadrant A | 3,043,700 | 306,075 |
| Events in quadrant B | 3,839,422 | 307,832 |
| Events in quadrant C | 3,600,417 | 300,646 |
| Events in quadrant D | 4,236,002 | 281,951 |
| Mode SS | |||
|---|---|---|---|
| Quadrant | BADHDUFLAG | Total packets | Discarded packets |
| A | 0 | 106 | 0 |
| B | 0 | 106 | 0 |
| C | 0 | 106 | 0 |
| D | 0 | 106 | 0 |
| Mode M9 | |||
|---|---|---|---|
| Quadrant | BADHDUFLAG | Total packets | Discarded packets |
| A | 0 | 25 | 0 |
| B | 0 | 25 | 0 |
| C | 0 | 25 | 0 |
| D | 0 | 26 | 0 |
| Mode M0 | |||
|---|---|---|---|
| Quadrant | BADHDUFLAG | Total packets | Discarded packets |
| A | 0 | 12414 | 3 |
| B | 0 | 14806 | 2 |
| C | 0 | 14078 | 2 |
| D | 0 | 16235 | 2 |
| Quadrant | Total seconds | Saturated seconds | Saturation percentage |
|---|---|---|---|
| A | 5162 | 19 | 0.368074% |
| B | 5162 | 278 | 5.385509% |
| C | 5162 | 132 | 2.557148% |
| D | 5162 | 231 | 4.475010% |
Noise dominated data is calculated using 1-second bins in cleaned event files. If a bin has >2000 counts, and if more than 50% of those come from <1% of pixels, then it is considered to be noise-dominated and hence unusable.
| Quadrant | # 1 sec bins | Bins with >0 counts | Bins with >2000 counts | High rate bins dominated by noise | Noise dominated (total time) | Noise dominated (detector-on time) | Marked lightcurve |
|---|---|---|---|---|---|---|---|
| A | 7194 | 5163 | 6 | 6 | 0.08% | 0.12% | 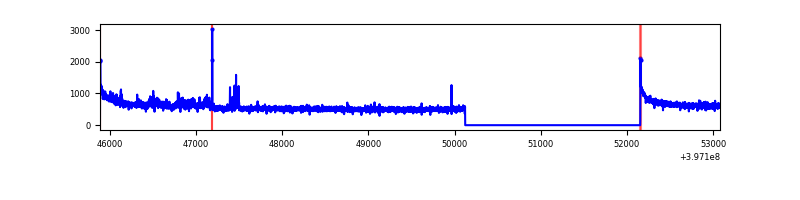 |
| B | 7194 | 5163 | 177 | 177 | 2.46% | 3.43% | 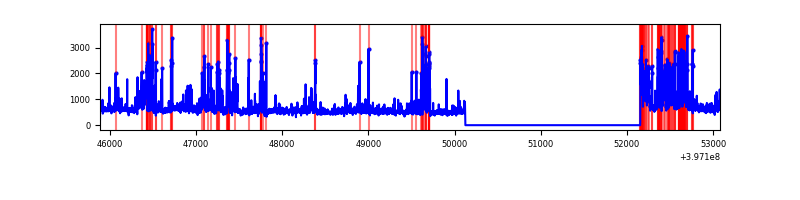 |
| C | 7194 | 5163 | 115 | 115 | 1.60% | 2.23% | 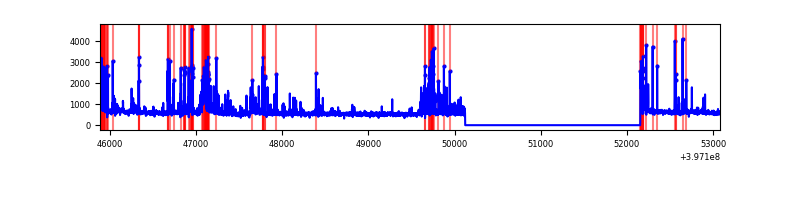 |
| D | 7194 | 5163 | 185 | 185 | 2.57% | 3.58% | 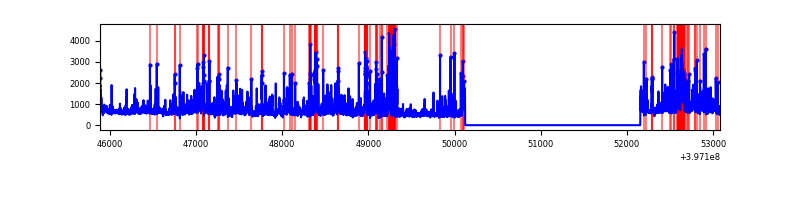 |
Top three noisy pixels from each quadrant. If the there are fewer than three noisy pixels in the level2.evt file, extra rows are filled as -1
| Pixel properties | Quadrant properties | ||||||
|---|---|---|---|---|---|---|---|
| Quadrant | DetID | PixID | Counts | Sigma | Mean | Median | Sigma |
| A | 10 | 83 | 240361 | 1741.63 | 691 | 679 | 137.6 |
| A | 14 | 1 | 111745 | 807.05 | 691 | 679 | 137.6 |
| A | 13 | 6 | 19639 | 137.77 | 691 | 679 | 137.6 |
| B | 5 | 184 | 772945 | 6136.45 | 671 | 656 | 125.9 |
| B | 0 | 213 | 149523 | 1182.87 | 671 | 656 | 125.9 |
| B | 5 | 172 | 114137 | 901.7 | 671 | 656 | 125.9 |
| C | 1 | 23 | 468280 | 3072.02 | 663 | 671 | 152.2 |
| C | 15 | 214 | 219637 | 1438.53 | 663 | 671 | 152.2 |
| C | 0 | 242 | 133344 | 871.61 | 663 | 671 | 152.2 |
| D | 1 | 52 | 601877 | 3776.68 | 663 | 647 | 159.2 |
| D | 2 | 153 | 381430 | 2391.92 | 663 | 647 | 159.2 |
| D | 12 | 235 | 257157 | 1611.29 | 663 | 647 | 159.2 |
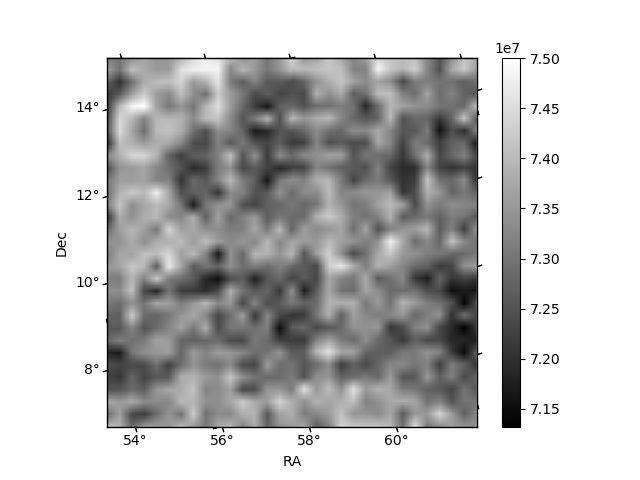
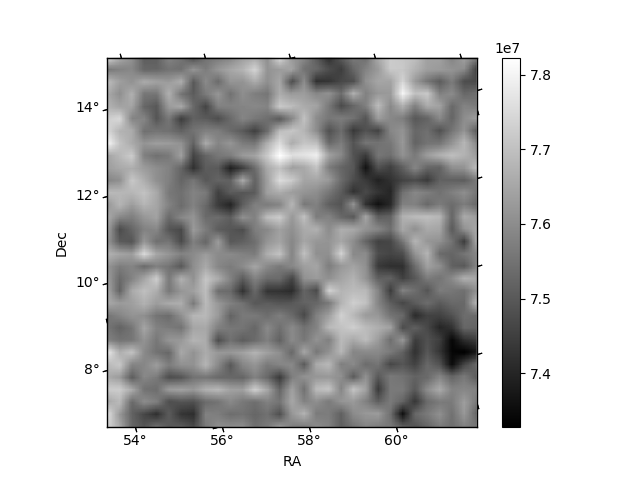
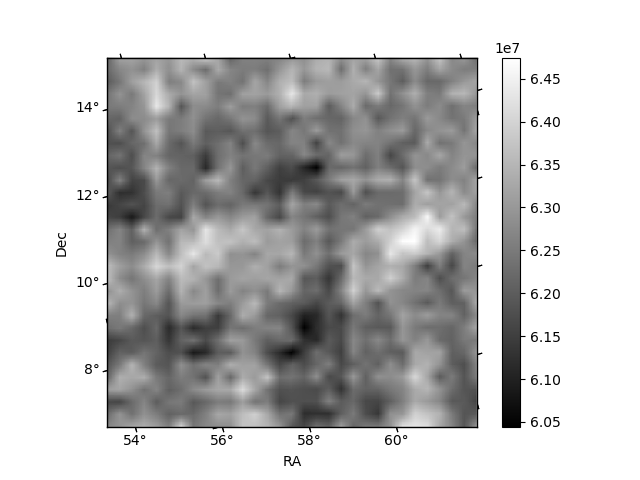
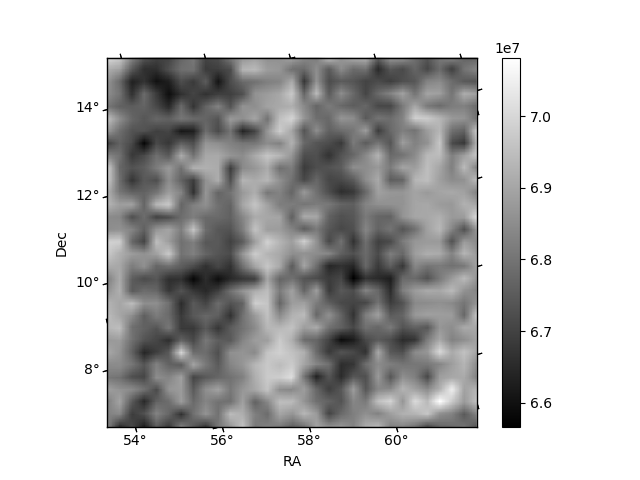
Histogram calculated using DETX and DETY for each event in the final _common_clean file
| Quadrant A | 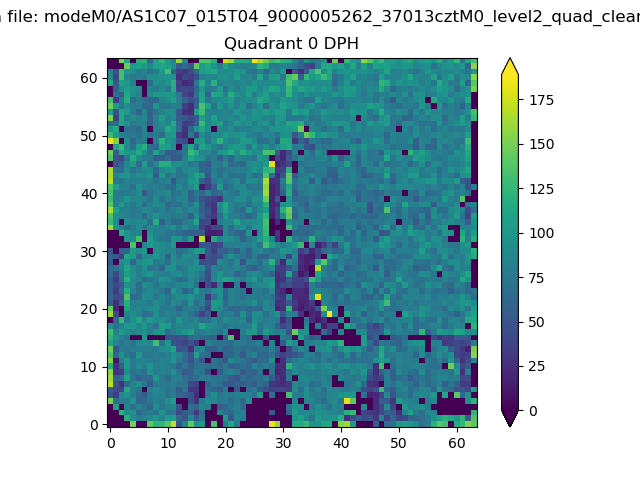 |
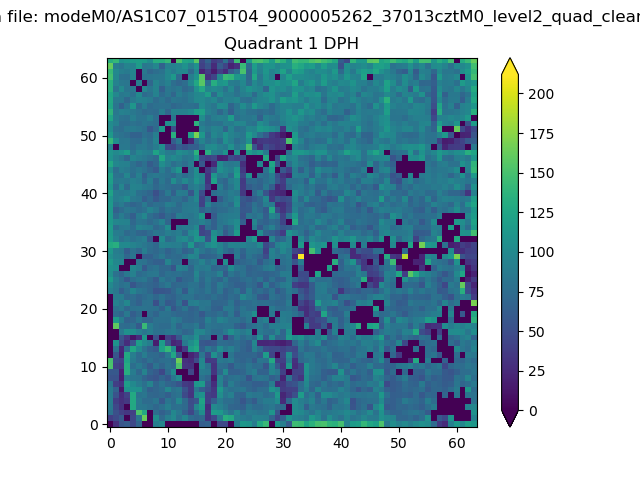 |
Quadrant B |
|---|---|---|---|
| Quadrant D | 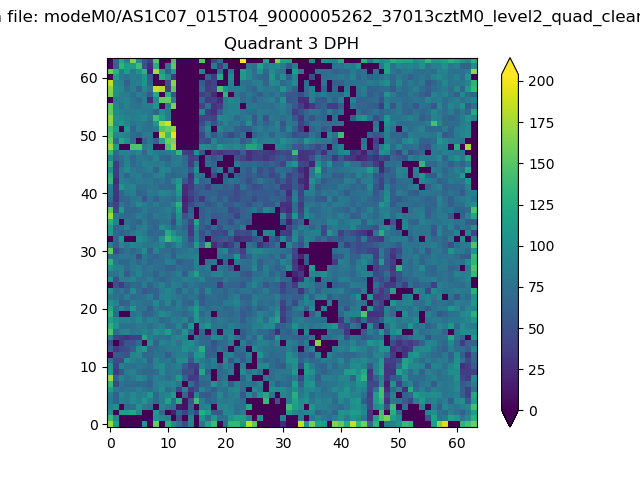 |
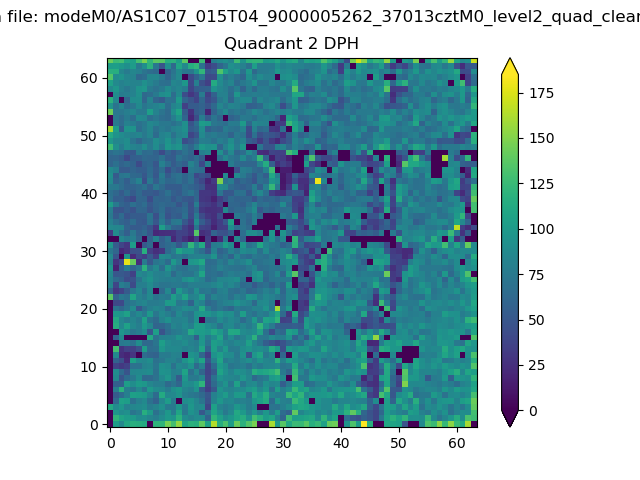 |
Quadrant C |
| Plot type | Count rate plots | Images |
|---|---|---|
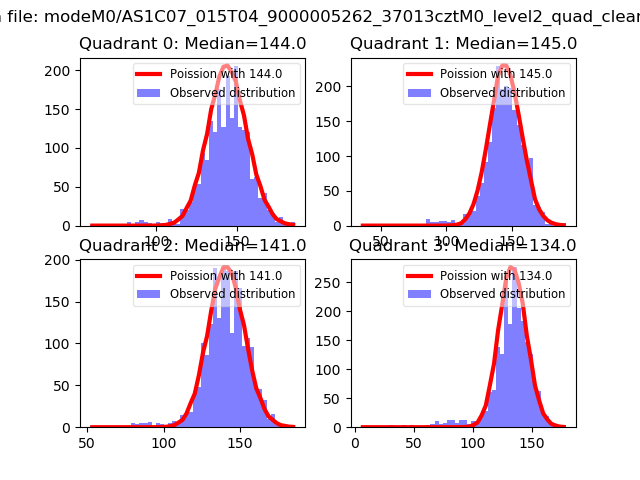
| Comparison with Poisson distribution Blue bars denote a histogram of data divided into 1 sec bins. Red curve is a Poisson curve with rate = median count rate of data. |
 |
 |
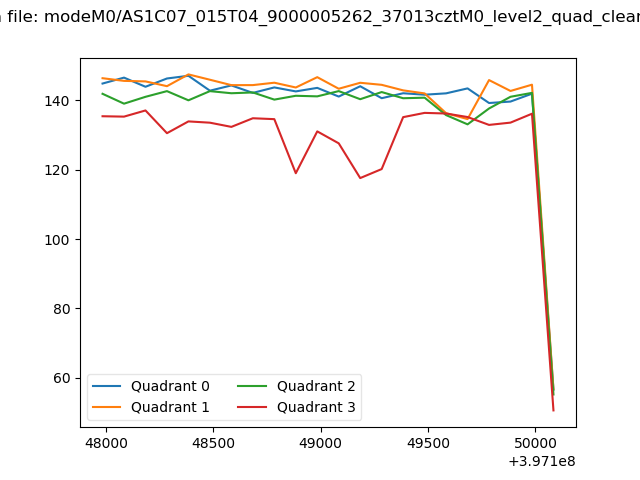
| Quadrant-wise count rates Data is divided into 100 sec bins |
 |
|
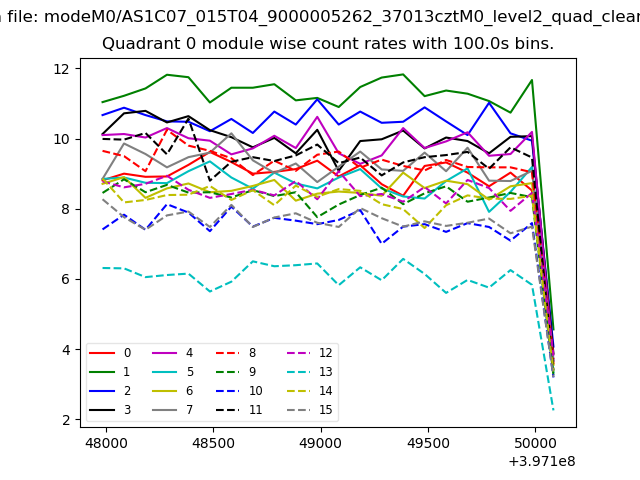
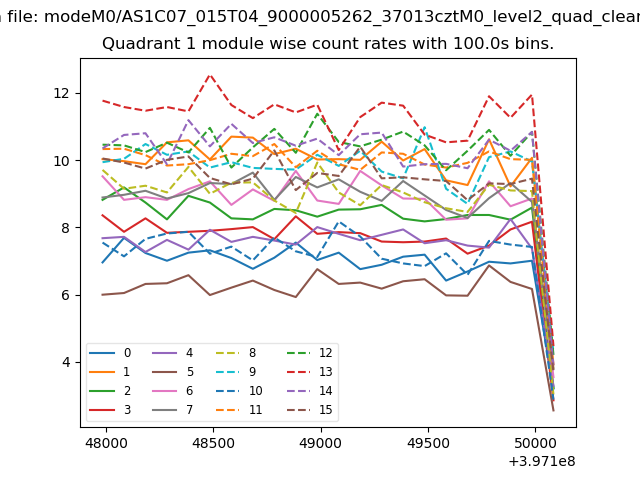
| Module-wise count rates for Quadrant A Data is divided into 100 sec bins |
 |
 |
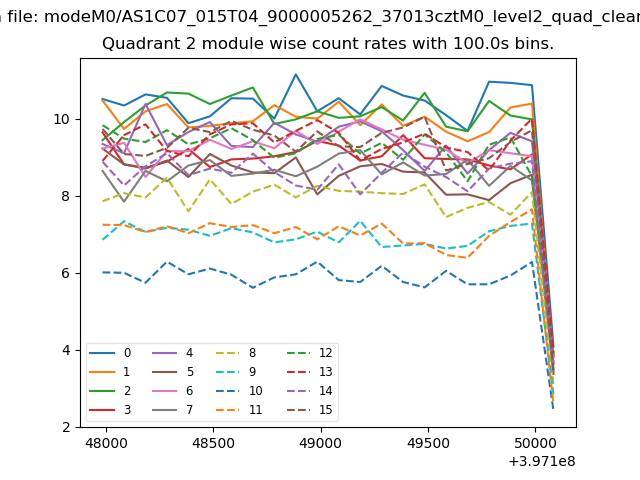
| Module-wise count rates for Quadrant B Data is divided into 100 sec bins |
 |
 |
| Module-wise count rates for Quadrant C Data is divided into 100 sec bins |
 |
 |
| Module-wise count rates for Quadrant D Data is divided into 100 sec bins |
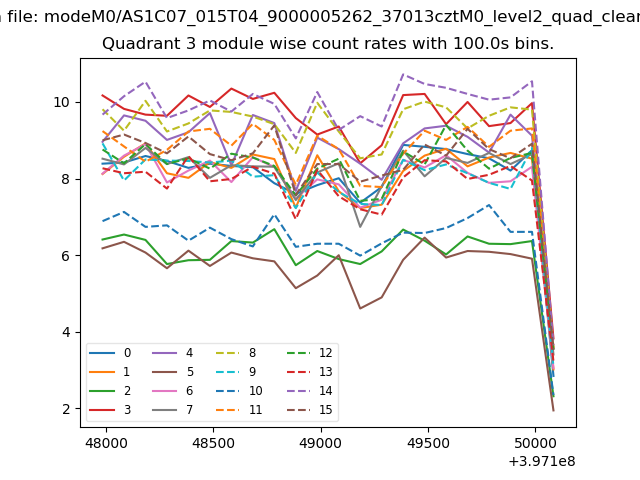 |
 |
| Parameter | Plot |
|---|---|
| CZT HV Monitor | 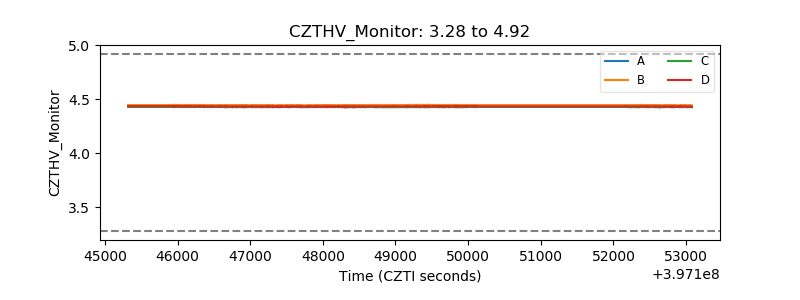 |
| D_VDD | 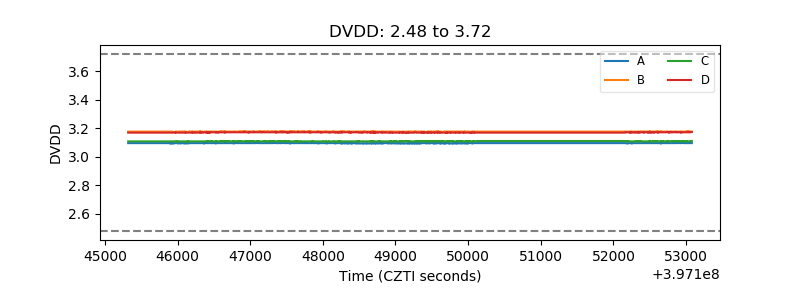 |
| Temperature 1 | 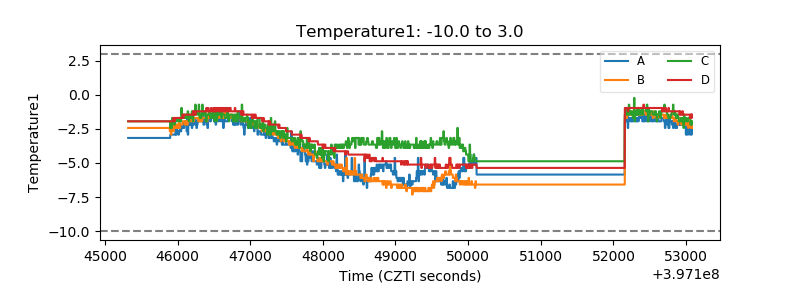 |
| Veto HV Monitor | 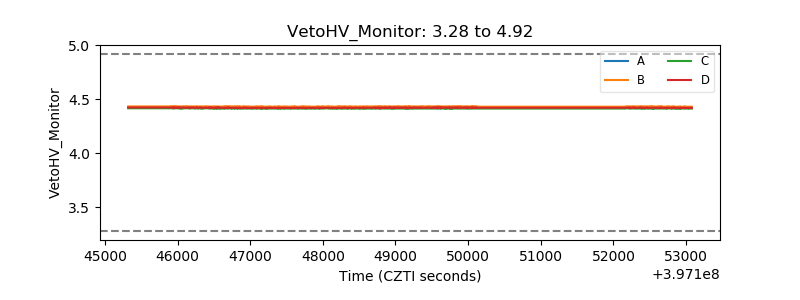 |
| Veto LLD | 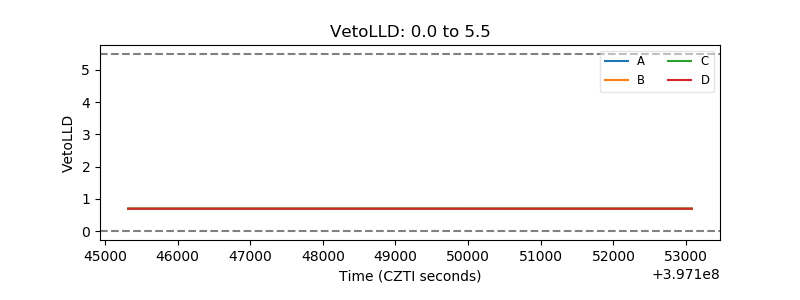 |
| Alpha Counter | 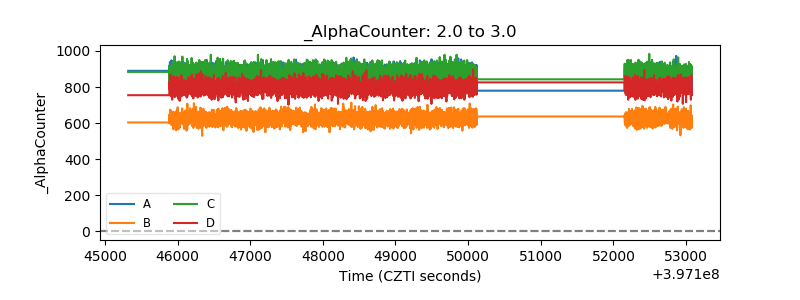 |
| _CPM_Rate | 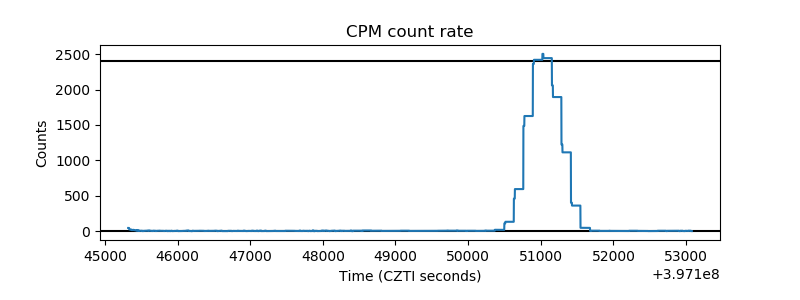 |
| CZT Counter | 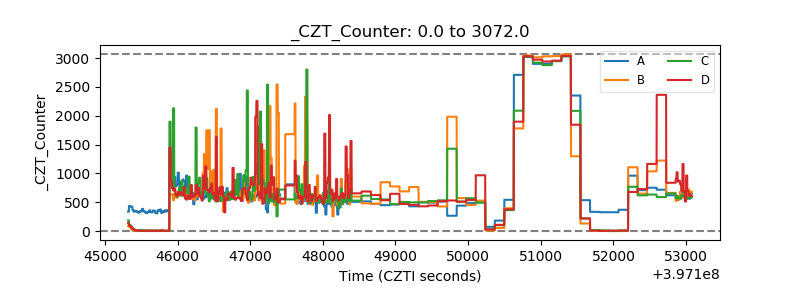 |
| +2.5 Volts monitor | 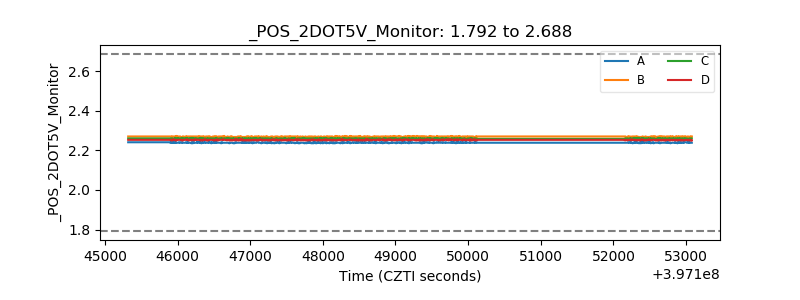 |
| +5 Volts monitor | 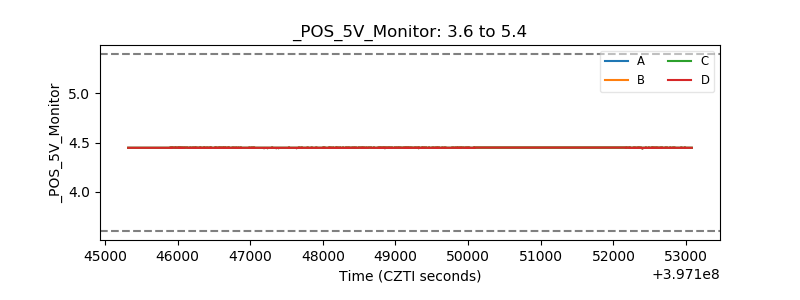 |
| _ROLL_ROT |  |
| _Roll_DEC | 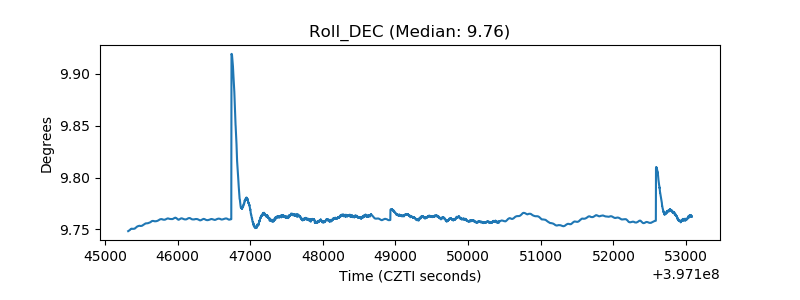 |
| _Roll_RA | 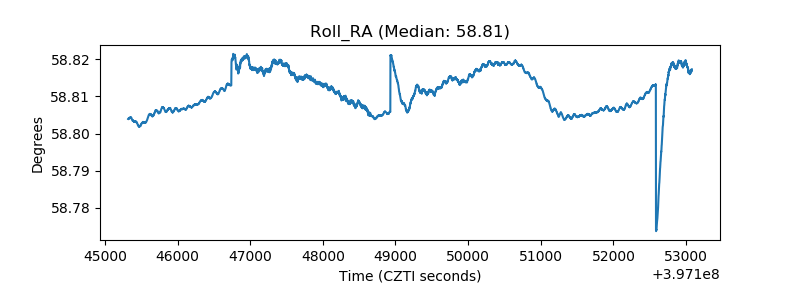 |
| Veto Counter | 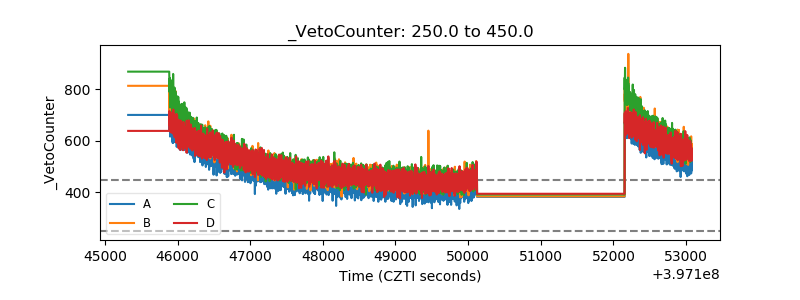 |