| Param | Original file | Final file |
|---|---|---|
| Filename | modeM0/AS1C07_015T04_9000005262_37014cztM0_level2.evt | modeM0/AS1C07_015T04_9000005262_37014cztM0_level2_quad_clean.evt |
| Size (bytes) | 491,774,400 | 58,291,200 |
| Size | 469.0 MB | 55.6 MB |
| Events in quadrant A | 2,921,068 | 360,231 |
| Events in quadrant B | 4,110,319 | 357,715 |
| Events in quadrant C | 3,077,430 | 357,828 |
| Events in quadrant D | 4,442,303 | 334,665 |
| Mode SS | |||
|---|---|---|---|
| Quadrant | BADHDUFLAG | Total packets | Discarded packets |
| A | 0 | 102 | 0 |
| B | 0 | 102 | 0 |
| C | 0 | 102 | 0 |
| D | 0 | 102 | 0 |
| Mode M9 | |||
|---|---|---|---|
| Quadrant | BADHDUFLAG | Total packets | Discarded packets |
| A | 0 | 27 | 0 |
| B | 0 | 27 | 0 |
| C | 0 | 27 | 0 |
| D | 0 | 28 | 0 |
| Mode M0 | |||
|---|---|---|---|
| Quadrant | BADHDUFLAG | Total packets | Discarded packets |
| A | 0 | 11851 | 3 |
| B | 0 | 15514 | 2 |
| C | 0 | 12183 | 2 |
| D | 0 | 16791 | 2 |
| Quadrant | Total seconds | Saturated seconds | Saturation percentage |
|---|---|---|---|
| A | 5059 | 17 | 0.336035% |
| B | 5059 | 409 | 8.084602% |
| C | 5059 | 71 | 1.403439% |
| D | 5059 | 229 | 4.526586% |
Noise dominated data is calculated using 1-second bins in cleaned event files. If a bin has >2000 counts, and if more than 50% of those come from <1% of pixels, then it is considered to be noise-dominated and hence unusable.
| Quadrant | # 1 sec bins | Bins with >0 counts | Bins with >2000 counts | High rate bins dominated by noise | Noise dominated (total time) | Noise dominated (detector-on time) | Marked lightcurve |
|---|---|---|---|---|---|---|---|
| A | 7182 | 5060 | 6 | 6 | 0.08% | 0.12% | 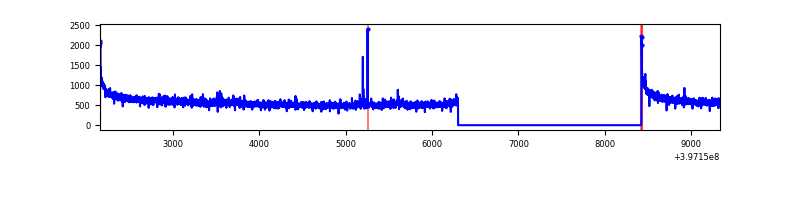 |
| B | 7182 | 5060 | 290 | 290 | 4.04% | 5.73% | 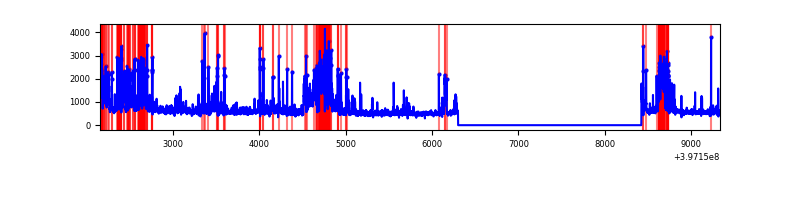 |
| C | 7182 | 5060 | 55 | 55 | 0.77% | 1.09% | 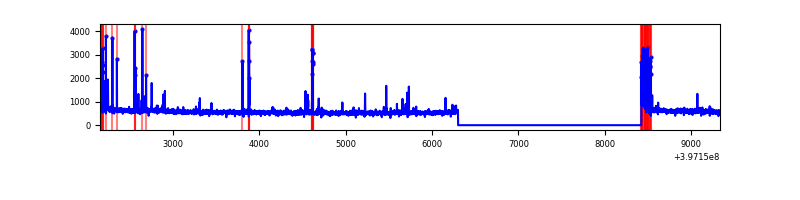 |
| D | 7182 | 5060 | 196 | 196 | 2.73% | 3.87% | 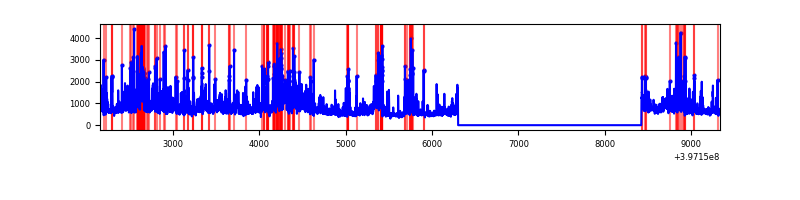 |
Top three noisy pixels from each quadrant. If the there are fewer than three noisy pixels in the level2.evt file, extra rows are filled as -1
| Pixel properties | Quadrant properties | ||||||
|---|---|---|---|---|---|---|---|
| Quadrant | DetID | PixID | Counts | Sigma | Mean | Median | Sigma |
| A | 10 | 83 | 243586 | 1822.35 | 674 | 666 | 133.3 |
| A | 14 | 1 | 25634 | 187.31 | 674 | 666 | 133.3 |
| A | 12 | 189 | 21353 | 155.19 | 674 | 666 | 133.3 |
| B | 5 | 184 | 985195 | 8106.44 | 651 | 639 | 121.5 |
| B | 0 | 213 | 225050 | 1847.71 | 651 | 639 | 121.5 |
| B | 5 | 172 | 143194 | 1173.74 | 651 | 639 | 121.5 |
| C | 15 | 214 | 213223 | 1418.62 | 655 | 663 | 149.8 |
| C | 0 | 10 | 187290 | 1245.54 | 655 | 663 | 149.8 |
| C | 1 | 23 | 41636 | 273.45 | 655 | 663 | 149.8 |
| D | 1 | 52 | 759932 | 4904.72 | 650 | 636 | 154.8 |
| D | 2 | 153 | 250527 | 1614.19 | 650 | 636 | 154.8 |
| D | 2 | 253 | 227036 | 1462.45 | 650 | 636 | 154.8 |
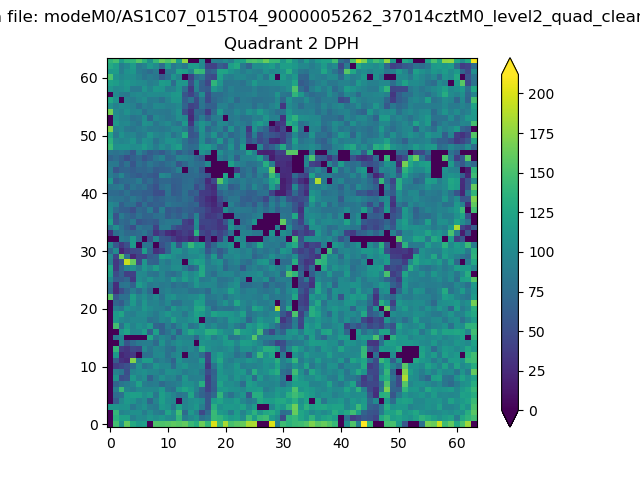
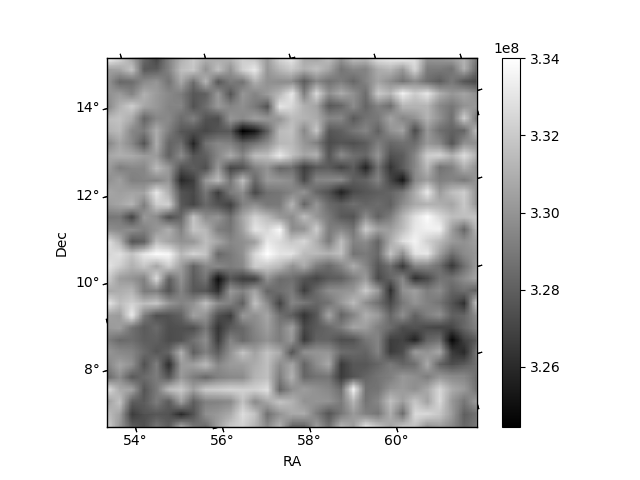
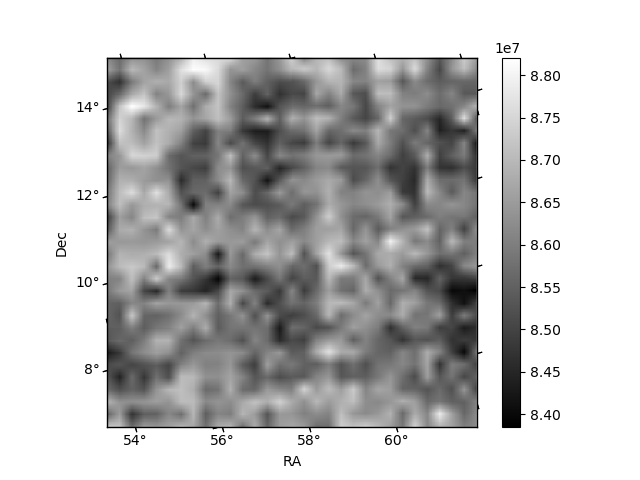
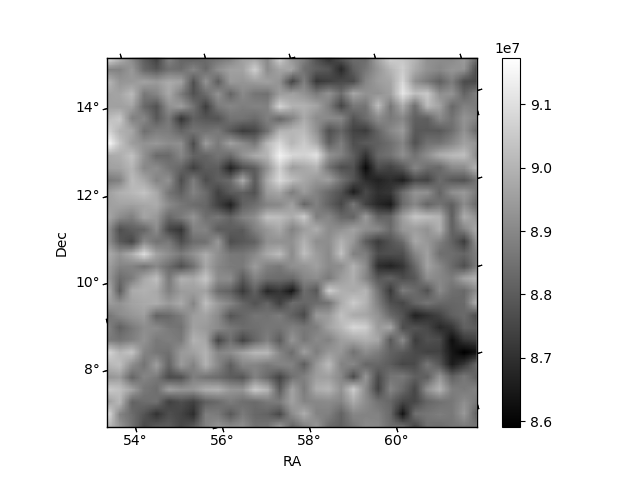
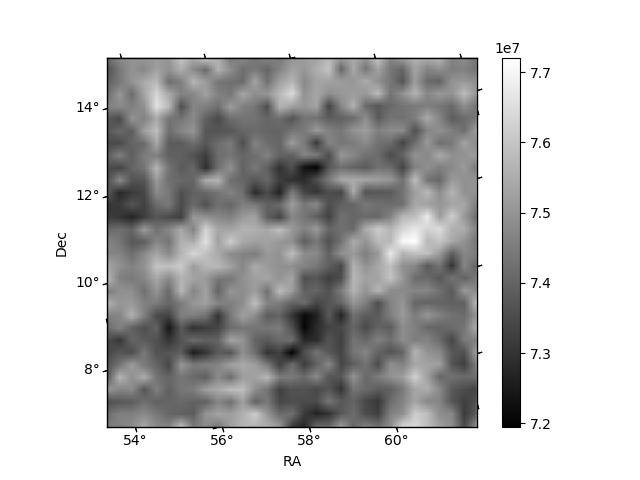
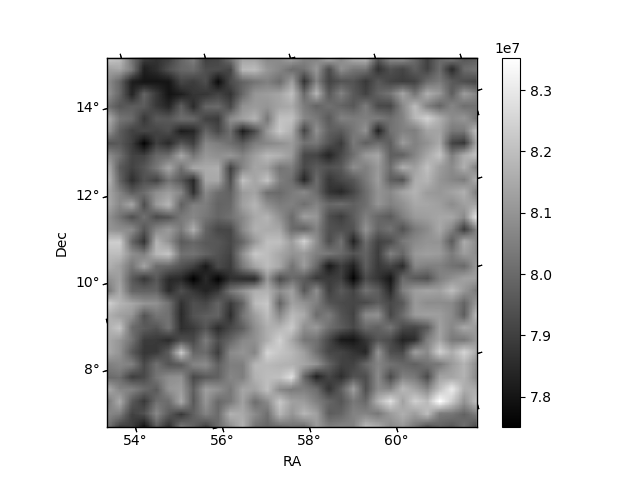
Histogram calculated using DETX and DETY for each event in the final _common_clean file
| Quadrant A | 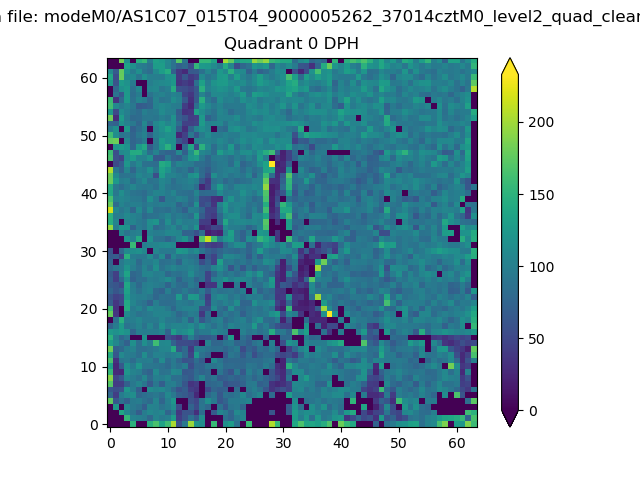 |
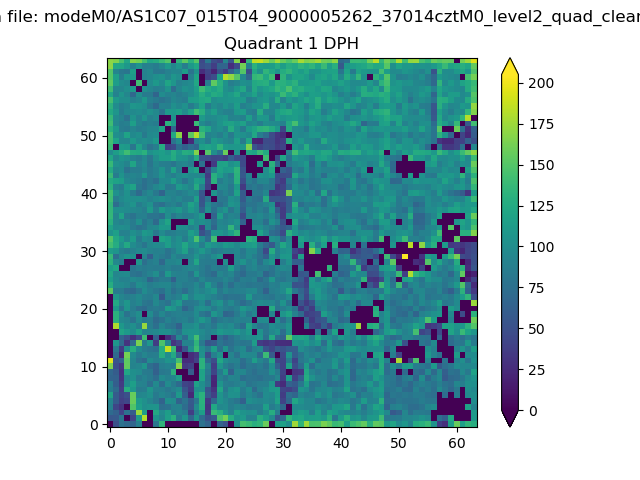 |
Quadrant B |
|---|---|---|---|
| Quadrant D | 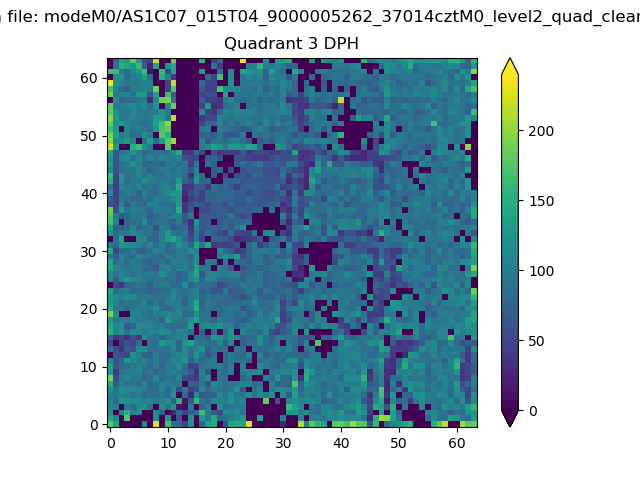 |
 |
Quadrant C |
| Plot type | Count rate plots | Images |
|---|---|---|
| Comparison with Poisson distribution Blue bars denote a histogram of data divided into 1 sec bins. Red curve is a Poisson curve with rate = median count rate of data. |
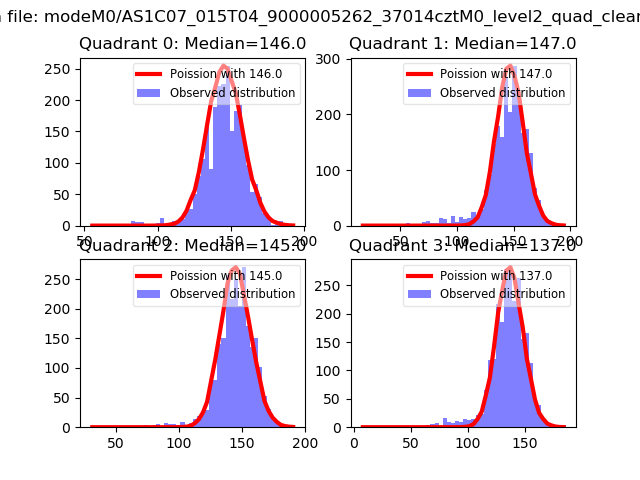 |
 |
| Quadrant-wise count rates Data is divided into 100 sec bins |
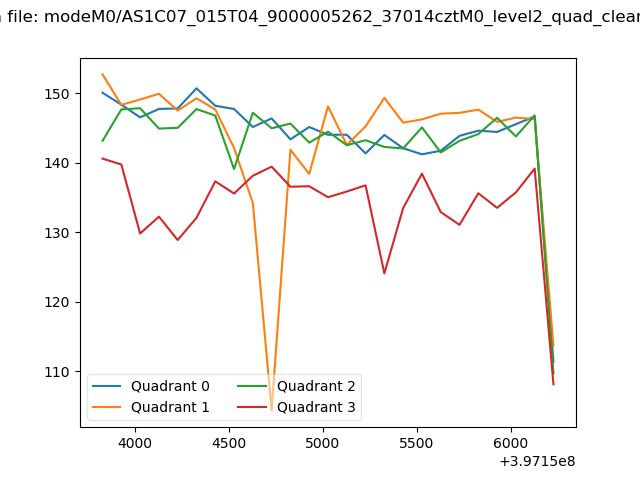 |
|
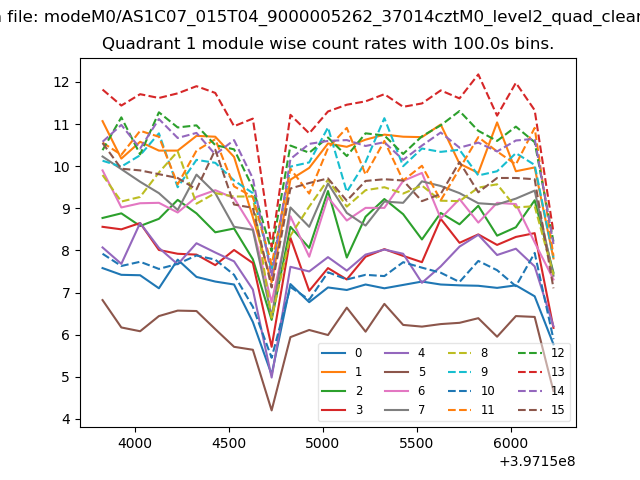
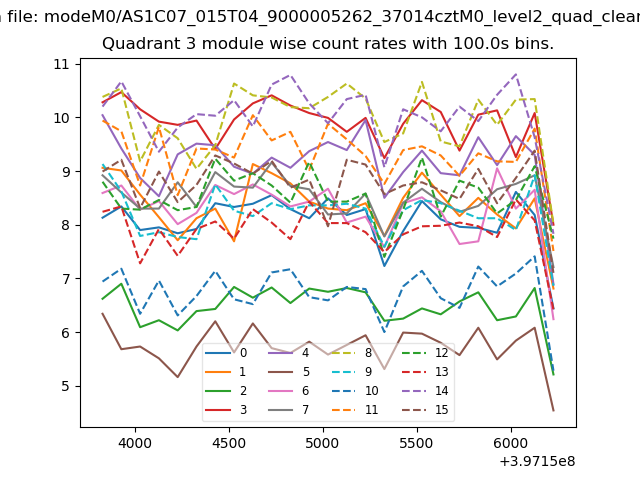
| Module-wise count rates for Quadrant A Data is divided into 100 sec bins |
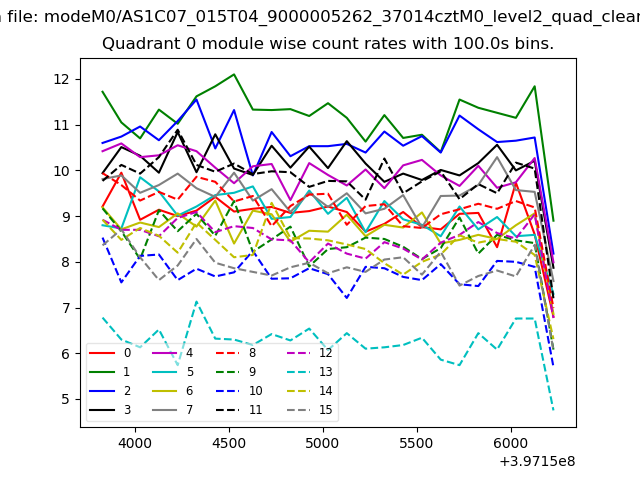 |
 |
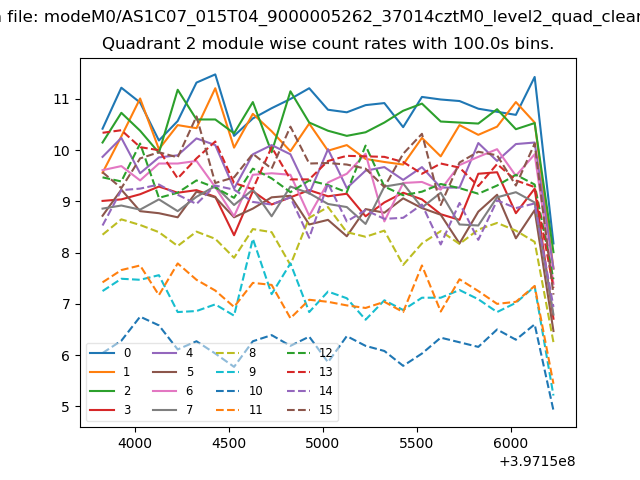
| Module-wise count rates for Quadrant B Data is divided into 100 sec bins |
 |
 |
| Module-wise count rates for Quadrant C Data is divided into 100 sec bins |
 |
 |
| Module-wise count rates for Quadrant D Data is divided into 100 sec bins |
 |
 |
| Parameter | Plot |
|---|---|
| CZT HV Monitor | 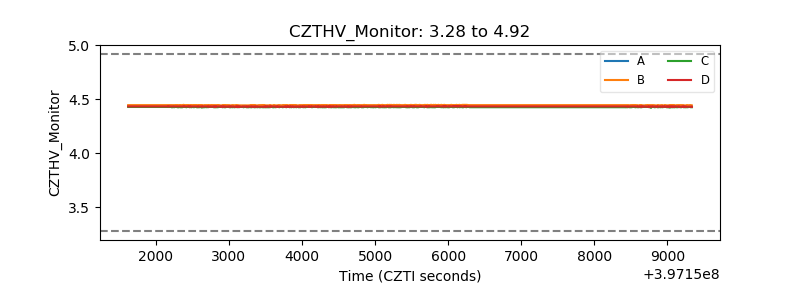 |
| D_VDD | 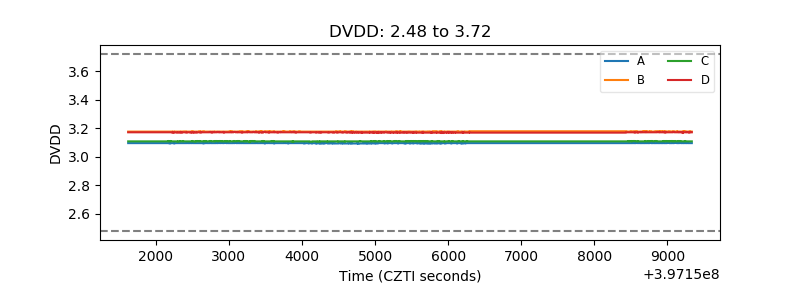 |
| Temperature 1 | 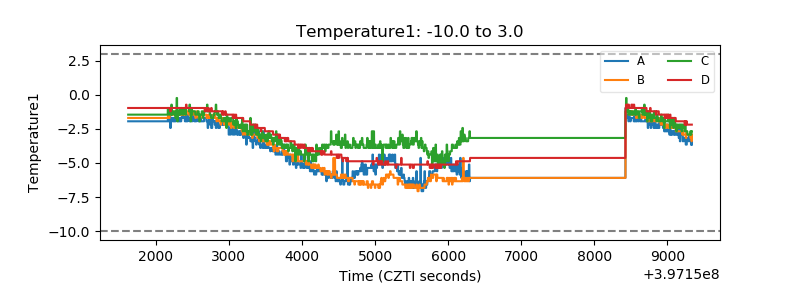 |
| Veto HV Monitor | 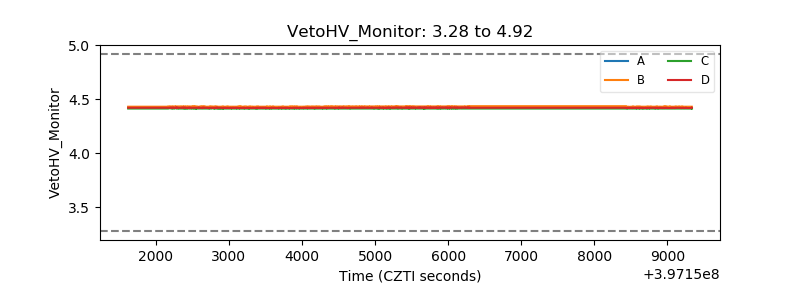 |
| Veto LLD | 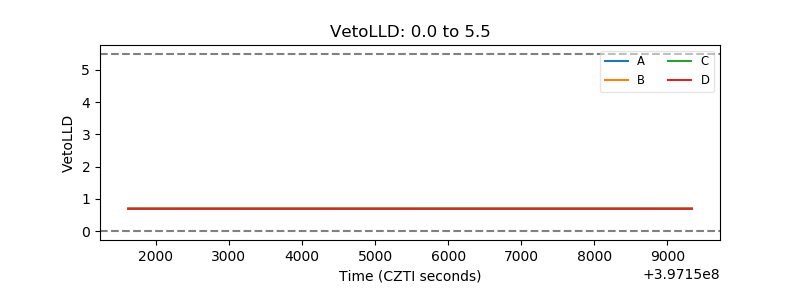 |
| Alpha Counter | 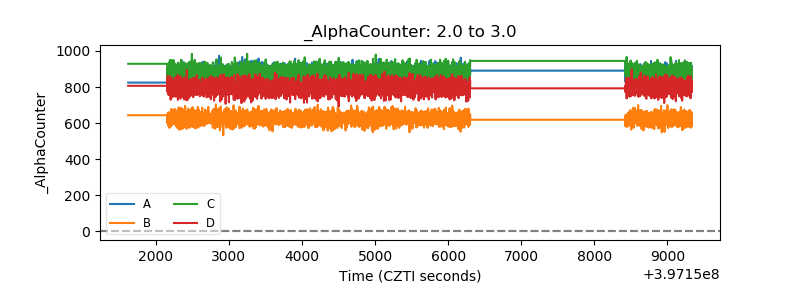 |
| _CPM_Rate | 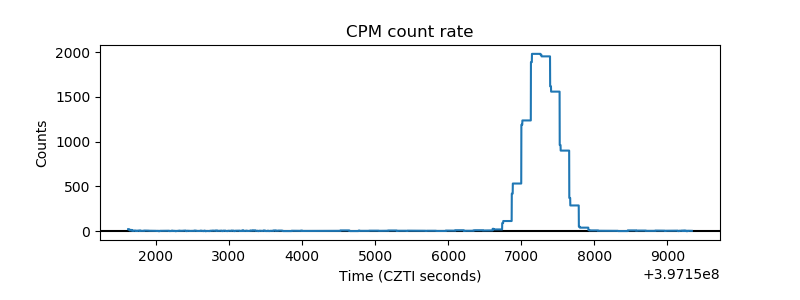 |
| CZT Counter | 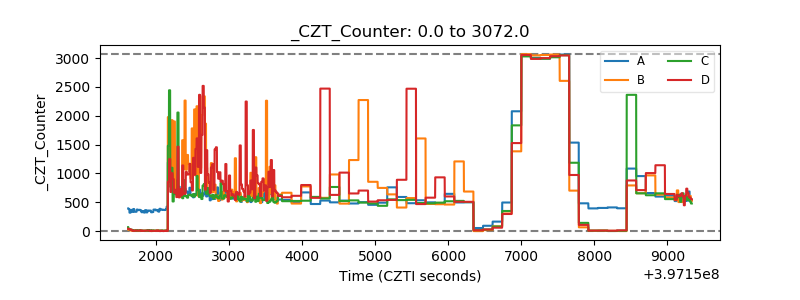 |
| +2.5 Volts monitor | 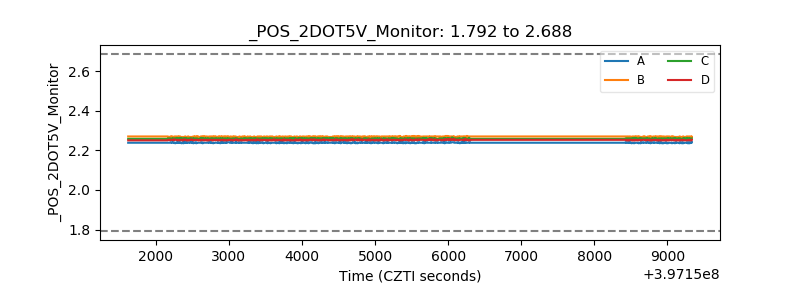 |
| +5 Volts monitor | 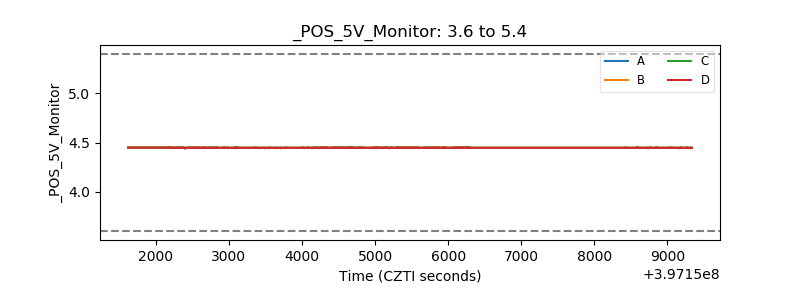 |
| _ROLL_ROT |  |
| _Roll_DEC | 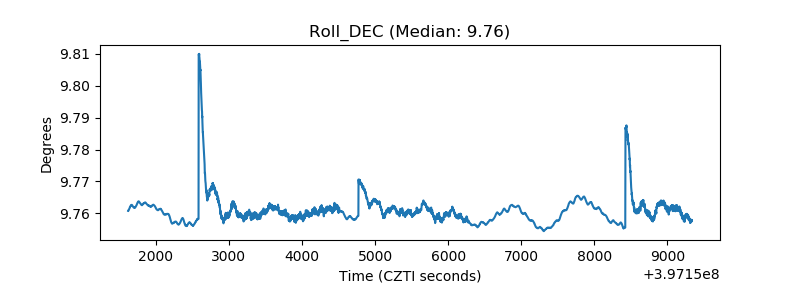 |
| _Roll_RA | 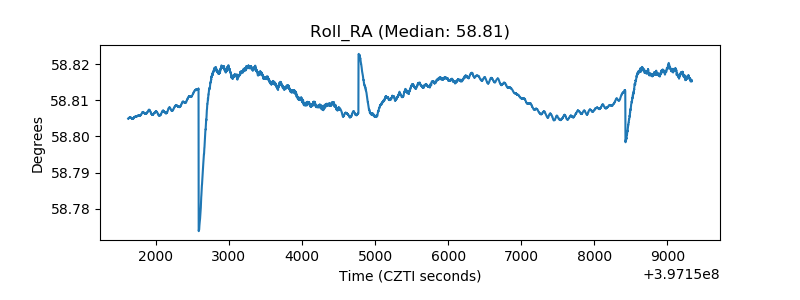 |
| Veto Counter |  |