| Param | Original file | Final file |
|---|---|---|
| Filename | modeM0/AS1C07_015T04_9000005262_37017cztM0_level2.evt | modeM0/AS1C07_015T04_9000005262_37017cztM0_level2_quad_clean.evt |
| Size (bytes) | 452,626,560 | 79,027,200 |
| Size | 431.7 MB | 75.4 MB |
| Events in quadrant A | 2,797,323 | 516,293 |
| Events in quadrant B | 2,888,365 | 526,610 |
| Events in quadrant C | 3,475,477 | 511,723 |
| Events in quadrant D | 4,202,797 | 483,191 |
| Mode SS | |||
|---|---|---|---|
| Quadrant | BADHDUFLAG | Total packets | Discarded packets |
| A | 0 | 104 | 0 |
| B | 0 | 104 | 0 |
| C | 0 | 104 | 0 |
| D | 0 | 104 | 0 |
| Mode M9 | |||
|---|---|---|---|
| Quadrant | BADHDUFLAG | Total packets | Discarded packets |
| A | 0 | 33 | 0 |
| B | 0 | 33 | 0 |
| C | 0 | 33 | 0 |
| D | 0 | 34 | 0 |
| Mode M0 | |||
|---|---|---|---|
| Quadrant | BADHDUFLAG | Total packets | Discarded packets |
| A | 0 | 11457 | 2 |
| B | 0 | 11774 | 2 |
| C | 0 | 13422 | 2 |
| D | 0 | 15938 | 2 |
| Quadrant | Total seconds | Saturated seconds | Saturation percentage |
|---|---|---|---|
| A | 5065 | 18 | 0.355380% |
| B | 5065 | 47 | 0.927937% |
| C | 5065 | 136 | 2.685094% |
| D | 5065 | 357 | 7.048371% |
Noise dominated data is calculated using 1-second bins in cleaned event files. If a bin has >2000 counts, and if more than 50% of those come from <1% of pixels, then it is considered to be noise-dominated and hence unusable.
| Quadrant | # 1 sec bins | Bins with >0 counts | Bins with >2000 counts | High rate bins dominated by noise | Noise dominated (total time) | Noise dominated (detector-on time) | Marked lightcurve |
|---|---|---|---|---|---|---|---|
| A | 7128 | 5066 | 8 | 8 | 0.11% | 0.16% | 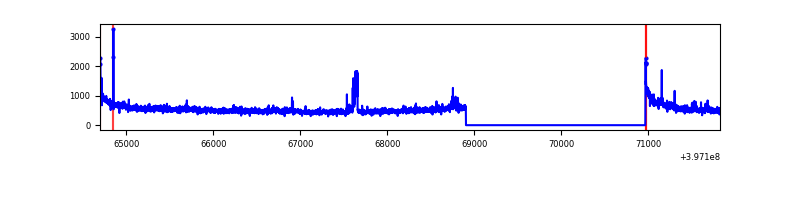 |
| B | 7128 | 5066 | 21 | 21 | 0.29% | 0.41% | 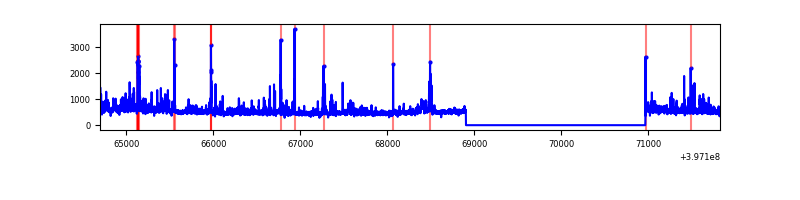 |
| C | 7128 | 5066 | 119 | 119 | 1.67% | 2.35% | 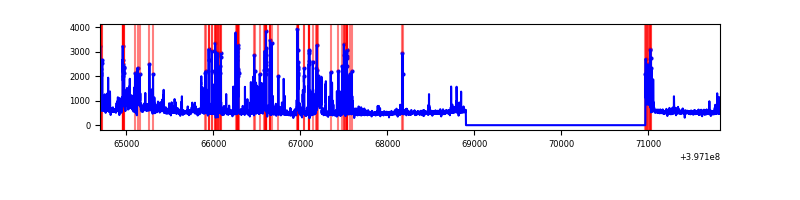 |
| D | 7128 | 5066 | 277 | 277 | 3.89% | 5.47% | 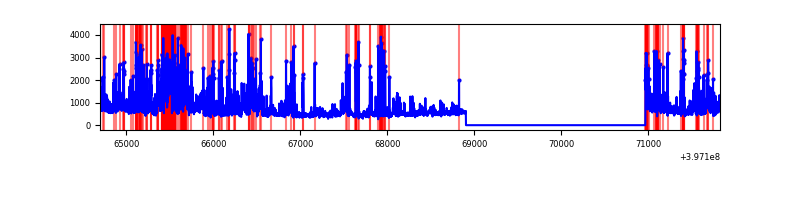 |
Top three noisy pixels from each quadrant. If the there are fewer than three noisy pixels in the level2.evt file, extra rows are filled as -1
| Pixel properties | Quadrant properties | ||||||
|---|---|---|---|---|---|---|---|
| Quadrant | DetID | PixID | Counts | Sigma | Mean | Median | Sigma |
| A | 10 | 83 | 238730 | 1933.92 | 609 | 600 | 123.1 |
| A | 14 | 1 | 164070 | 1327.59 | 609 | 600 | 123.1 |
| A | 13 | 6 | 14028 | 109.05 | 609 | 600 | 123.1 |
| B | 0 | 213 | 142403 | 1208.33 | 609 | 594 | 117.4 |
| B | 5 | 172 | 141342 | 1199.29 | 609 | 594 | 117.4 |
| B | 5 | 184 | 69764 | 589.39 | 609 | 594 | 117.4 |
| C | 1 | 23 | 700849 | 5026.4 | 596 | 601 | 139.3 |
| C | 15 | 214 | 215136 | 1539.94 | 596 | 601 | 139.3 |
| C | 0 | 10 | 115627 | 825.66 | 596 | 601 | 139.3 |
| D | 1 | 52 | 691142 | 4880.93 | 582 | 569 | 141.5 |
| D | 2 | 250 | 666242 | 4704.94 | 582 | 569 | 141.5 |
| D | 2 | 153 | 161299 | 1136.03 | 582 | 569 | 141.5 |
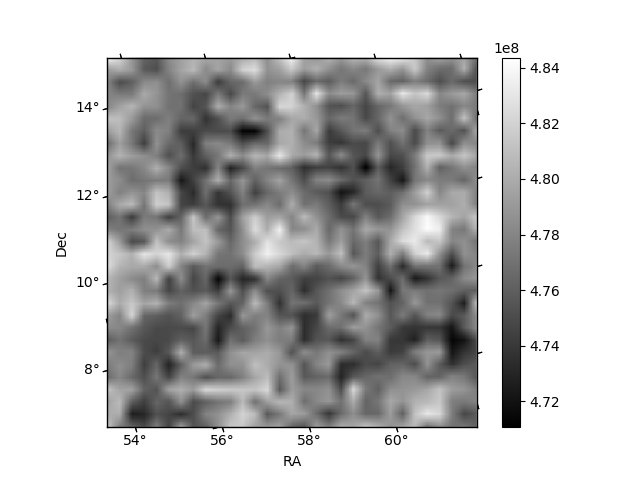
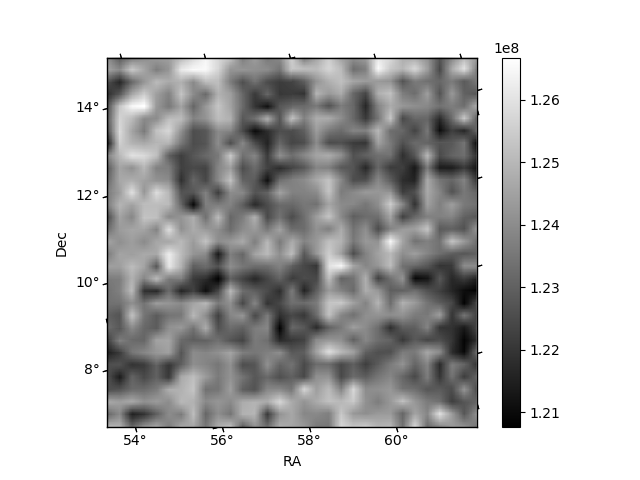
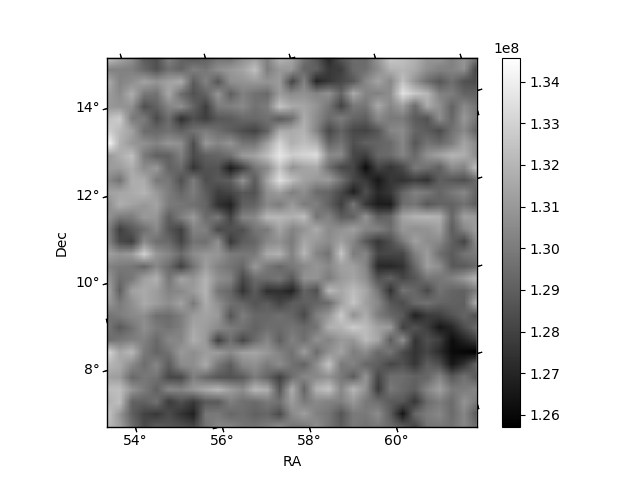
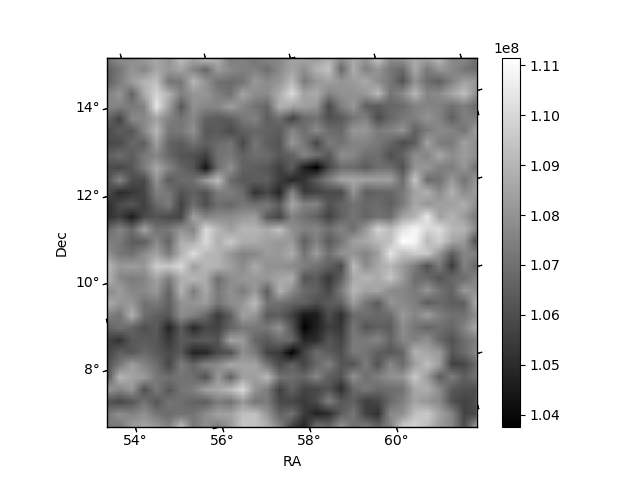
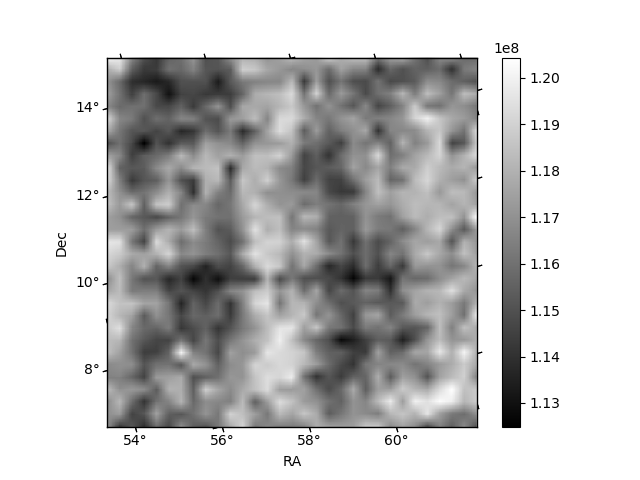
Histogram calculated using DETX and DETY for each event in the final _common_clean file
| Quadrant A | 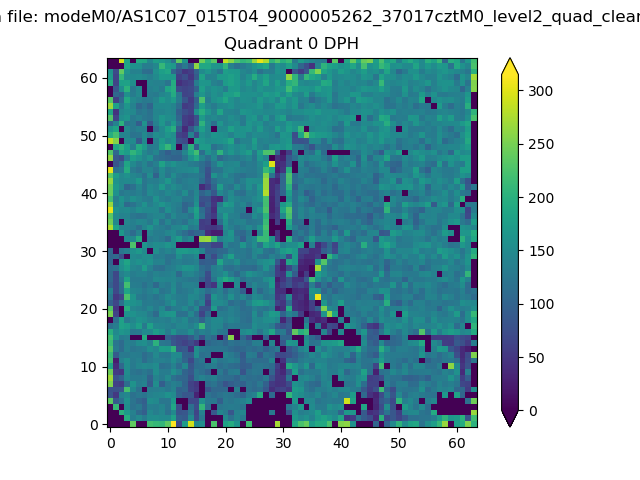 |
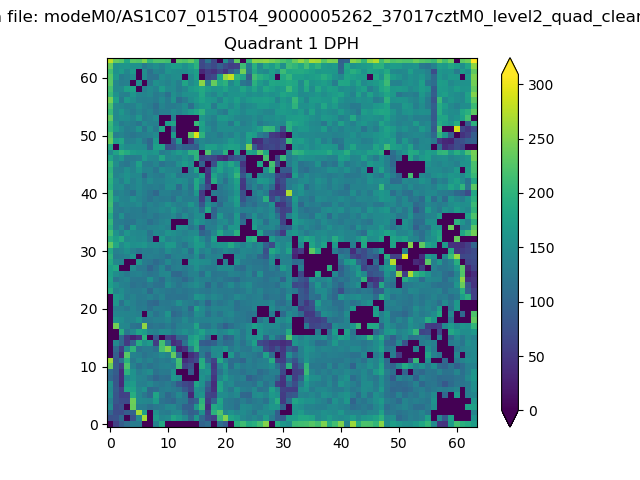 |
Quadrant B |
|---|---|---|---|
| Quadrant D | 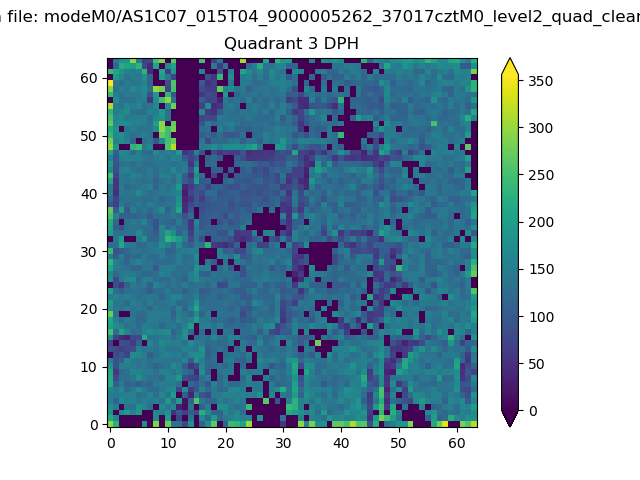 |
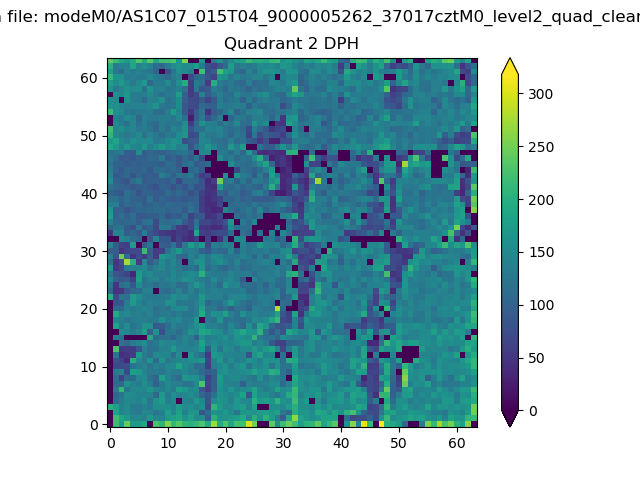 |
Quadrant C |
| Plot type | Count rate plots | Images |
|---|---|---|
| Comparison with Poisson distribution Blue bars denote a histogram of data divided into 1 sec bins. Red curve is a Poisson curve with rate = median count rate of data. |
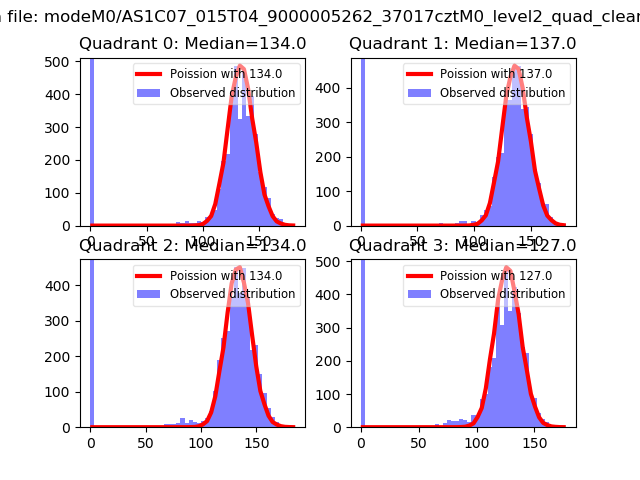 |
 |
| Quadrant-wise count rates Data is divided into 100 sec bins |
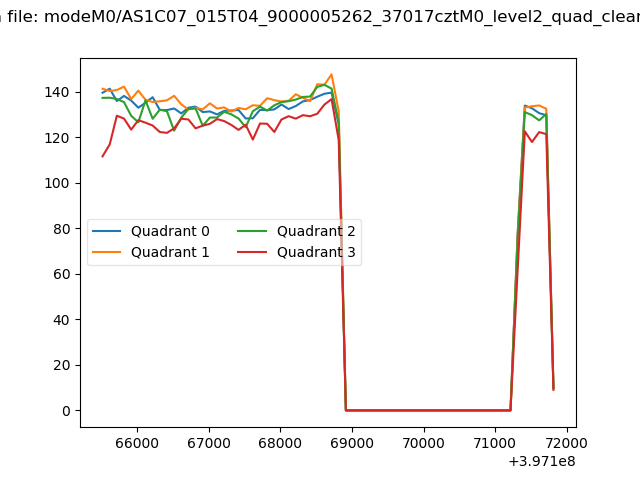 |
|
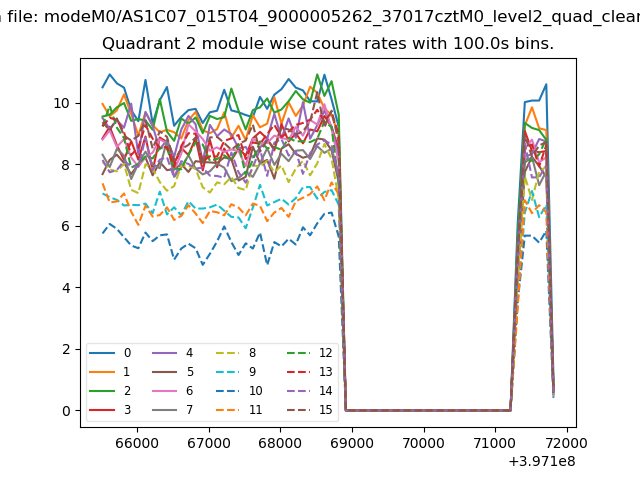
| Module-wise count rates for Quadrant A Data is divided into 100 sec bins |
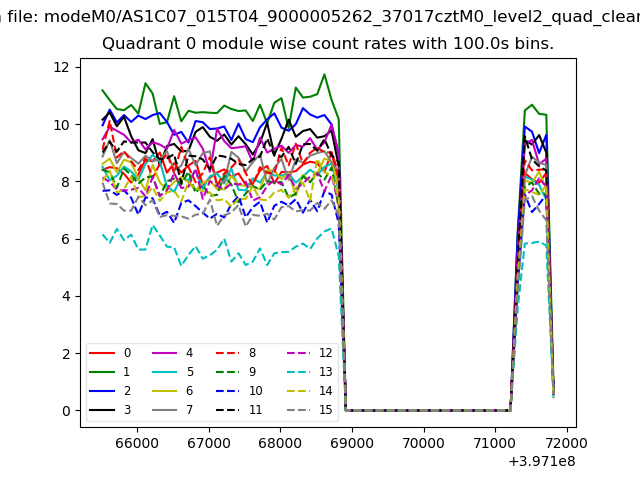 |
 |
| Module-wise count rates for Quadrant B Data is divided into 100 sec bins |
 |
 |
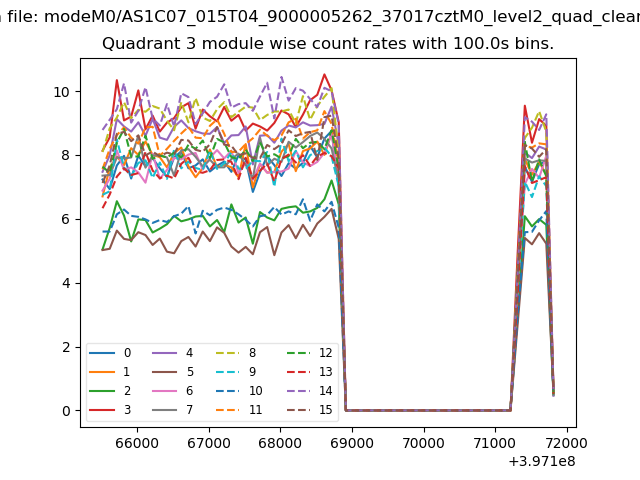
| Module-wise count rates for Quadrant C Data is divided into 100 sec bins |
 |
 |
| Module-wise count rates for Quadrant D Data is divided into 100 sec bins |
 |
 |
| Parameter | Plot |
|---|---|
| CZT HV Monitor | 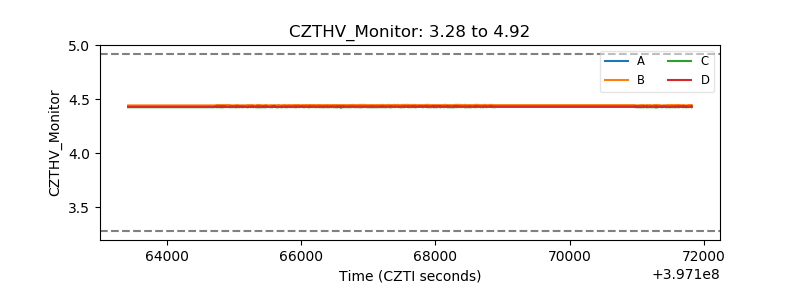 |
| D_VDD | 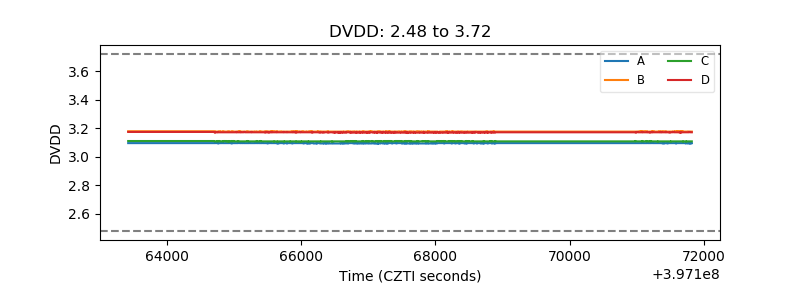 |
| Temperature 1 | 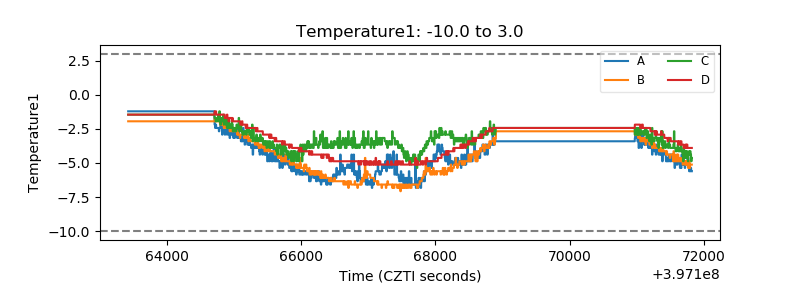 |
| Veto HV Monitor | 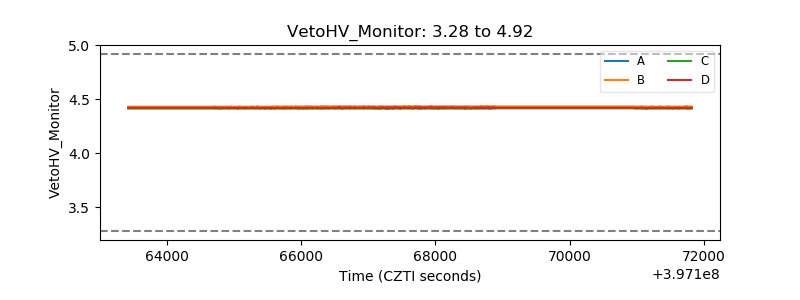 |
| Veto LLD | 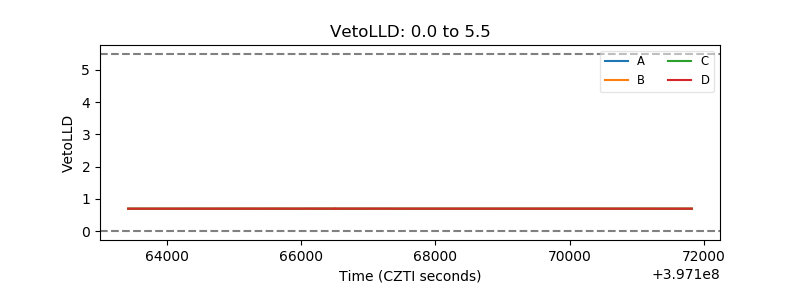 |
| Alpha Counter | 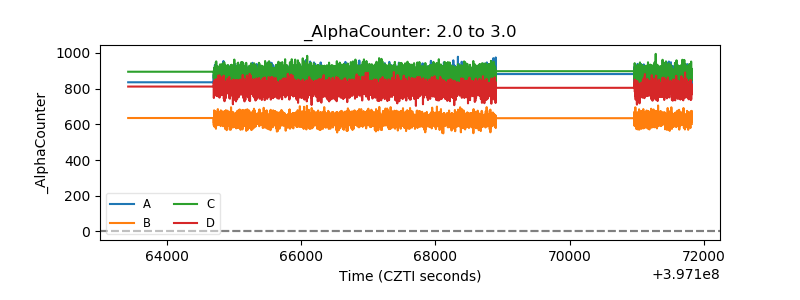 |
| _CPM_Rate | 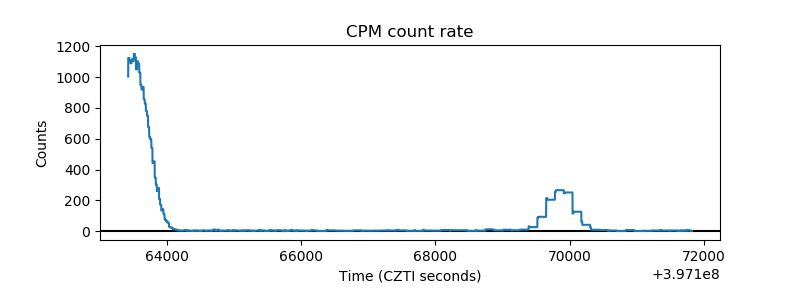 |
| CZT Counter | 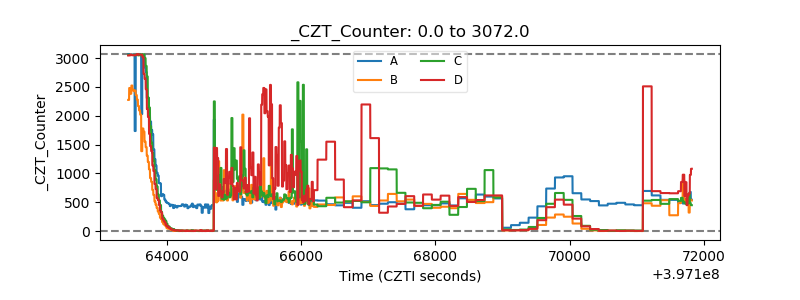 |
| +2.5 Volts monitor | 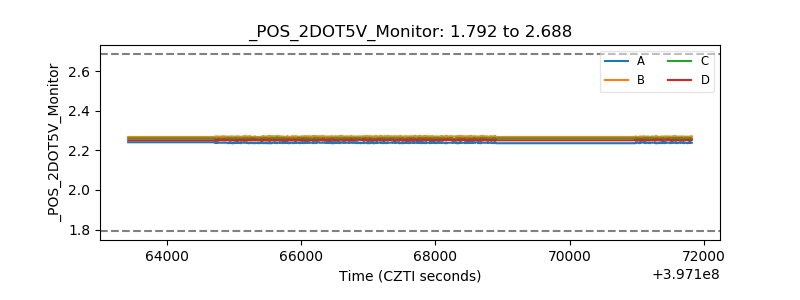 |
| +5 Volts monitor | 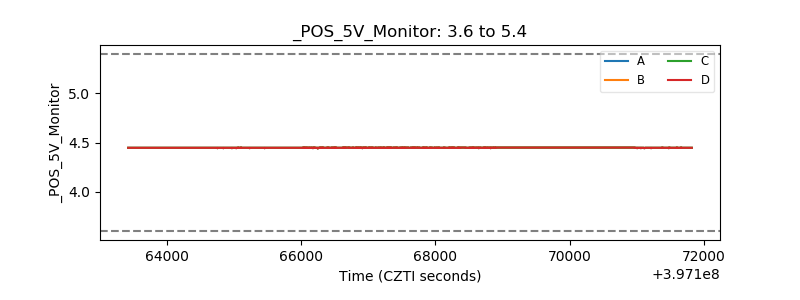 |
| _ROLL_ROT | 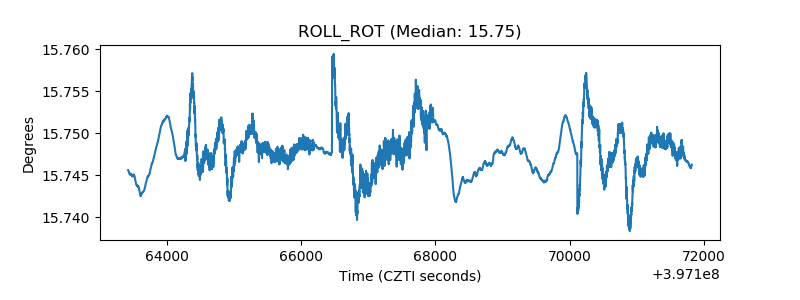 |
| _Roll_DEC | 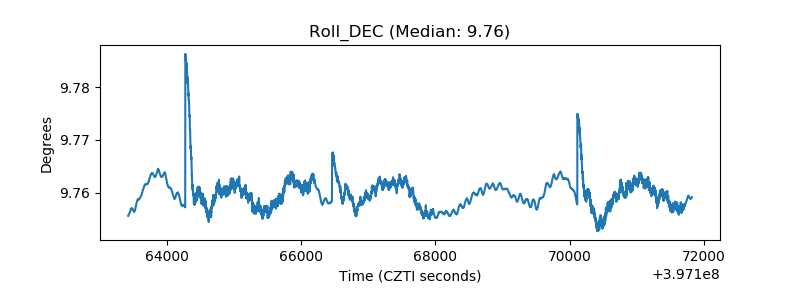 |
| _Roll_RA | 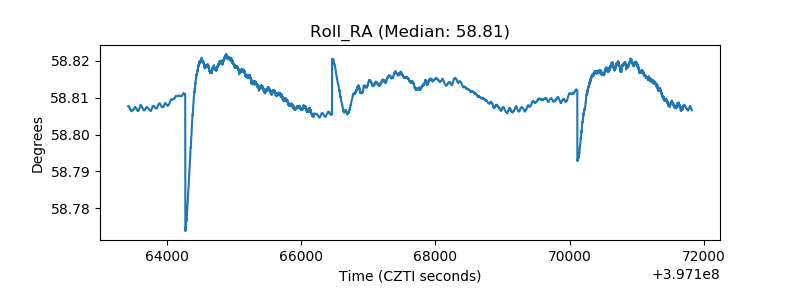 |
| Veto Counter |  |