| Param | Original file | Final file |
|---|---|---|
| Filename | modeM0/AS1C07_015T04_9000005262_37019cztM0_level2.evt | modeM0/AS1C07_015T04_9000005262_37019cztM0_level2_quad_clean.evt |
| Size (bytes) | 315,970,560 | 51,269,760 |
| Size | 301.3 MB | 48.9 MB |
| Events in quadrant A | 1,876,593 | 330,663 |
| Events in quadrant B | 2,231,364 | 335,087 |
| Events in quadrant C | 2,361,253 | 325,594 |
| Events in quadrant D | 2,858,119 | 309,683 |
| Mode SS | |||
|---|---|---|---|
| Quadrant | BADHDUFLAG | Total packets | Discarded packets |
| A | 0 | 70 | 0 |
| B | 0 | 70 | 0 |
| C | 0 | 70 | 0 |
| D | 0 | 70 | 0 |
| Mode M0 | |||
|---|---|---|---|
| Quadrant | BADHDUFLAG | Total packets | Discarded packets |
| A | 0 | 7731 | 2 |
| B | 0 | 8850 | 1 |
| C | 0 | 9241 | 1 |
| D | 0 | 10977 | 1 |
| Quadrant | Total seconds | Saturated seconds | Saturation percentage |
|---|---|---|---|
| A | 3552 | 5 | 0.140766% |
| B | 3552 | 114 | 3.209459% |
| C | 3552 | 86 | 2.421171% |
| D | 3552 | 169 | 4.757883% |
Noise dominated data is calculated using 1-second bins in cleaned event files. If a bin has >2000 counts, and if more than 50% of those come from <1% of pixels, then it is considered to be noise-dominated and hence unusable.
| Quadrant | # 1 sec bins | Bins with >0 counts | Bins with >2000 counts | High rate bins dominated by noise | Noise dominated (total time) | Noise dominated (detector-on time) | Marked lightcurve |
|---|---|---|---|---|---|---|---|
| A | 3552 | 3552 | 0 | 0 | 0.00% | 0.00% | 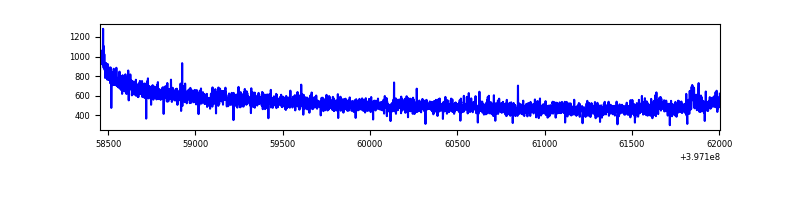 |
| B | 3552 | 3552 | 82 | 82 | 2.31% | 2.31% | 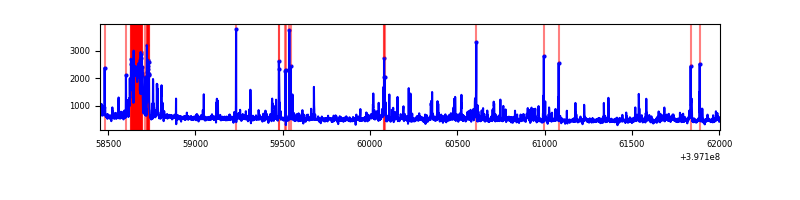 |
| C | 3552 | 3552 | 78 | 78 | 2.20% | 2.20% | 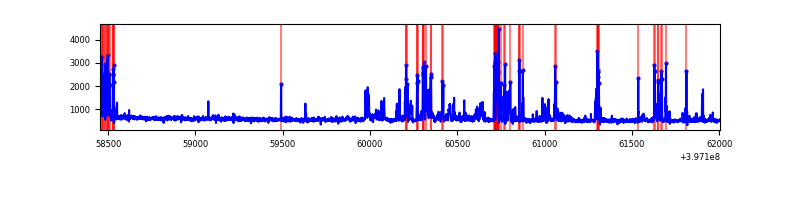 |
| D | 3552 | 3552 | 125 | 125 | 3.52% | 3.52% | 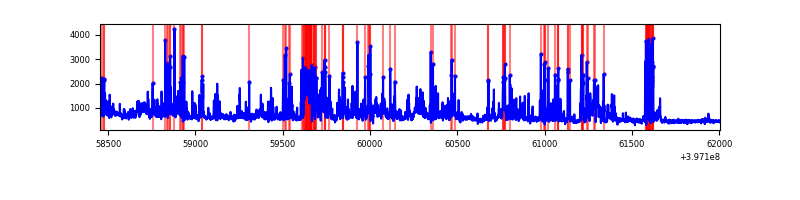 |
Top three noisy pixels from each quadrant. If the there are fewer than three noisy pixels in the level2.evt file, extra rows are filled as -1
| Pixel properties | Quadrant properties | ||||||
|---|---|---|---|---|---|---|---|
| Quadrant | DetID | PixID | Counts | Sigma | Mean | Median | Sigma |
| A | 10 | 83 | 128617 | 1423.24 | 446 | 439 | 90.1 |
| A | 12 | 189 | 16028 | 173.09 | 446 | 439 | 90.1 |
| A | 13 | 6 | 8190 | 86.06 | 446 | 439 | 90.1 |
| B | 5 | 184 | 200531 | 2388.92 | 442 | 432 | 83.8 |
| B | 0 | 213 | 136265 | 1621.67 | 442 | 432 | 83.8 |
| B | 5 | 172 | 83307 | 989.42 | 442 | 432 | 83.8 |
| C | 1 | 23 | 356146 | 3555.22 | 437 | 442 | 100.1 |
| C | 15 | 214 | 146908 | 1463.91 | 437 | 442 | 100.1 |
| C | 0 | 10 | 67531 | 670.55 | 437 | 442 | 100.1 |
| D | 1 | 52 | 680577 | 6409.66 | 431 | 420 | 106.1 |
| D | 12 | 235 | 188937 | 1776.54 | 431 | 420 | 106.1 |
| D | 2 | 153 | 104554 | 981.34 | 431 | 420 | 106.1 |
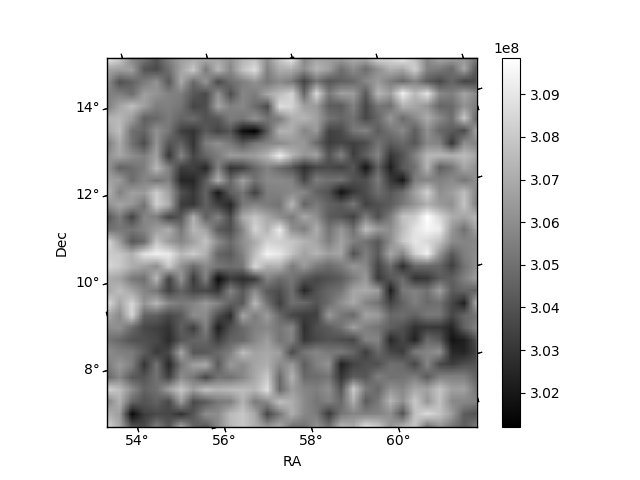
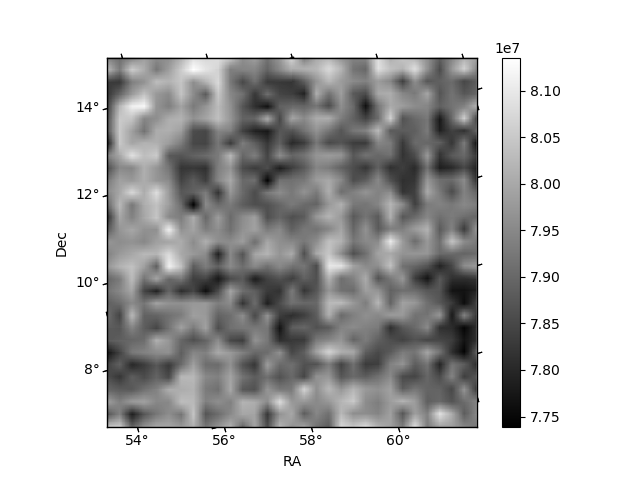
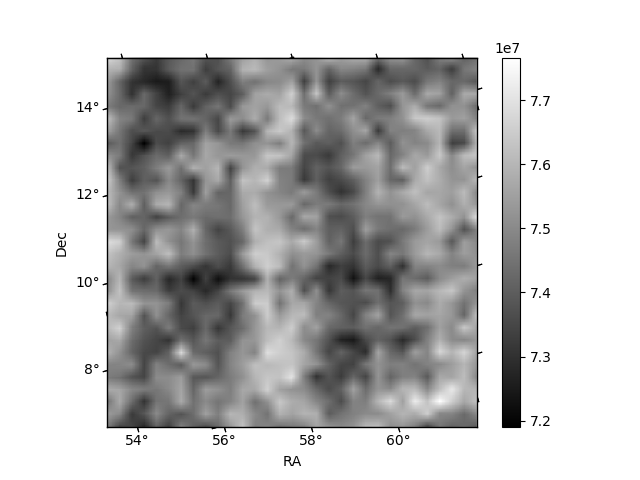
Histogram calculated using DETX and DETY for each event in the final _common_clean file
| Quadrant A | 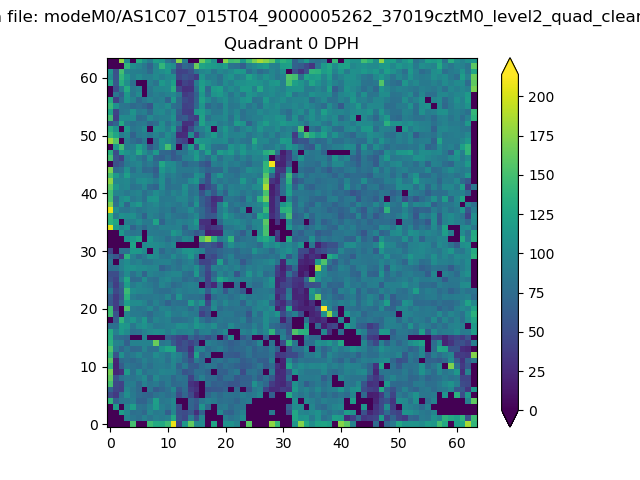 |
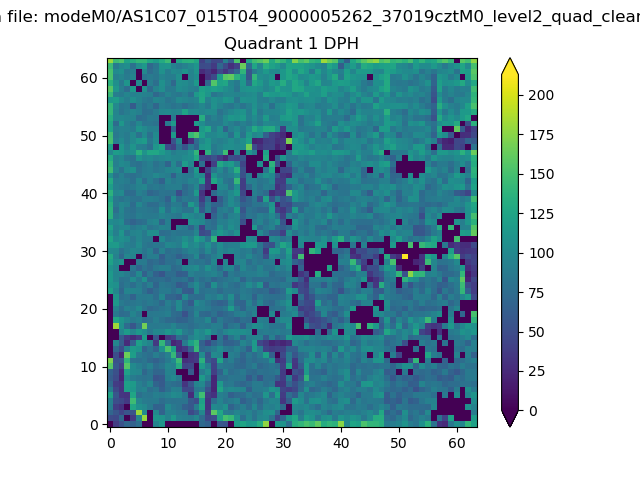 |
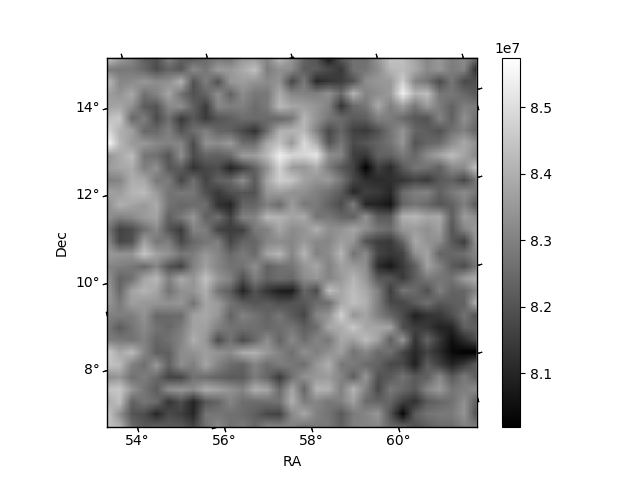
Quadrant B |
|---|---|---|---|
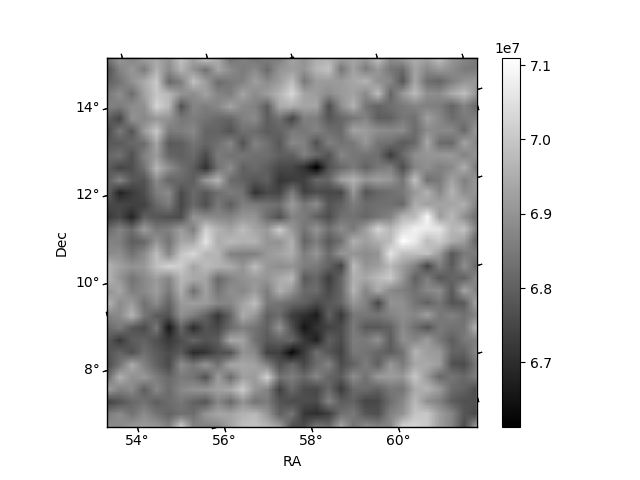
| Quadrant D | 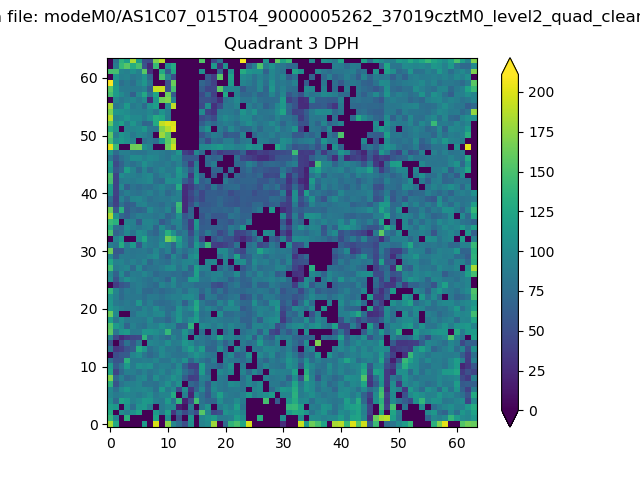 |
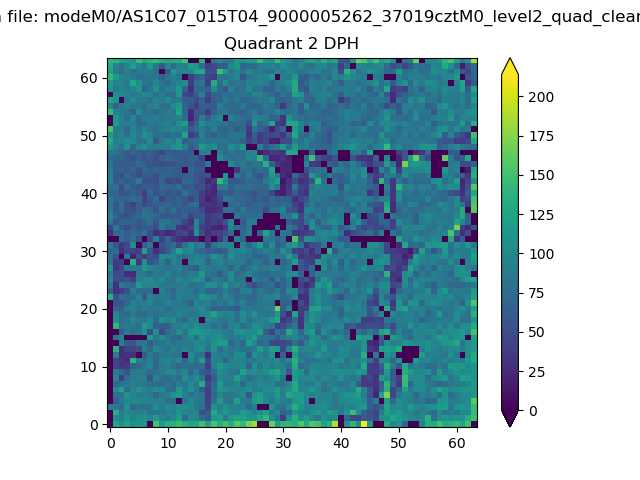 |
Quadrant C |
| Plot type | Count rate plots | Images |
|---|---|---|
| Comparison with Poisson distribution Blue bars denote a histogram of data divided into 1 sec bins. Red curve is a Poisson curve with rate = median count rate of data. |
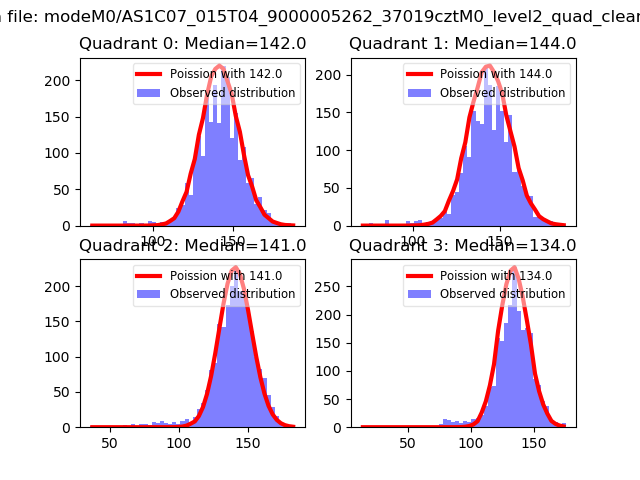 |
 |
| Quadrant-wise count rates Data is divided into 100 sec bins |
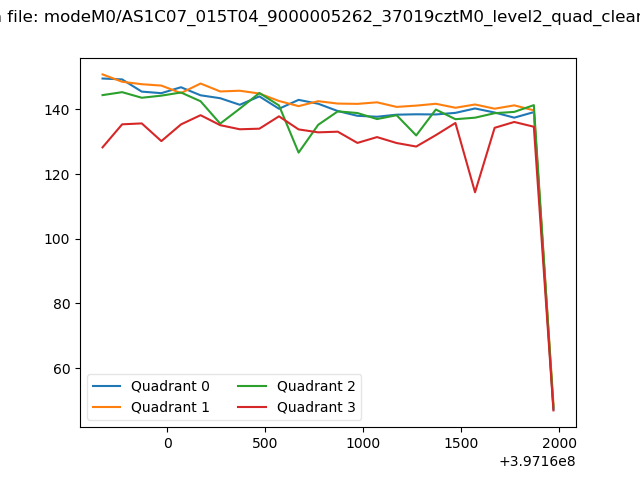 |
|
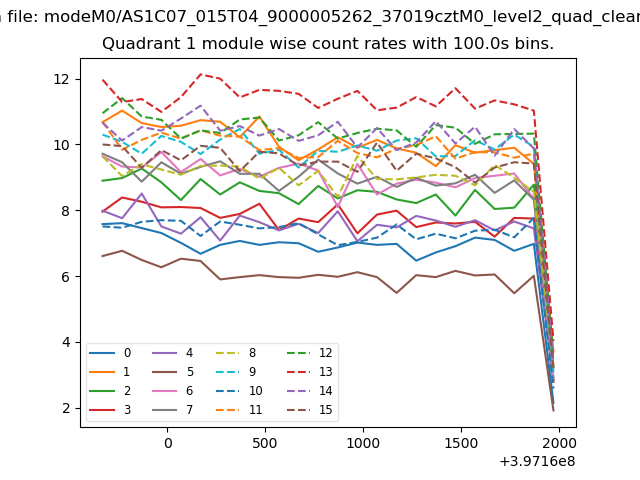
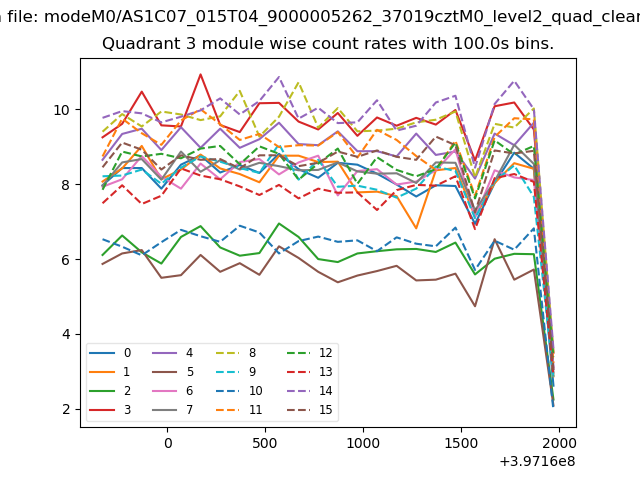
| Module-wise count rates for Quadrant A Data is divided into 100 sec bins |
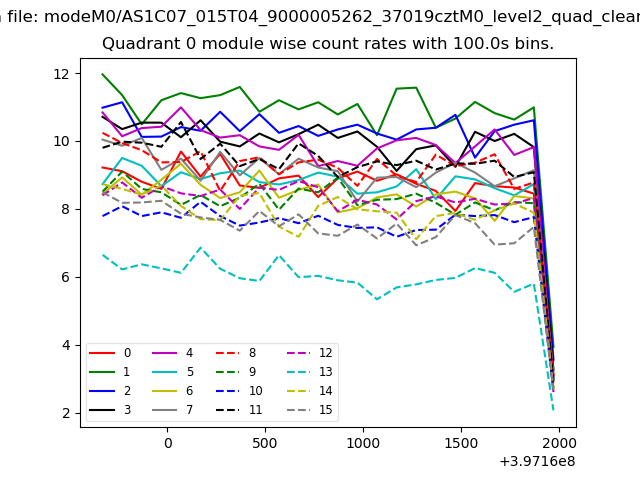 |
 |
| Module-wise count rates for Quadrant B Data is divided into 100 sec bins |
 |
 |
| Module-wise count rates for Quadrant C Data is divided into 100 sec bins |
 |
 |
| Module-wise count rates for Quadrant D Data is divided into 100 sec bins |
 |
 |
| Parameter | Plot |
|---|---|
| CZT HV Monitor | 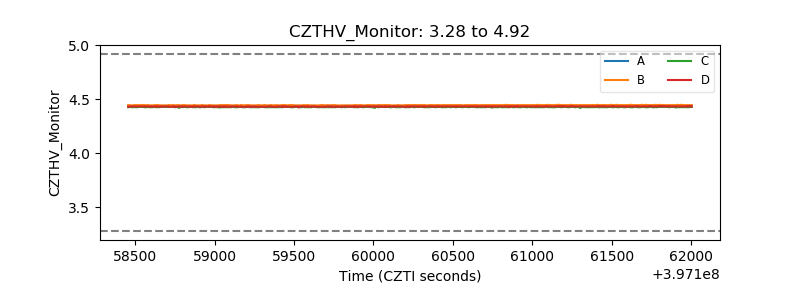 |
| D_VDD | 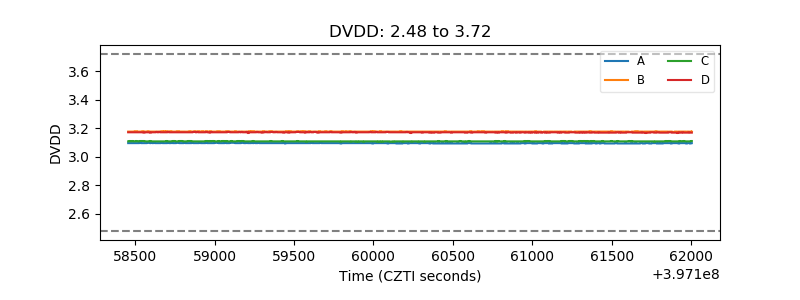 |
| Temperature 1 | 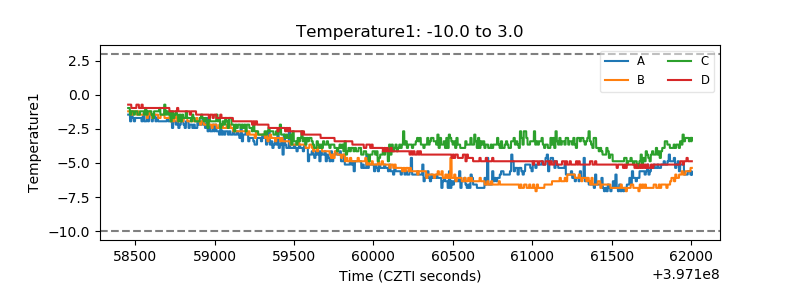 |
| Veto HV Monitor | 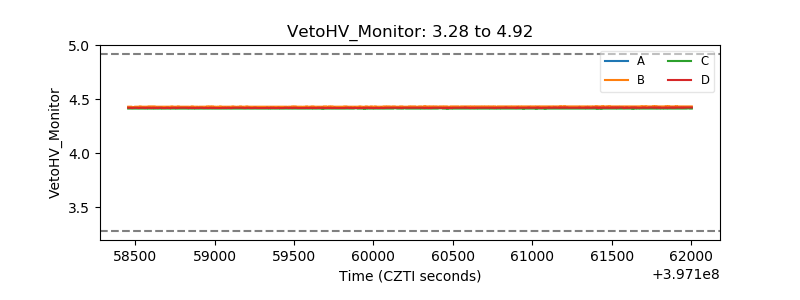 |
| Veto LLD | 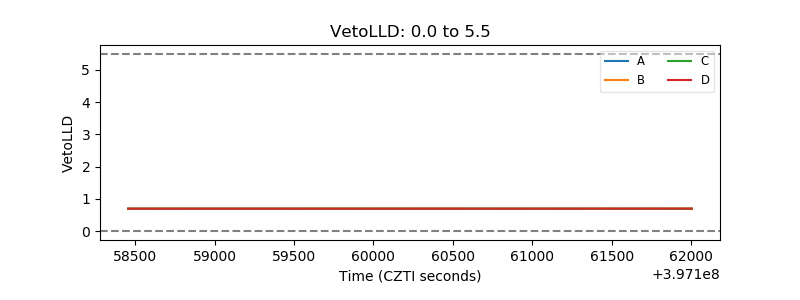 |
| Alpha Counter | 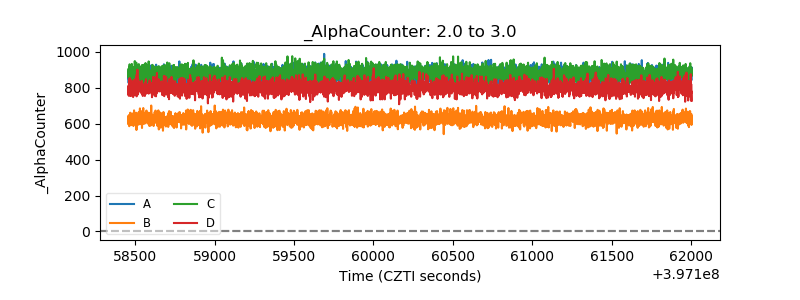 |
| _CPM_Rate | 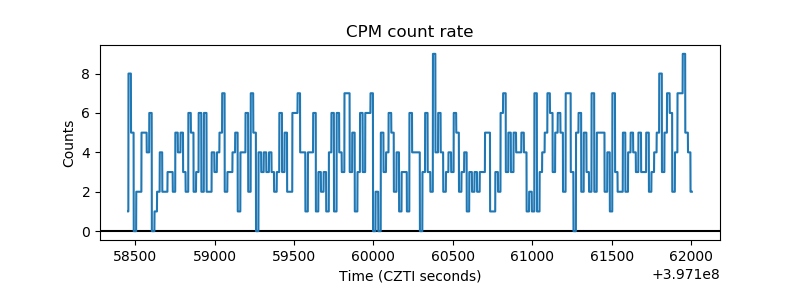 |
| CZT Counter | 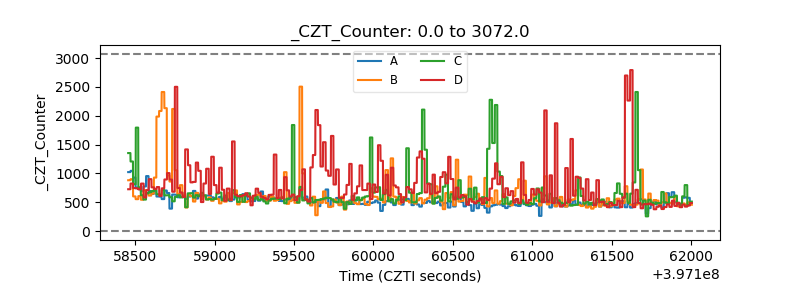 |
| +2.5 Volts monitor | 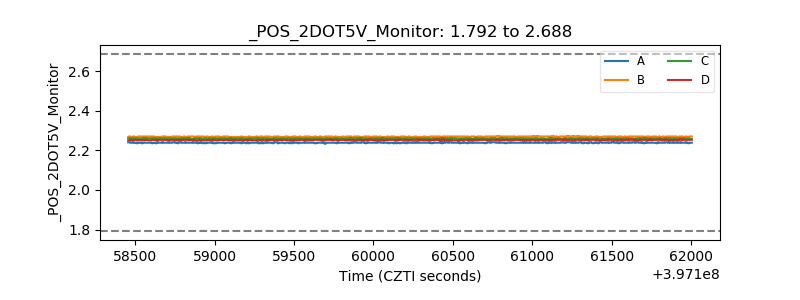 |
| +5 Volts monitor | 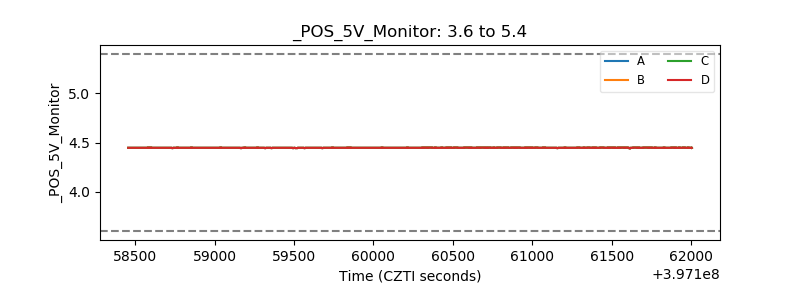 |
| _ROLL_ROT | 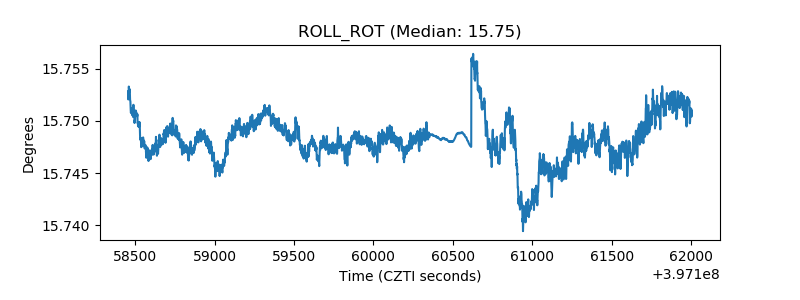 |
| _Roll_DEC | 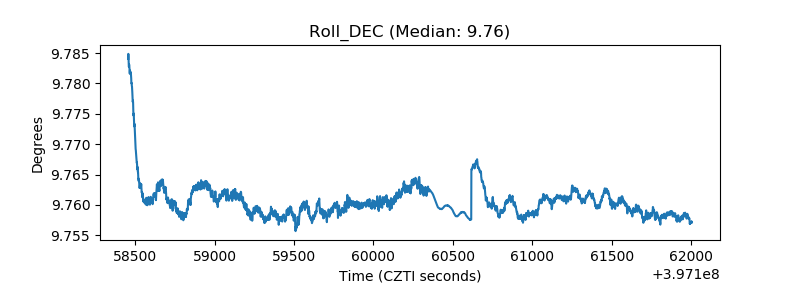 |
| _Roll_RA | 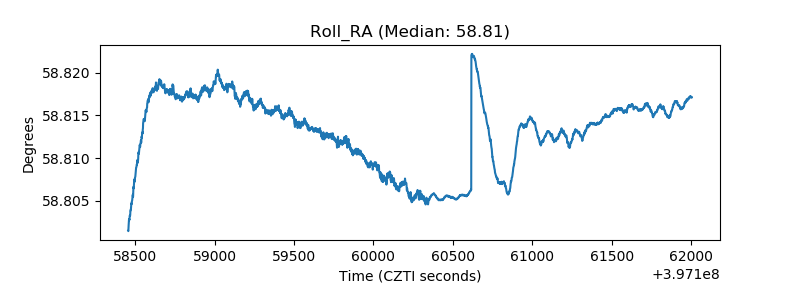 |
| Veto Counter | 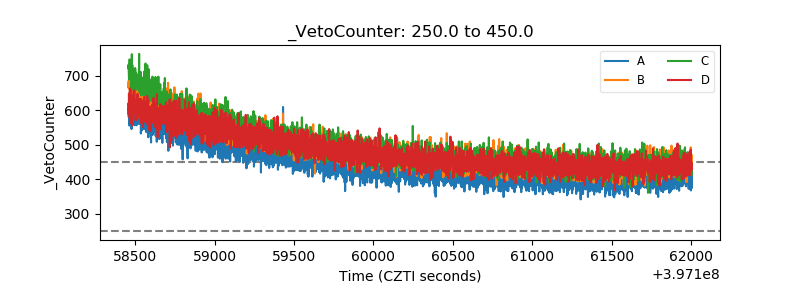 |