| Param | Original file | Final file |
|---|---|---|
| Filename | modeM0/AS1C07_015T06_9000005264cztM0_level2.fits | modeM0/AS1C07_015T06_9000005264cztM0_level2_quad_clean.evt |
| Size (bytes) | 211,694,400 | 239,022,720 |
| Size | 201.9 MB | 227.9 MB |
| Events in quadrant A | 1,278,372 | 1,479,146 |
| Events in quadrant B | 1,197,803 | 1,440,600 |
| Events in quadrant C | 1,255,016 | 1,428,815 |
| Events in quadrant D | 1,071,154 | 1,282,597 |
| Mode M9 | |||
|---|---|---|---|
| Quadrant | BADHDUFLAG | Total packets | Discarded packets |
| A | 0 | 85 | 0 |
| B | 0 | 86 | 0 |
| C | 0 | 85 | 0 |
| D | 0 | 86 | 0 |
| Mode M0 | |||
|---|---|---|---|
| Quadrant | BADHDUFLAG | Total packets | Discarded packets |
| A | 0 | 47800 | 0 |
| B | 0 | 58466 | 0 |
| C | 0 | 50608 | 0 |
| D | 0 | 64002 | 0 |
| Mode SS | |||
|---|---|---|---|
| Quadrant | BADHDUFLAG | Total packets | Discarded packets |
| A | 0 | 286 | 0 |
| B | 0 | 639 | 0 |
| C | 0 | 509 | 0 |
| D | 0 | 637 | 0 |
| Quadrant | Total seconds | Saturated seconds | Saturation percentage |
|---|---|---|---|
| A | 23306 | 30 | 0.128722% |
| B | 23194 | 916 | 3.949297% |
| C | 23287 | 167 | 0.717138% |
| D | 23086 | 1055 | 4.569869% |
Noise dominated data is calculated using 1-second bins in cleaned event files. If a bin has >2000 counts, and if more than 50% of those come from <1% of pixels, then it is considered to be noise-dominated and hence unusable.
| Quadrant | # 1 sec bins | Bins with >0 counts | Bins with >2000 counts | High rate bins dominated by noise | Noise dominated (total time) | Noise dominated (detector-on time) | Marked lightcurve |
|---|---|---|---|---|---|---|---|
| A | 40397 | 23954 | 0 | 0 | 0.00% | 0.00% |  |
| B | 40397 | 23894 | 0 | 0 | 0.00% | 0.00% |  |
| C | 40397 | 23904 | 0 | 0 | 0.00% | 0.00% |  |
| D | 40397 | 23778 | 0 | 0 | 0.00% | 0.00% |  |
Top three noisy pixels from each quadrant. If the there are fewer than three noisy pixels in the level2.evt file, extra rows are filled as -1
| Pixel properties | Quadrant properties | ||||||
|---|---|---|---|---|---|---|---|
| Quadrant | DetID | PixID | Counts | Sigma | Mean | Median | Sigma |
| A | 7 | 110 | 1036 | 8.66 | 334 | 313 | 83.5 |
| A | 9 | 19 | 995 | 8.17 | 334 | 313 | 83.5 |
| A | 0 | 29 | 994 | 8.15 | 334 | 313 | 83.5 |
| B | 2 | 9 | 1139 | 13.19 | 316 | 302 | 63.5 |
| B | 3 | 80 | 942 | 10.09 | 316 | 302 | 63.5 |
| B | 2 | 8 | 904 | 9.49 | 316 | 302 | 63.5 |
| C | 1 | 81 | 1080 | 8.98 | 332 | 311 | 85.6 |
| C | 1 | 80 | 1068 | 8.84 | 332 | 311 | 85.6 |
| C | 3 | 202 | 1033 | 8.43 | 332 | 311 | 85.6 |
| D | 3 | 14 | 810 | 6.41 | 305 | 278 | 82.9 |
| D | 10 | 189 | 798 | 6.26 | 305 | 278 | 82.9 |
| D | 10 | 113 | 798 | 6.26 | 305 | 278 | 82.9 |
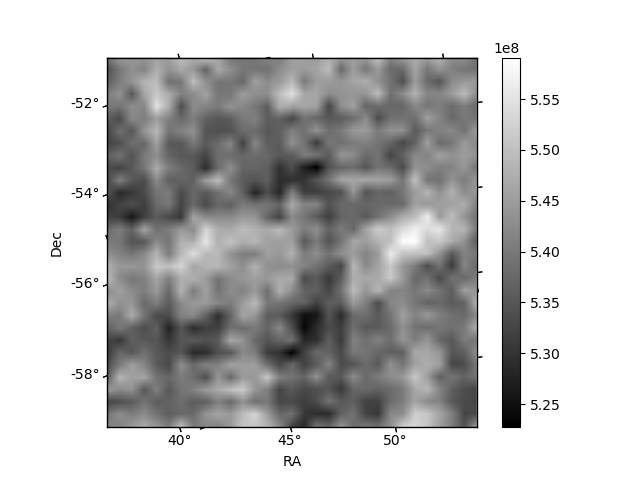
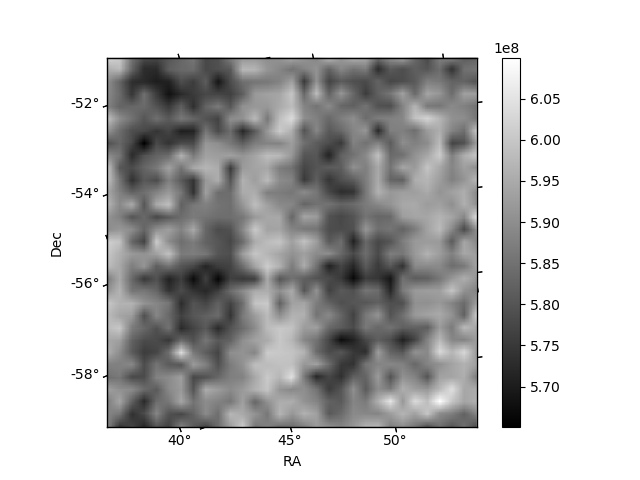
Histogram calculated using DETX and DETY for each event in the final _common_clean file
| Quadrant A | 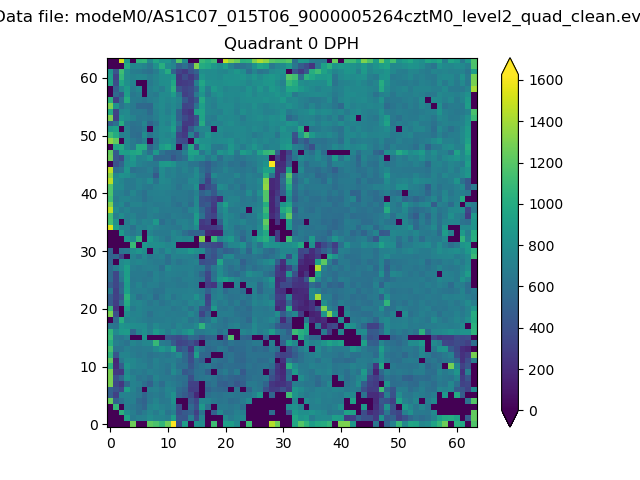 |
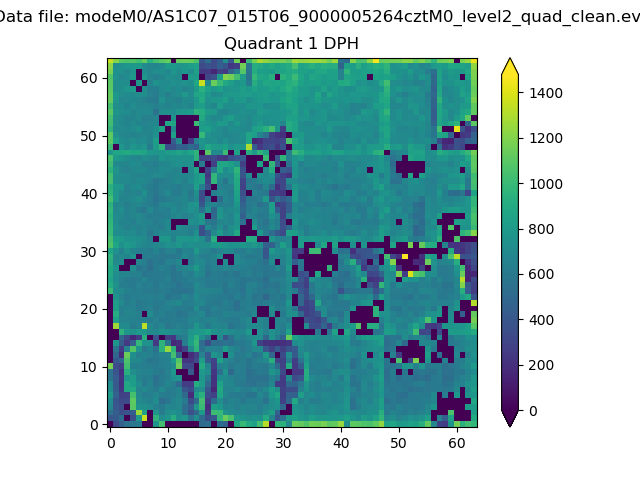 |
Quadrant B |
|---|---|---|---|
| Quadrant D |  |
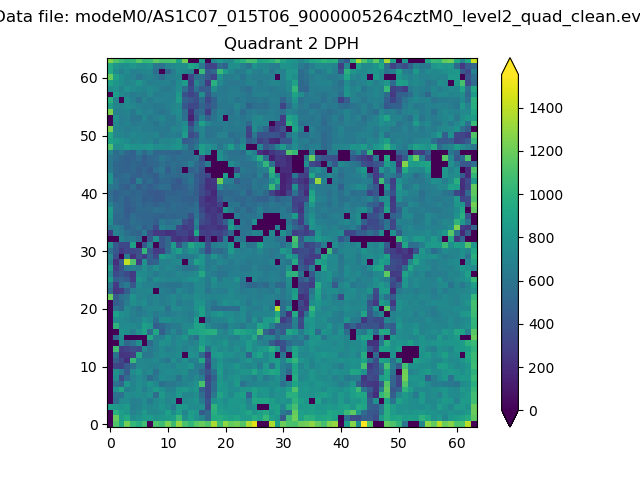 |
Quadrant C |
| Plot type | Count rate plots | Images |
|---|---|---|
| Comparison with Poisson distribution Blue bars denote a histogram of data divided into 1 sec bins. Red curve is a Poisson curve with rate = median count rate of data. |
 |
 |
| Quadrant-wise count rates Data is divided into 100 sec bins |
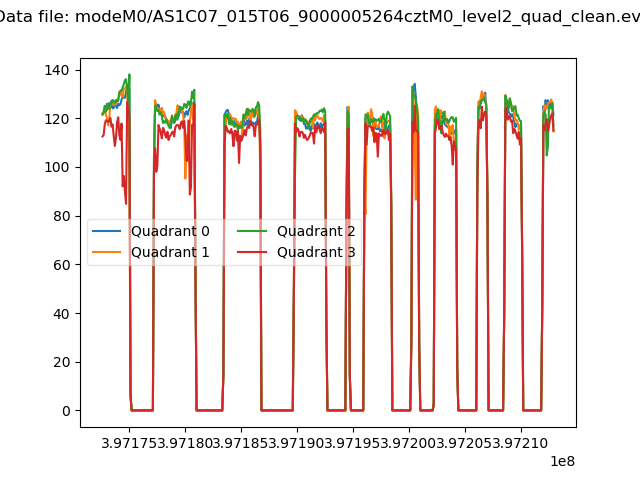 |
|
| Module-wise count rates for Quadrant A Data is divided into 100 sec bins |
 |
 |
| Module-wise count rates for Quadrant B Data is divided into 100 sec bins |
 |
 |
| Module-wise count rates for Quadrant C Data is divided into 100 sec bins |
 |
 |
| Module-wise count rates for Quadrant D Data is divided into 100 sec bins |
 |
 |
| Parameter | Plot |
|---|---|
| CZT HV Monitor |  |
| D_VDD |  |
| Temperature 1 |  |
| Veto HV Monitor |  |
| Veto LLD | 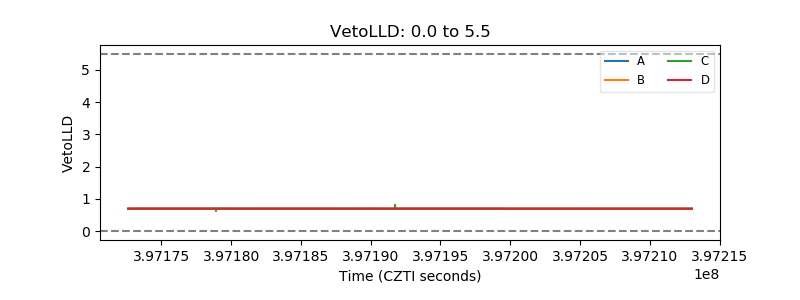 |
| Alpha Counter |  |
| _CPM_Rate |  |
| CZT Counter |  |
| +2.5 Volts monitor |  |
| +5 Volts monitor |  |
| _ROLL_ROT |  |
| _Roll_DEC |  |
| _Roll_RA |  |
| Veto Counter |  |