| Param | Original file | Final file |
|---|---|---|
| Filename | modeM0/AS1C07_015T06_9000005264_37017cztM0_level2.evt | modeM0/AS1C07_015T06_9000005264_37017cztM0_level2_quad_clean.evt |
| Size (bytes) | 325,992,960 | 60,523,200 |
| Size | 310.9 MB | 57.7 MB |
| Events in quadrant A | 1,726,648 | 406,604 |
| Events in quadrant B | 2,314,689 | 402,419 |
| Events in quadrant C | 1,983,615 | 410,051 |
| Events in quadrant D | 3,605,877 | 361,943 |
| Mode M9 | |||
|---|---|---|---|
| Quadrant | BADHDUFLAG | Total packets | Discarded packets |
| A | 0 | 18 | 0 |
| B | 0 | 18 | 0 |
| C | 0 | 18 | 0 |
| D | 0 | 18 | 0 |
| Mode M0 | |||
|---|---|---|---|
| Quadrant | BADHDUFLAG | Total packets | Discarded packets |
| A | 0 | 7341 | 2 |
| B | 0 | 9169 | 1 |
| C | 0 | 7981 | 1 |
| D | 0 | 13159 | 1 |
| Mode SS | |||
|---|---|---|---|
| Quadrant | BADHDUFLAG | Total packets | Discarded packets |
| A | 0 | 74 | 0 |
| B | 0 | 74 | 0 |
| C | 0 | 74 | 0 |
| D | 0 | 74 | 0 |
| Quadrant | Total seconds | Saturated seconds | Saturation percentage |
|---|---|---|---|
| A | 3543 | 2 | 0.056449% |
| B | 3543 | 181 | 5.108665% |
| C | 3543 | 26 | 0.733841% |
| D | 3543 | 488 | 13.773638% |
Noise dominated data is calculated using 1-second bins in cleaned event files. If a bin has >2000 counts, and if more than 50% of those come from <1% of pixels, then it is considered to be noise-dominated and hence unusable.
| Quadrant | # 1 sec bins | Bins with >0 counts | Bins with >2000 counts | High rate bins dominated by noise | Noise dominated (total time) | Noise dominated (detector-on time) | Marked lightcurve |
|---|---|---|---|---|---|---|---|
| A | 5335 | 3544 | 1 | 1 | 0.02% | 0.03% | 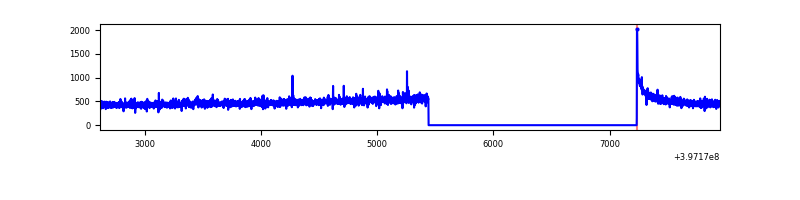 |
| B | 5335 | 3544 | 142 | 142 | 2.66% | 4.01% | 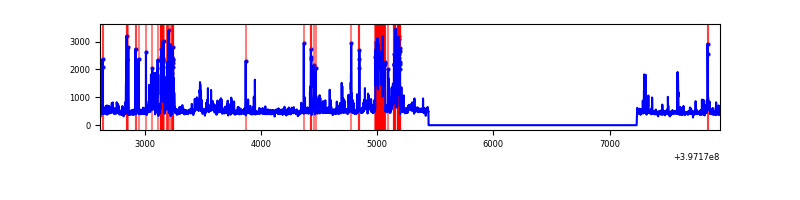 |
| C | 5335 | 3544 | 24 | 24 | 0.45% | 0.68% | 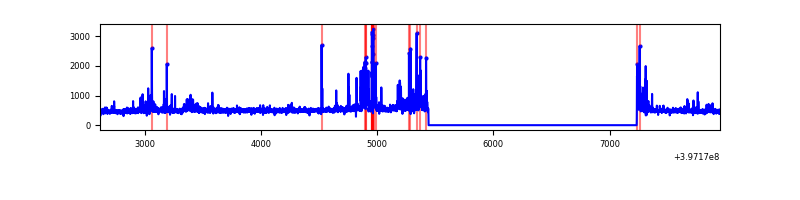 |
| D | 5335 | 3544 | 428 | 428 | 8.02% | 12.08% | 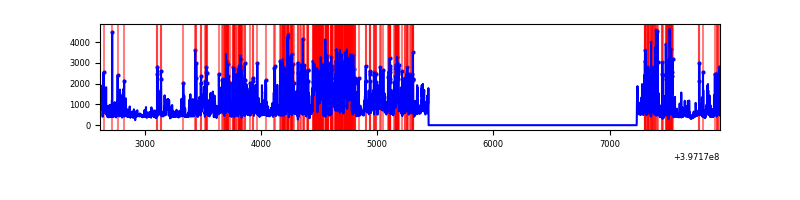 |
Top three noisy pixels from each quadrant. If the there are fewer than three noisy pixels in the level2.evt file, extra rows are filled as -1
| Pixel properties | Quadrant properties | ||||||
|---|---|---|---|---|---|---|---|
| Quadrant | DetID | PixID | Counts | Sigma | Mean | Median | Sigma |
| A | 10 | 83 | 132470 | 1611.04 | 405 | 397 | 82.0 |
| A | 13 | 6 | 16638 | 198.11 | 405 | 397 | 82.0 |
| A | 13 | 254 | 4793 | 53.62 | 405 | 397 | 82.0 |
| B | 5 | 184 | 396463 | 5186.81 | 394 | 383 | 76.4 |
| B | 5 | 172 | 200836 | 2625.0 | 394 | 383 | 76.4 |
| B | 0 | 213 | 52624 | 684.11 | 394 | 383 | 76.4 |
| C | 15 | 214 | 147373 | 1563.09 | 401 | 404 | 94.0 |
| C | 12 | 249 | 117832 | 1248.91 | 401 | 404 | 94.0 |
| C | 1 | 23 | 47265 | 498.39 | 401 | 404 | 94.0 |
| D | 1 | 52 | 1476980 | 15925.73 | 377 | 367 | 92.7 |
| D | 2 | 250 | 462417 | 4983.35 | 377 | 367 | 92.7 |
| D | 2 | 153 | 58190 | 623.64 | 377 | 367 | 92.7 |
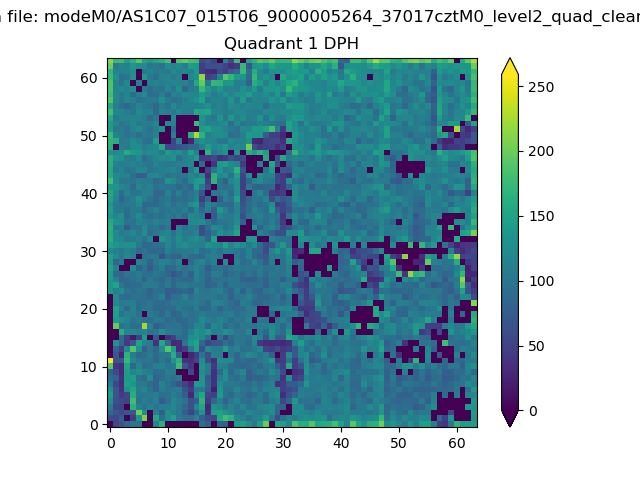
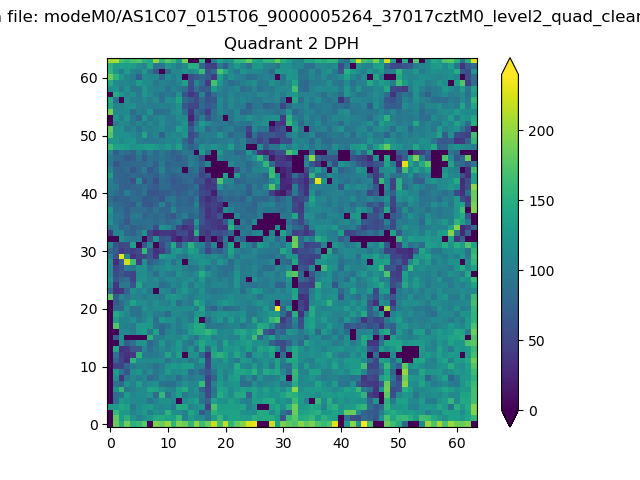
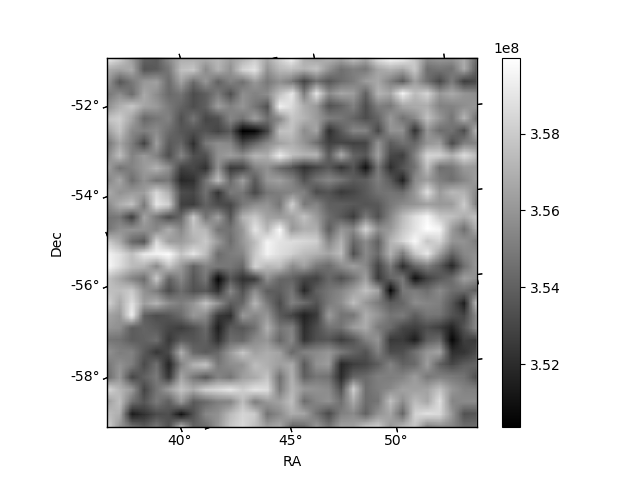
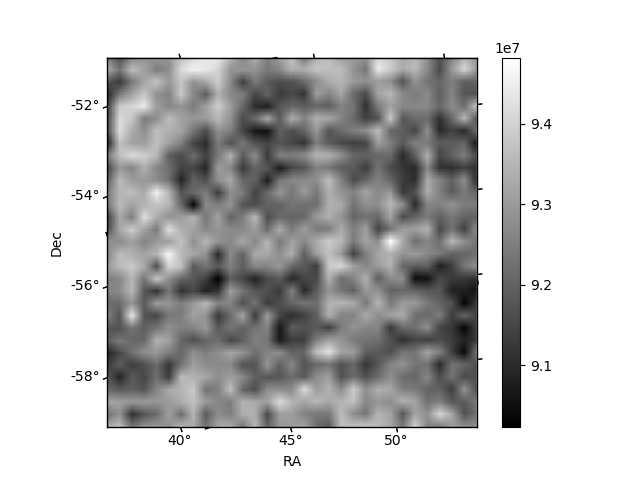
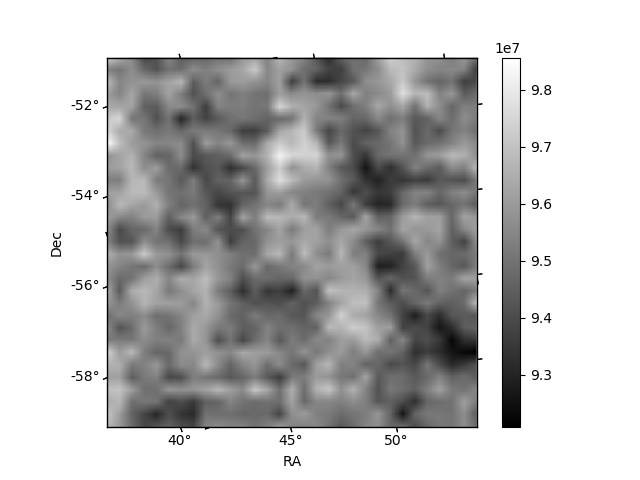
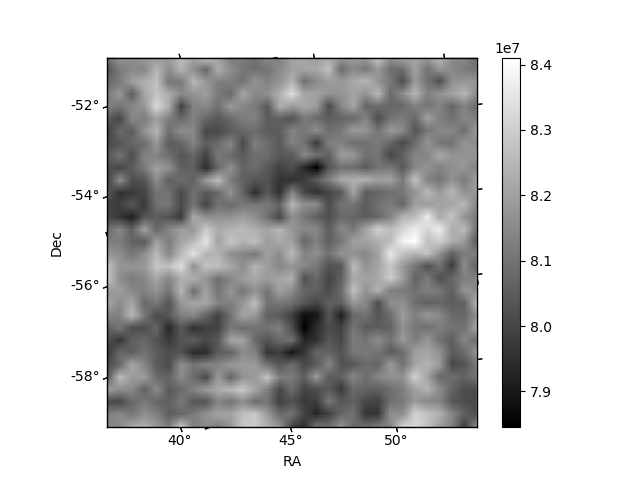
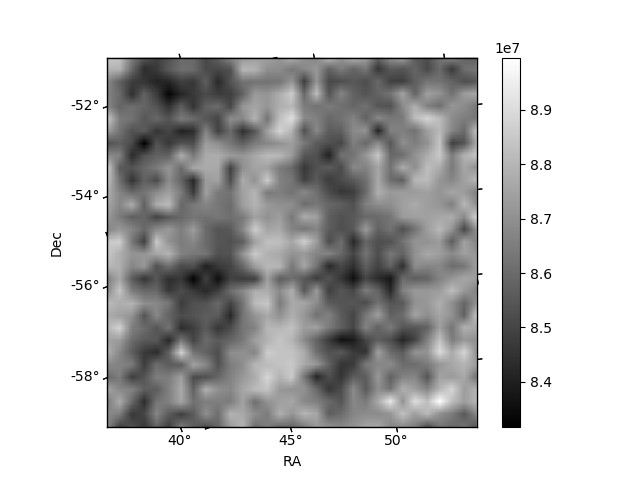
Histogram calculated using DETX and DETY for each event in the final _common_clean file
| Quadrant A |  |
 |
Quadrant B |
|---|---|---|---|
| Quadrant D | 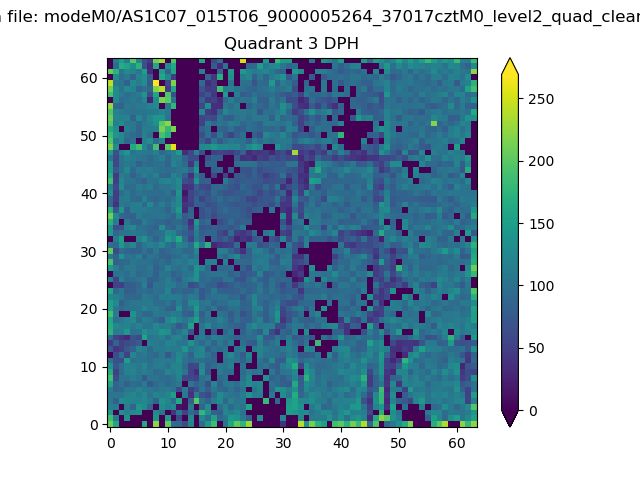 |
 |
Quadrant C |
| Plot type | Count rate plots | Images |
|---|---|---|
| Comparison with Poisson distribution Blue bars denote a histogram of data divided into 1 sec bins. Red curve is a Poisson curve with rate = median count rate of data. |
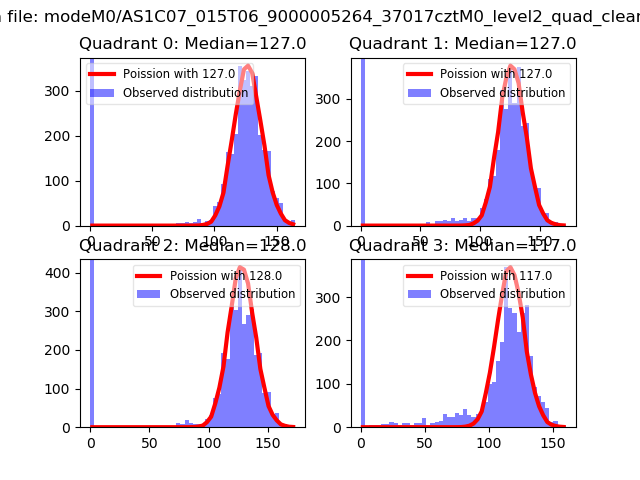 |
 |
| Quadrant-wise count rates Data is divided into 100 sec bins |
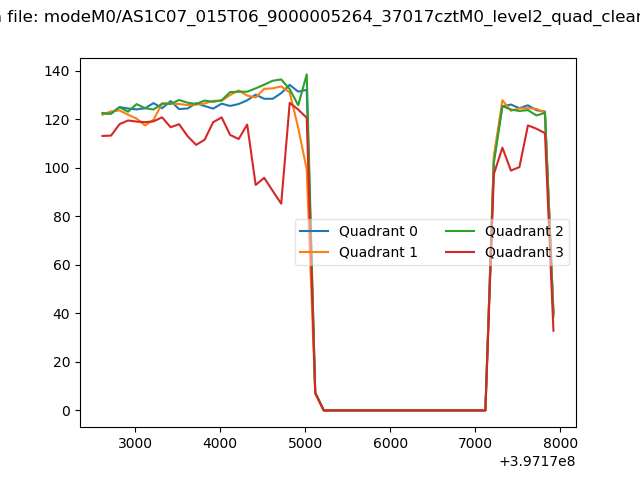 |
|
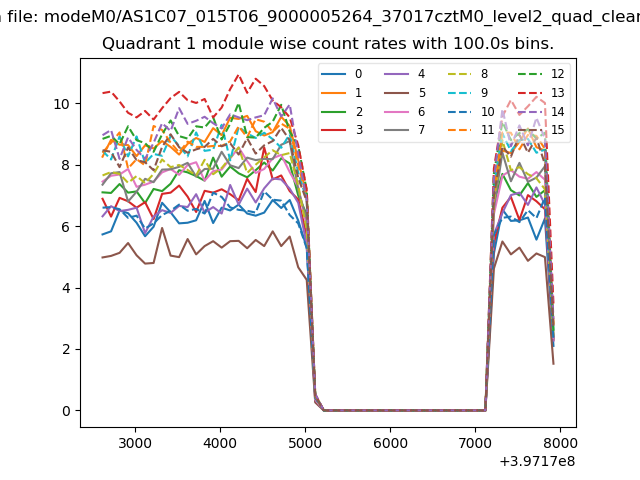
| Module-wise count rates for Quadrant A Data is divided into 100 sec bins |
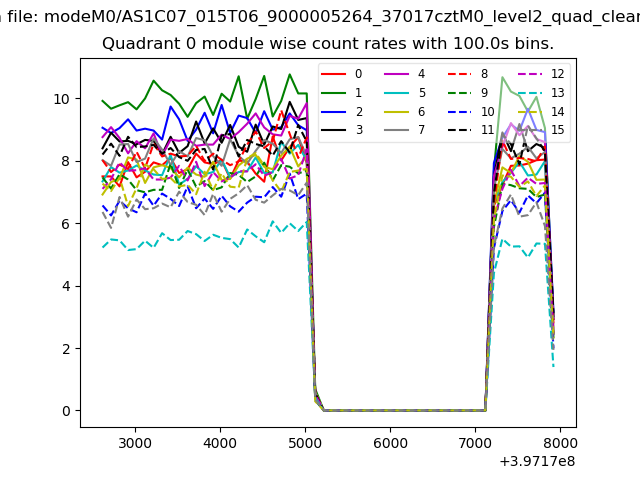 |
 |
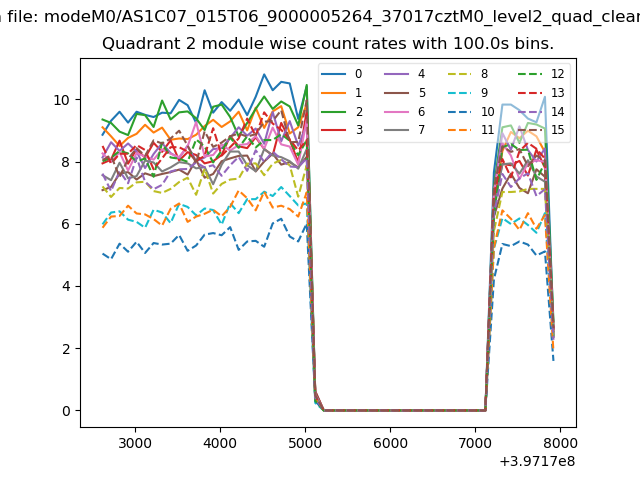
| Module-wise count rates for Quadrant B Data is divided into 100 sec bins |
 |
 |
| Module-wise count rates for Quadrant C Data is divided into 100 sec bins |
 |
 |
| Module-wise count rates for Quadrant D Data is divided into 100 sec bins |
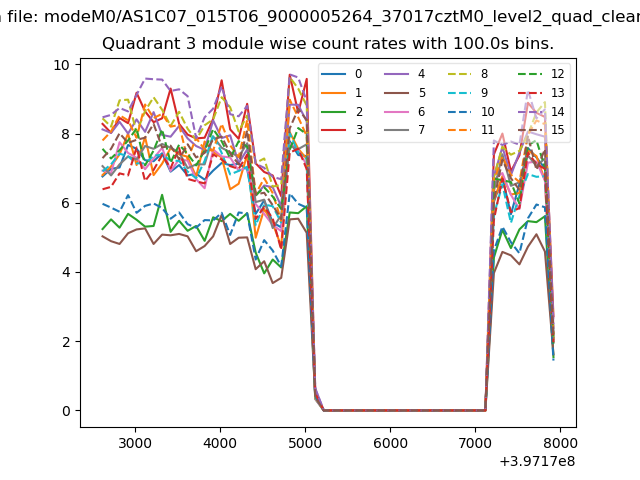 |
 |
| Parameter | Plot |
|---|---|
| CZT HV Monitor | 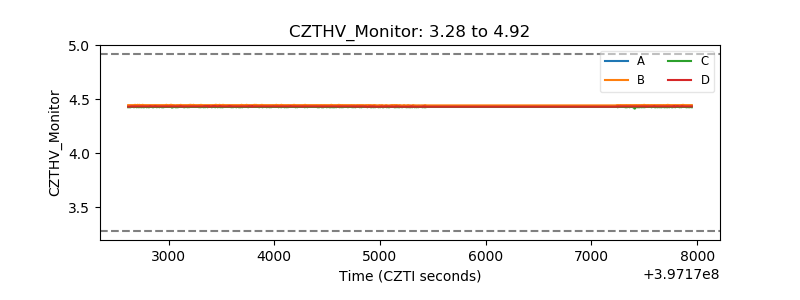 |
| D_VDD | 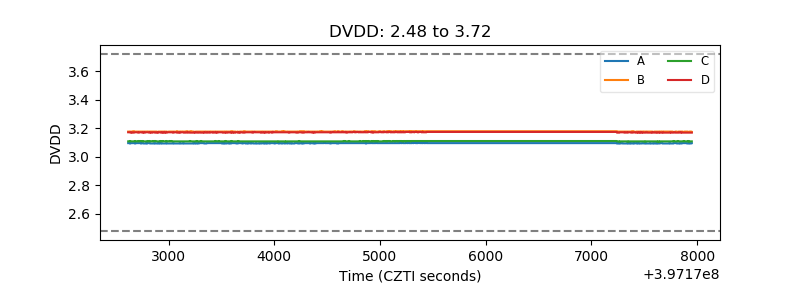 |
| Temperature 1 | 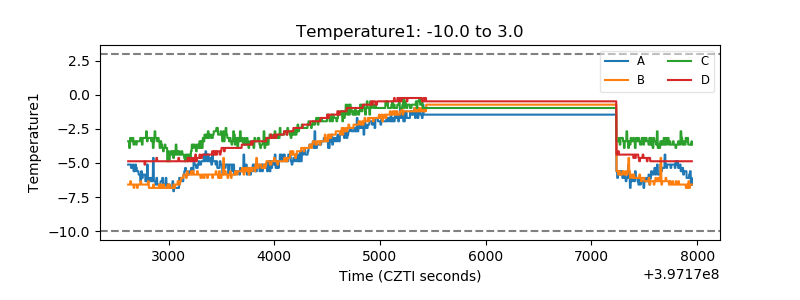 |
| Veto HV Monitor |  |
| Veto LLD | 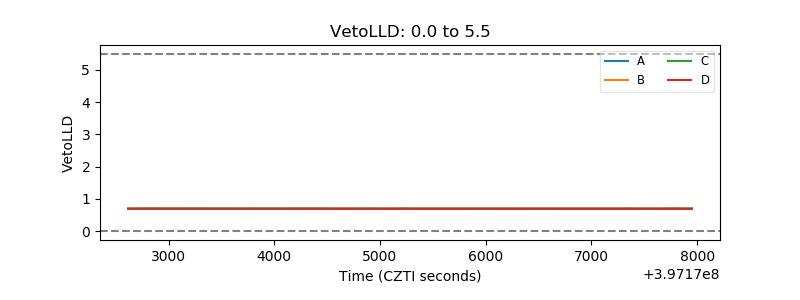 |
| Alpha Counter | 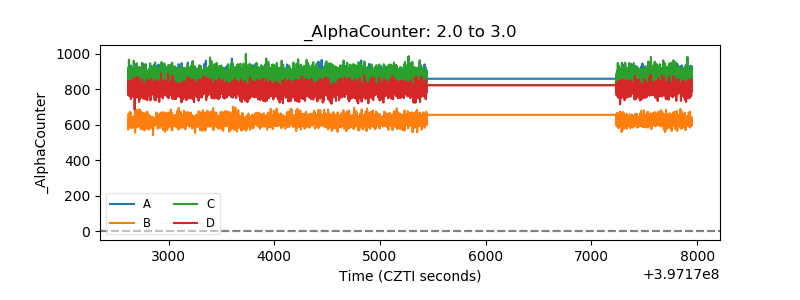 |
| _CPM_Rate | 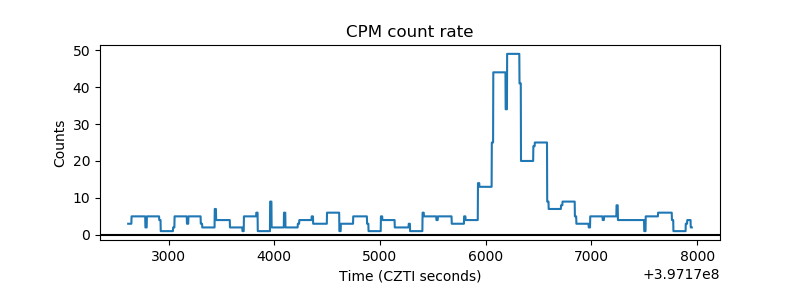 |
| CZT Counter | 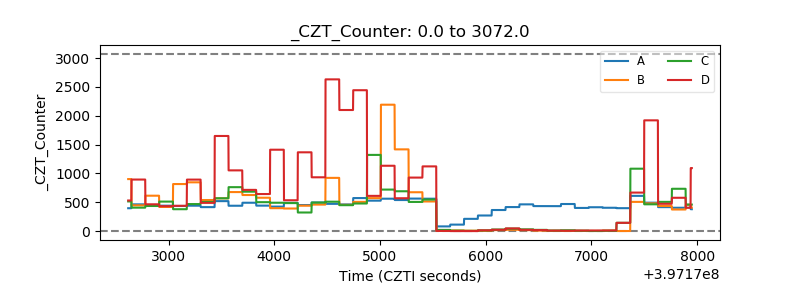 |
| +2.5 Volts monitor | 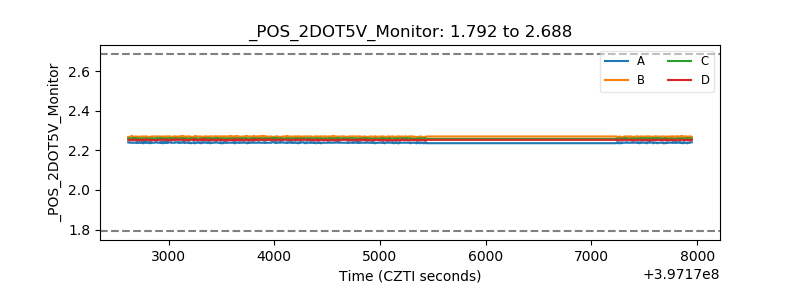 |
| +5 Volts monitor | 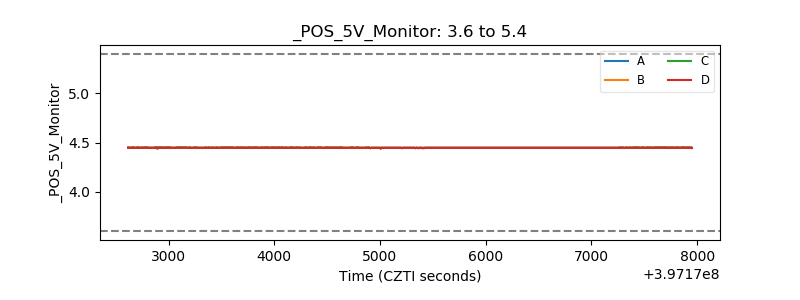 |
| _ROLL_ROT | 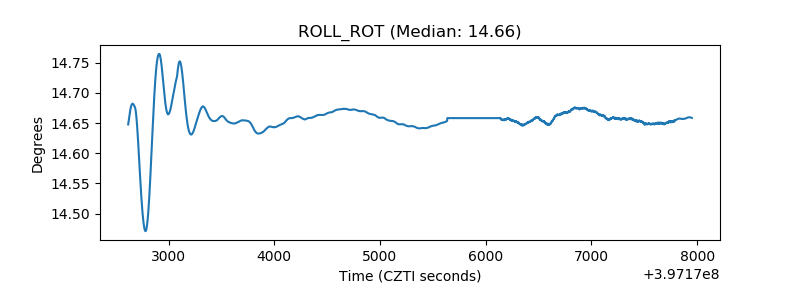 |
| _Roll_DEC | 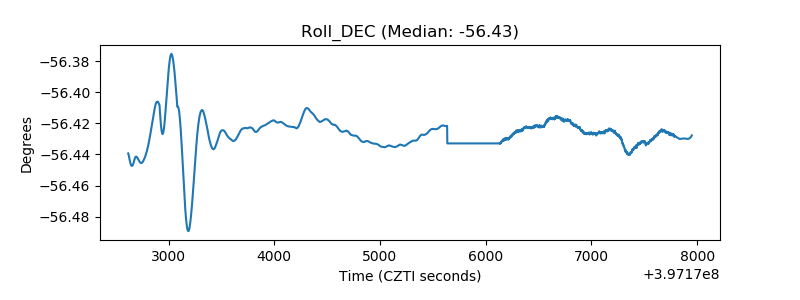 |
| _Roll_RA | 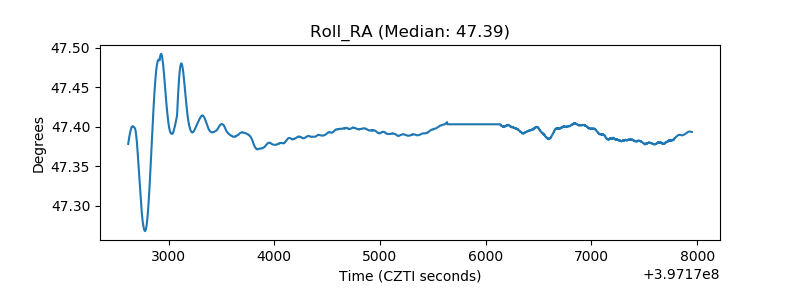 |
| Veto Counter | 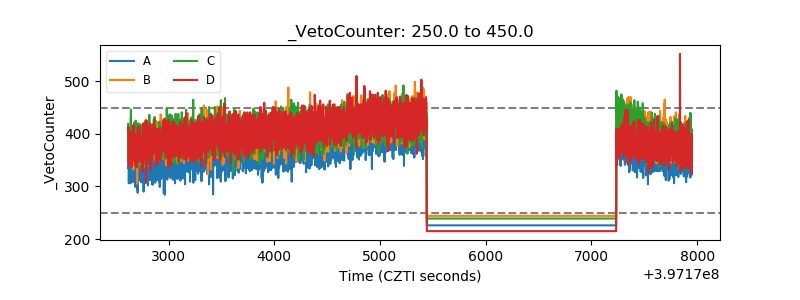 |