| Param | Original file | Final file |
|---|---|---|
| Filename | modeM0/AS1C07_015T06_9000005264_37018cztM0_level2.evt | modeM0/AS1C07_015T06_9000005264_37018cztM0_level2_quad_clean.evt |
| Size (bytes) | 497,396,160 | 84,962,880 |
| Size | 474.4 MB | 81.0 MB |
| Events in quadrant A | 2,835,390 | 552,972 |
| Events in quadrant B | 4,122,385 | 545,115 |
| Events in quadrant C | 3,184,903 | 554,003 |
| Events in quadrant D | 4,522,620 | 510,245 |
| Mode M9 | |||
|---|---|---|---|
| Quadrant | BADHDUFLAG | Total packets | Discarded packets |
| A | 0 | 32 | 0 |
| B | 0 | 32 | 0 |
| C | 0 | 32 | 0 |
| D | 0 | 32 | 0 |
| Mode M0 | |||
|---|---|---|---|
| Quadrant | BADHDUFLAG | Total packets | Discarded packets |
| A | 0 | 12184 | 3 |
| B | 0 | 16231 | 2 |
| C | 0 | 13020 | 2 |
| D | 0 | 17472 | 2 |
| Mode SS | |||
|---|---|---|---|
| Quadrant | BADHDUFLAG | Total packets | Discarded packets |
| A | 0 | 122 | 0 |
| B | 0 | 122 | 0 |
| C | 0 | 122 | 0 |
| D | 0 | 122 | 0 |
| Quadrant | Total seconds | Saturated seconds | Saturation percentage |
|---|---|---|---|
| A | 5871 | 11 | 0.187362% |
| B | 5871 | 329 | 5.603815% |
| C | 5871 | 41 | 0.698348% |
| D | 5871 | 388 | 6.608755% |
Noise dominated data is calculated using 1-second bins in cleaned event files. If a bin has >2000 counts, and if more than 50% of those come from <1% of pixels, then it is considered to be noise-dominated and hence unusable.
| Quadrant | # 1 sec bins | Bins with >0 counts | Bins with >2000 counts | High rate bins dominated by noise | Noise dominated (total time) | Noise dominated (detector-on time) | Marked lightcurve |
|---|---|---|---|---|---|---|---|
| A | 9127 | 5873 | 1 | 1 | 0.01% | 0.02% | 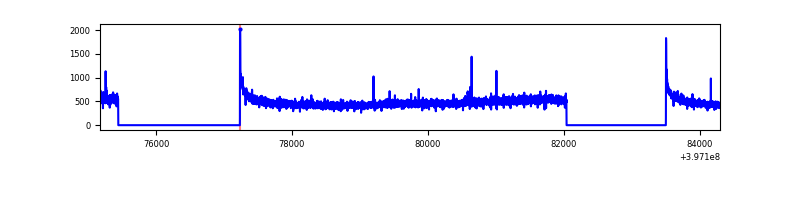 |
| B | 9127 | 5873 | 222 | 222 | 2.43% | 3.78% | 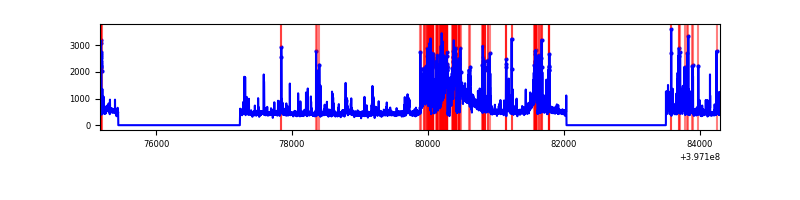 |
| C | 9127 | 5873 | 34 | 34 | 0.37% | 0.58% | 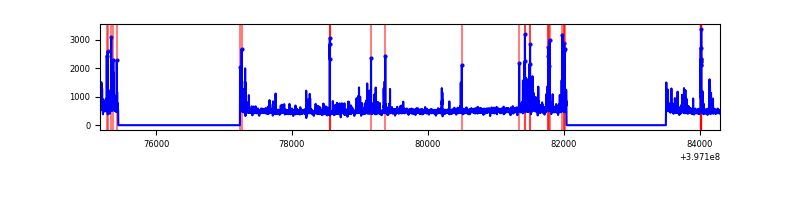 |
| D | 9127 | 5873 | 324 | 324 | 3.55% | 5.52% | 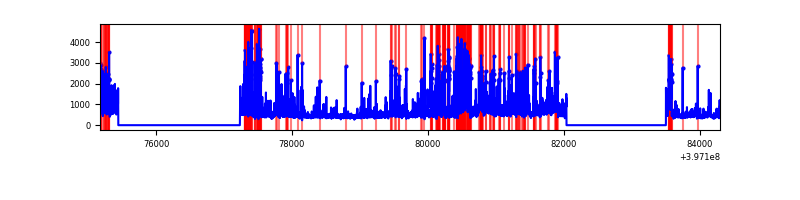 |
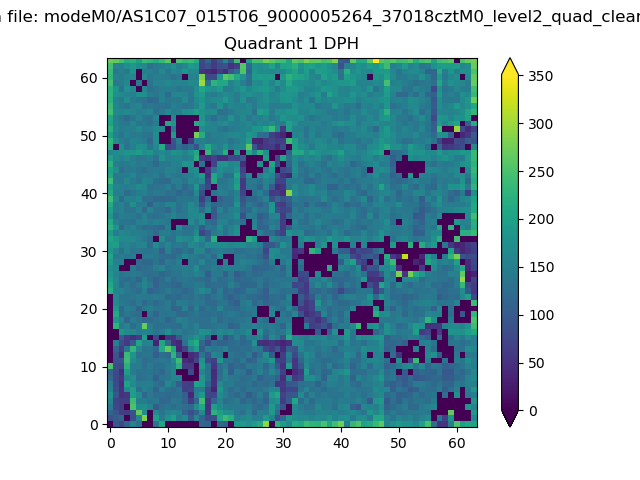
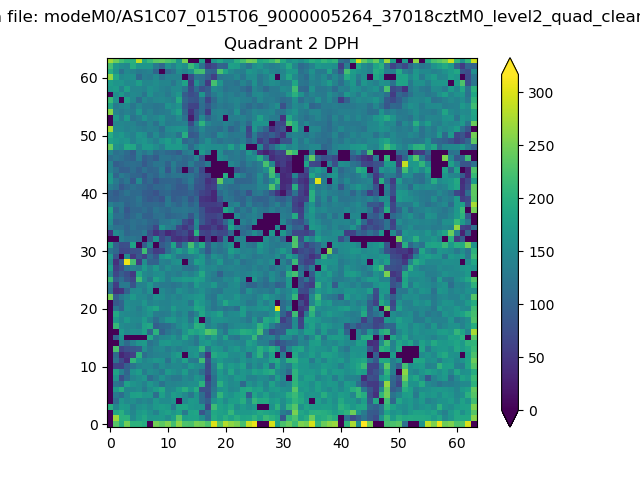
Top three noisy pixels from each quadrant. If the there are fewer than three noisy pixels in the level2.evt file, extra rows are filled as -1
| Pixel properties | Quadrant properties | ||||||
|---|---|---|---|---|---|---|---|
| Quadrant | DetID | PixID | Counts | Sigma | Mean | Median | Sigma |
| A | 10 | 83 | 244203 | 1823.95 | 664 | 650 | 133.5 |
| A | 13 | 6 | 17170 | 123.72 | 664 | 650 | 133.5 |
| A | 13 | 254 | 8585 | 59.42 | 664 | 650 | 133.5 |
| B | 5 | 184 | 1278994 | 10189.54 | 649 | 631 | 125.5 |
| B | 5 | 172 | 95992 | 760.1 | 649 | 631 | 125.5 |
| B | 4 | 232 | 43536 | 341.99 | 649 | 631 | 125.5 |
| C | 15 | 214 | 248779 | 1645.37 | 653 | 658 | 150.8 |
| C | 0 | 207 | 123223 | 812.77 | 653 | 658 | 150.8 |
| C | 0 | 10 | 75101 | 493.66 | 653 | 658 | 150.8 |
| D | 1 | 52 | 1296722 | 8372.36 | 636 | 619 | 154.8 |
| D | 2 | 250 | 180338 | 1160.92 | 636 | 619 | 154.8 |
| D | 2 | 153 | 168394 | 1083.77 | 636 | 619 | 154.8 |
Histogram calculated using DETX and DETY for each event in the final _common_clean file
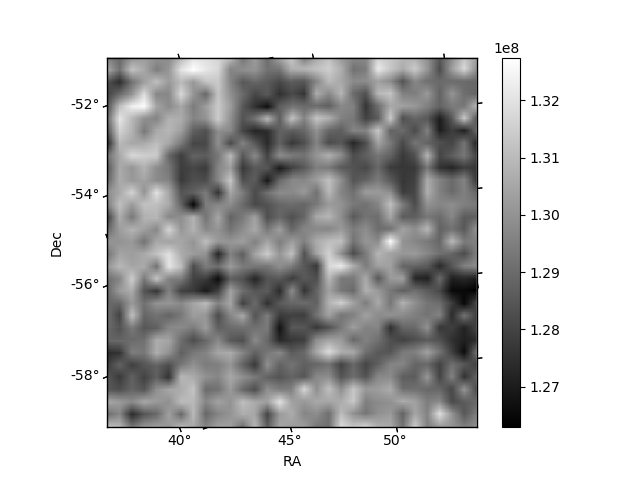
| Quadrant A | 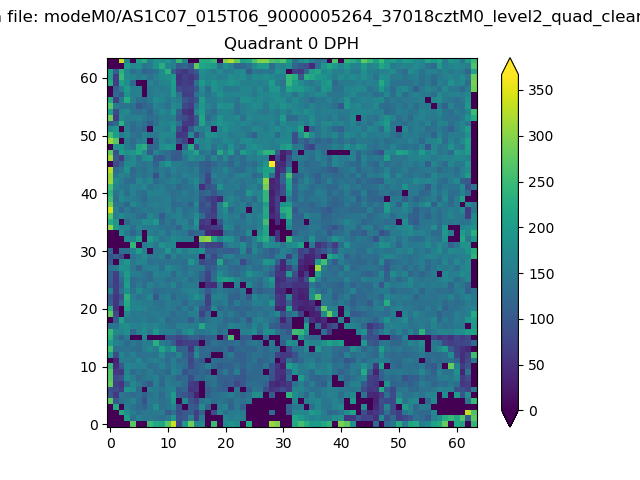 |
 |
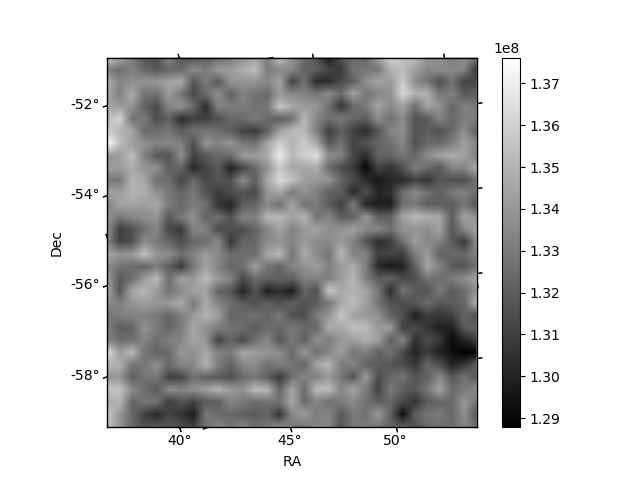
Quadrant B |
|---|---|---|---|
| Quadrant D | 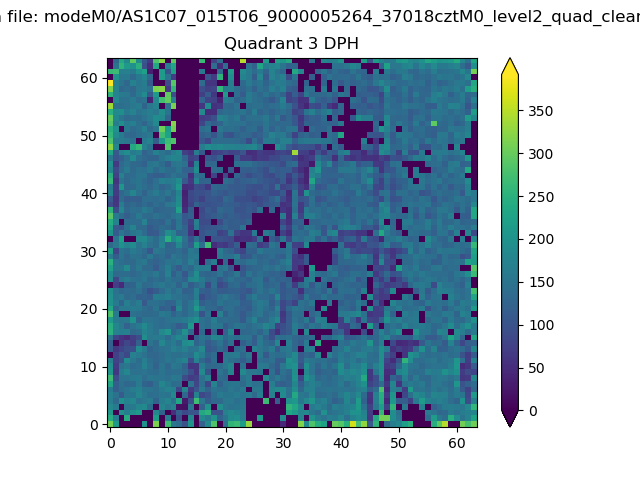 |
 |
Quadrant C |
| Plot type | Count rate plots | Images |
|---|---|---|
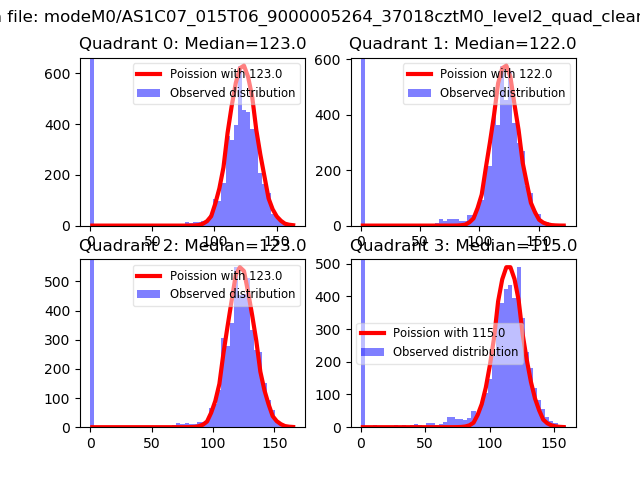
| Comparison with Poisson distribution Blue bars denote a histogram of data divided into 1 sec bins. Red curve is a Poisson curve with rate = median count rate of data. |
 |
 |
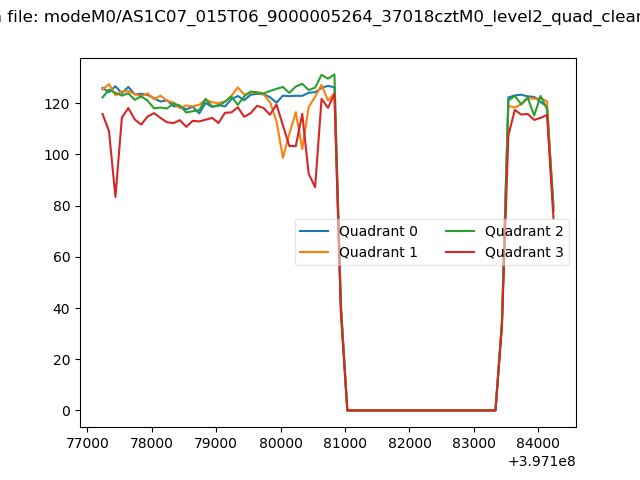
| Quadrant-wise count rates Data is divided into 100 sec bins |
 |
|
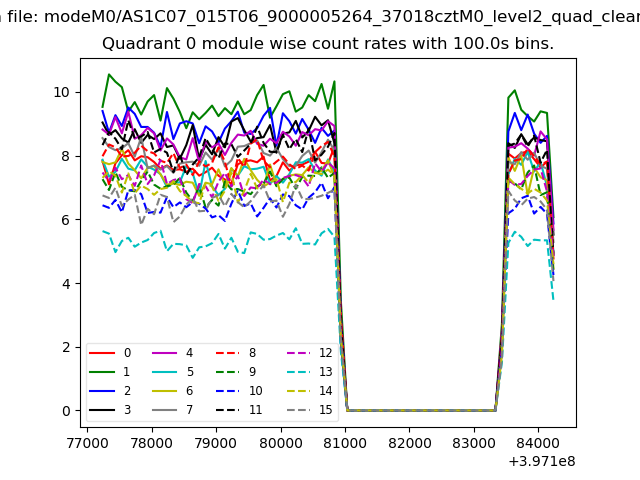
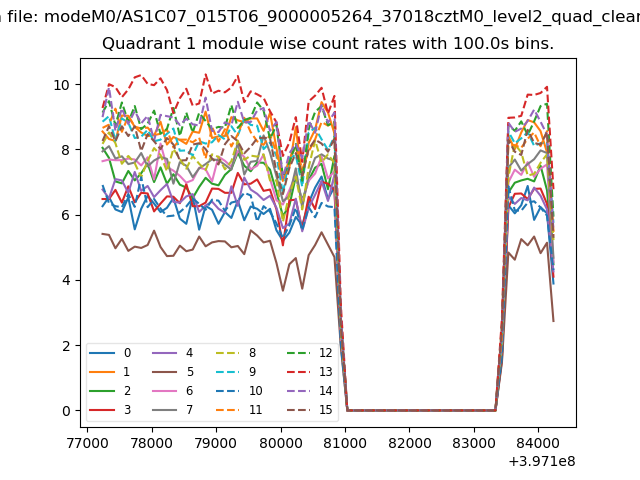
| Module-wise count rates for Quadrant A Data is divided into 100 sec bins |
 |
 |
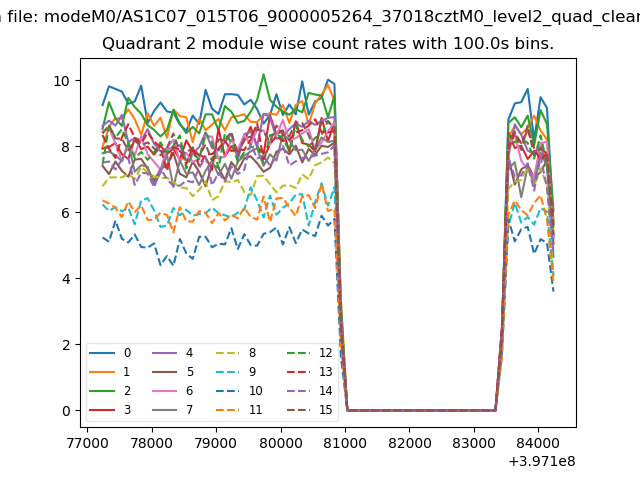
| Module-wise count rates for Quadrant B Data is divided into 100 sec bins |
 |
 |
| Module-wise count rates for Quadrant C Data is divided into 100 sec bins |
 |
 |
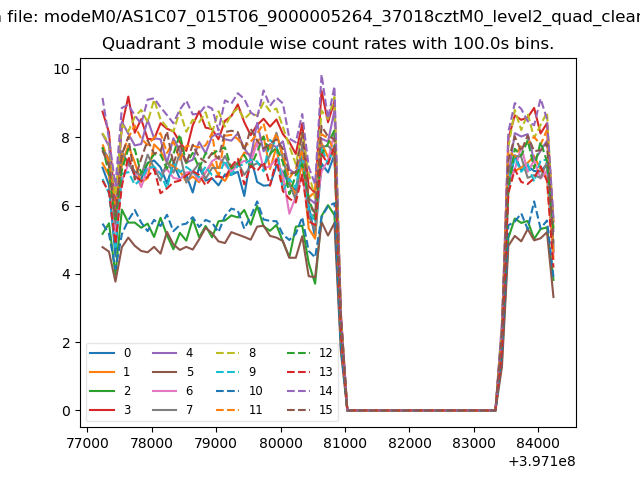
| Module-wise count rates for Quadrant D Data is divided into 100 sec bins |
 |
 |
| Parameter | Plot |
|---|---|
| CZT HV Monitor | 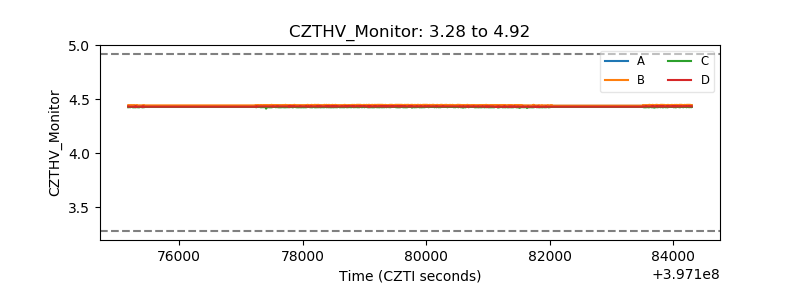 |
| D_VDD | 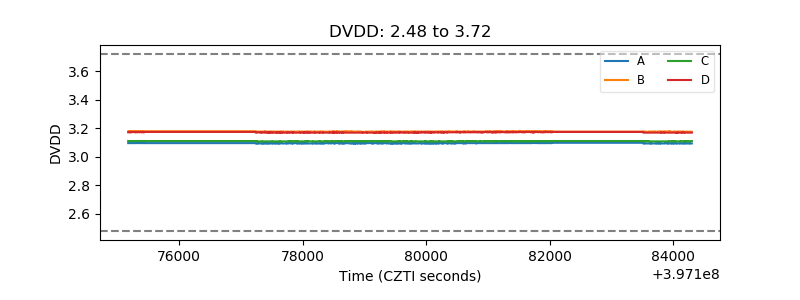 |
| Temperature 1 | 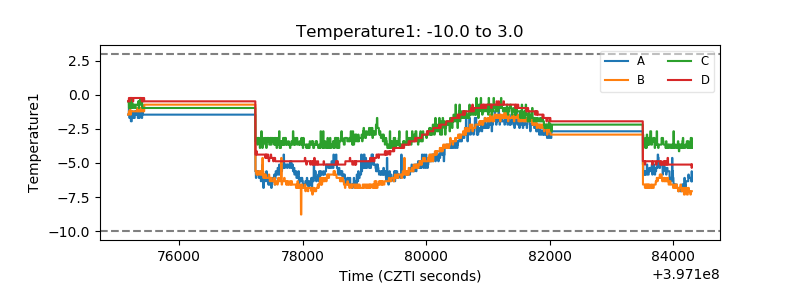 |
| Veto HV Monitor | 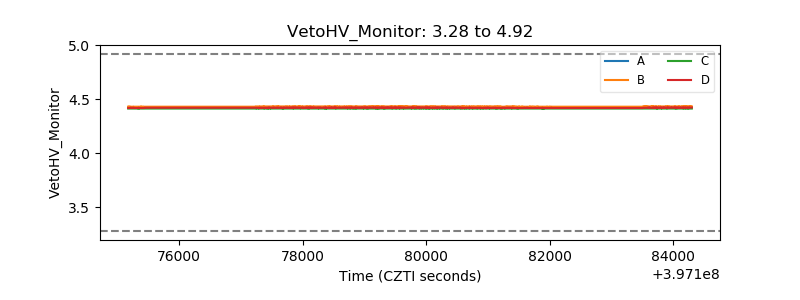 |
| Veto LLD |  |
| Alpha Counter | 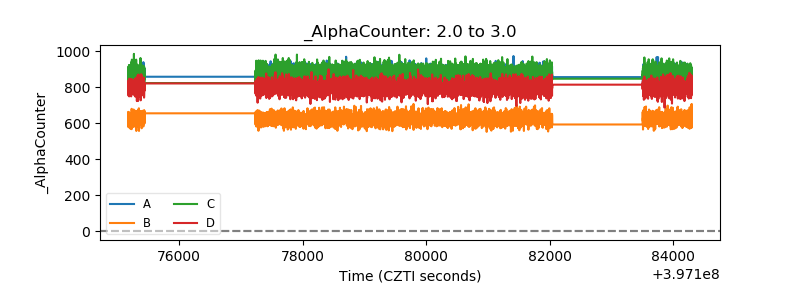 |
| _CPM_Rate | 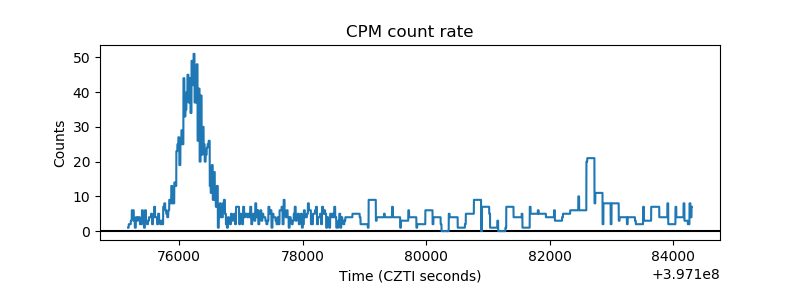 |
| CZT Counter | 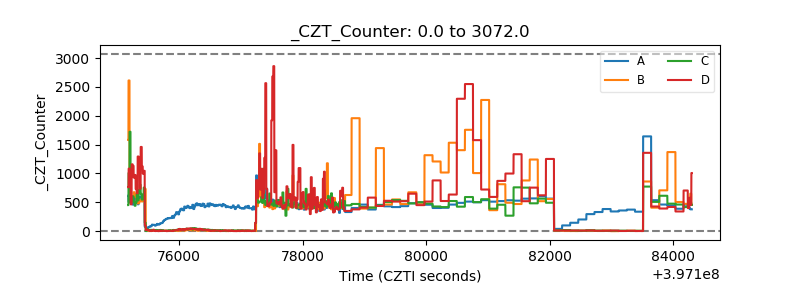 |
| +2.5 Volts monitor | 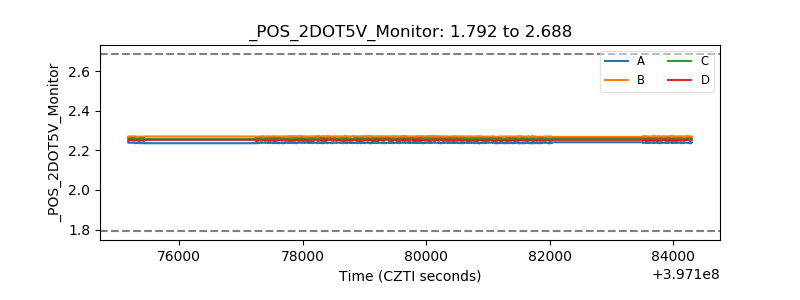 |
| +5 Volts monitor | 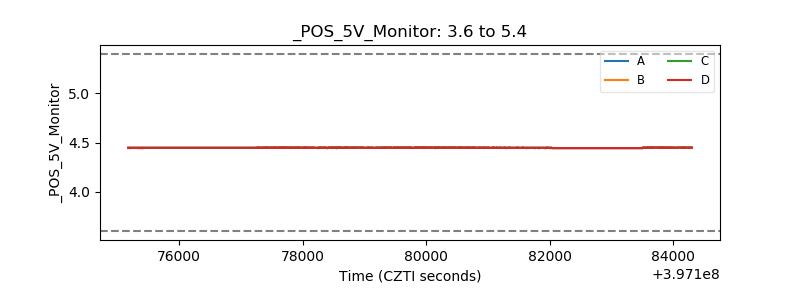 |
| _ROLL_ROT | 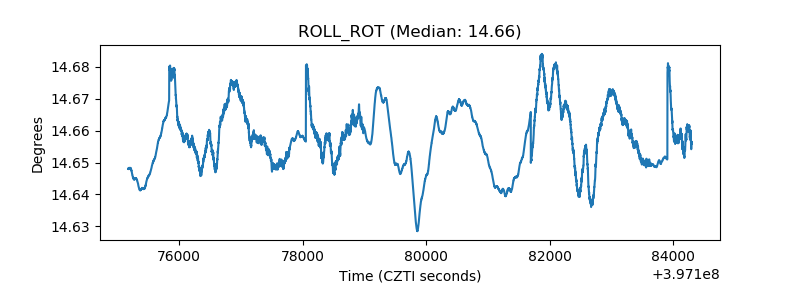 |
| _Roll_DEC | 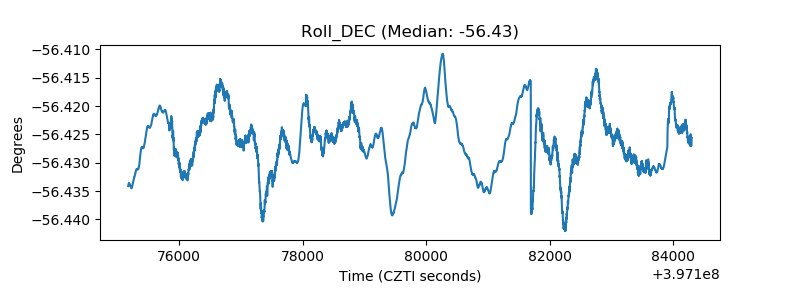 |
| _Roll_RA | 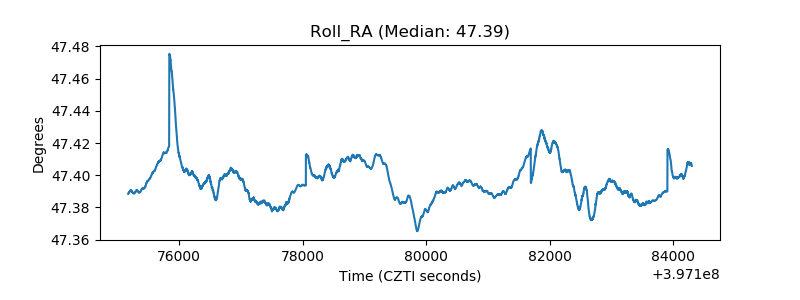 |
| Veto Counter | 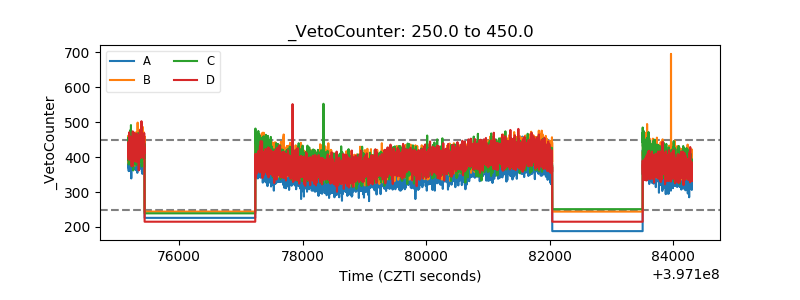 |