| Param | Original file | Final file |
|---|---|---|
| Filename | modeM0/AS1C07_015T06_9000005264_37023cztM0_level2.evt | modeM0/AS1C07_015T06_9000005264_37023cztM0_level2_quad_clean.evt |
| Size (bytes) | 760,714,560 | 132,811,200 |
| Size | 725.5 MB | 126.7 MB |
| Events in quadrant A | 4,950,052 | 836,531 |
| Events in quadrant B | 5,753,038 | 833,169 |
| Events in quadrant C | 5,424,380 | 844,411 |
| Events in quadrant D | 6,215,497 | 797,683 |
| Mode M9 | |||
|---|---|---|---|
| Quadrant | BADHDUFLAG | Total packets | Discarded packets |
| A | 0 | 39 | 2 |
| B | 0 | 48 | 10 |
| C | 0 | 44 | 7 |
| D | 0 | 55 | 17 |
| Mode M0 | |||
|---|---|---|---|
| Quadrant | BADHDUFLAG | Total packets | Discarded packets |
| A | 0 | 27315 | 6159 |
| B | 0 | 31246 | 7273 |
| C | 0 | 29362 | 7129 |
| D | 0 | 35786 | 10388 |
| Mode SS | |||
|---|---|---|---|
| Quadrant | BADHDUFLAG | Total packets | Discarded packets |
| A | 0 | 280 | 48 |
| B | 0 | 273 | 54 |
| C | 0 | 274 | 57 |
| D | 0 | 271 | 52 |
| Quadrant | Total seconds | Saturated seconds | Saturation percentage |
|---|---|---|---|
| A | 10300 | 10 | 0.097087% |
| B | 10187 | 291 | 2.856582% |
| C | 10288 | 93 | 0.903966% |
| D | 10062 | 174 | 1.729278% |
Noise dominated data is calculated using 1-second bins in cleaned event files. If a bin has >2000 counts, and if more than 50% of those come from <1% of pixels, then it is considered to be noise-dominated and hence unusable.
| Quadrant | # 1 sec bins | Bins with >0 counts | Bins with >2000 counts | High rate bins dominated by noise | Noise dominated (total time) | Noise dominated (detector-on time) | Marked lightcurve |
|---|---|---|---|---|---|---|---|
| A | 22826 | 10953 | 0 | 0 | 0.00% | 0.00% | 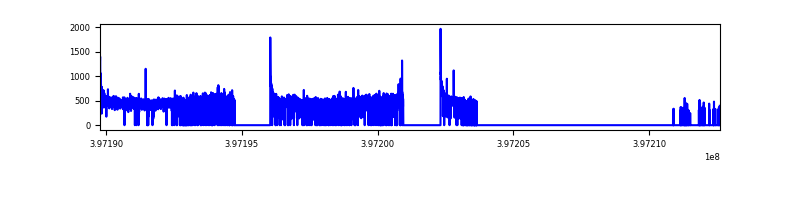 |
| B | 22831 | 10905 | 189 | 189 | 0.83% | 1.73% | 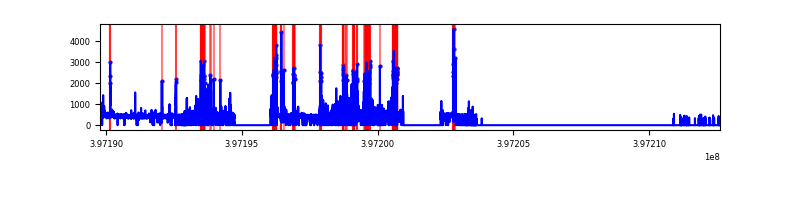 |
| C | 22832 | 10913 | 75 | 75 | 0.33% | 0.69% | 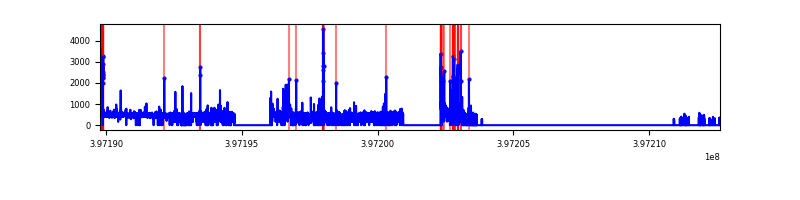 |
| D | 22812 | 10778 | 133 | 133 | 0.58% | 1.23% | 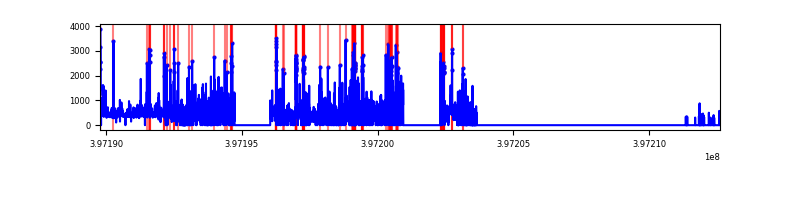 |
Top three noisy pixels from each quadrant. If the there are fewer than three noisy pixels in the level2.evt file, extra rows are filled as -1
| Pixel properties | Quadrant properties | ||||||
|---|---|---|---|---|---|---|---|
| Quadrant | DetID | PixID | Counts | Sigma | Mean | Median | Sigma |
| A | 10 | 83 | 398097 | 1693.01 | 1162 | 1136 | 234.5 |
| A | 13 | 6 | 29541 | 121.15 | 1162 | 1136 | 234.5 |
| A | 13 | 254 | 14654 | 57.65 | 1162 | 1136 | 234.5 |
| B | 5 | 184 | 864472 | 3975.7 | 1129 | 1098 | 217.2 |
| B | 5 | 172 | 128432 | 586.35 | 1129 | 1098 | 217.2 |
| B | 5 | 255 | 88910 | 404.36 | 1129 | 1098 | 217.2 |
| C | 15 | 214 | 436015 | 1649.15 | 1137 | 1147 | 263.7 |
| C | 1 | 23 | 275801 | 1041.57 | 1137 | 1147 | 263.7 |
| C | 0 | 10 | 128550 | 483.15 | 1137 | 1147 | 263.7 |
| D | 12 | 235 | 735505 | 2727.13 | 1113 | 1083 | 269.3 |
| D | 2 | 153 | 309055 | 1143.59 | 1113 | 1083 | 269.3 |
| D | 2 | 250 | 250690 | 926.87 | 1113 | 1083 | 269.3 |
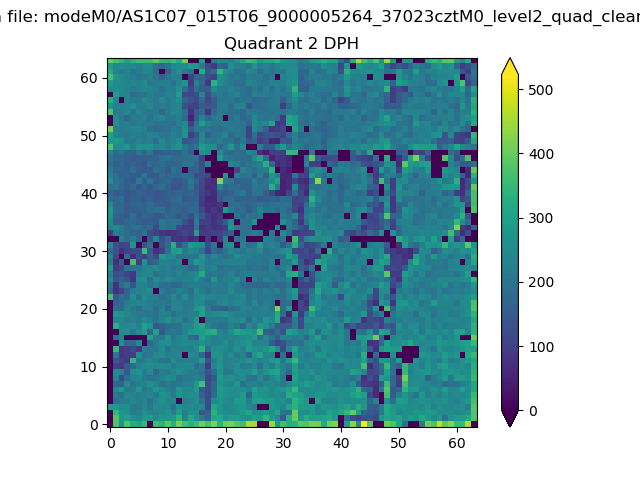
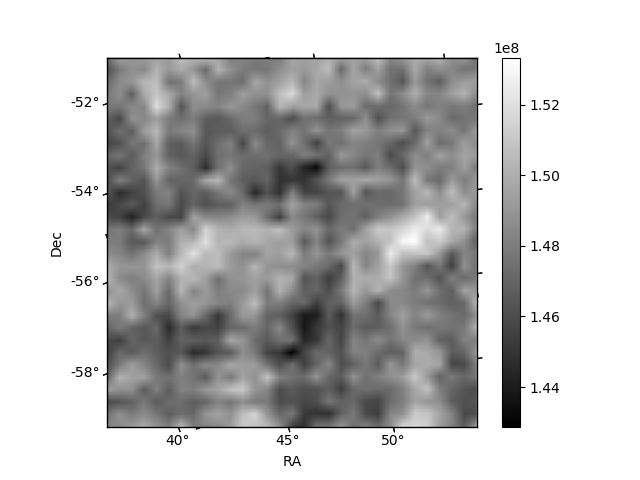
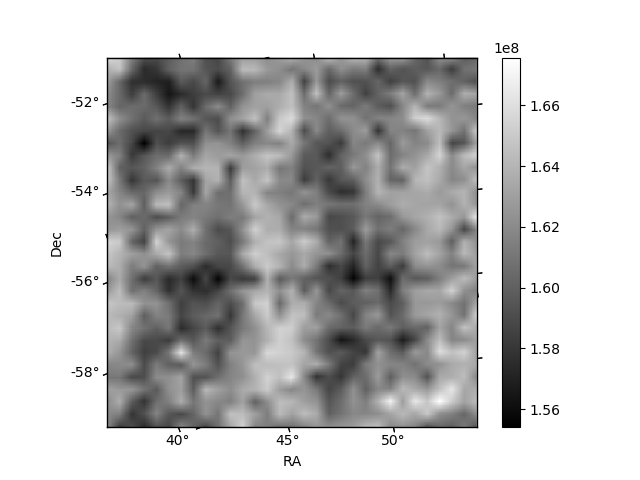
Histogram calculated using DETX and DETY for each event in the final _common_clean file
| Quadrant A | 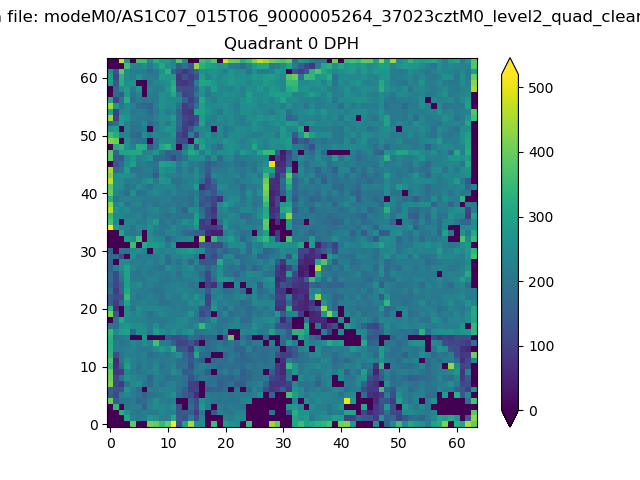 |
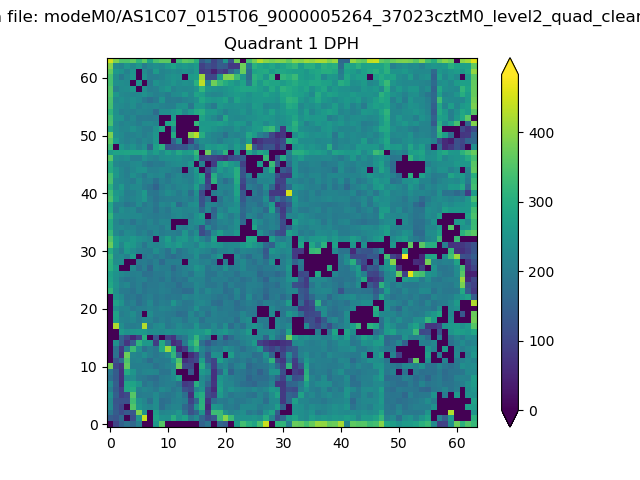 |
Quadrant B |
|---|---|---|---|
| Quadrant D | 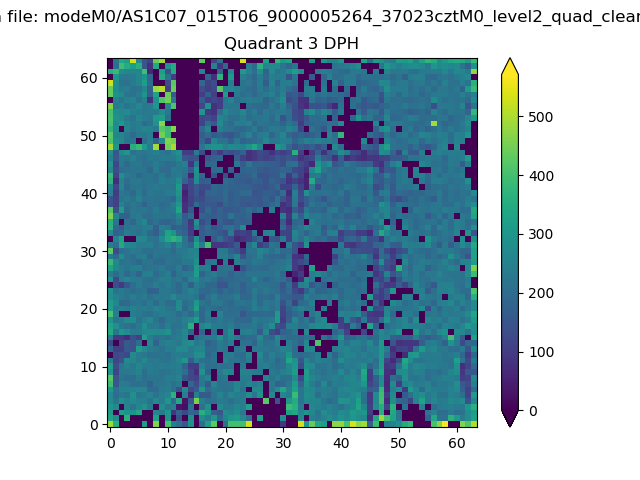 |
 |
Quadrant C |
| Plot type | Count rate plots | Images |
|---|---|---|
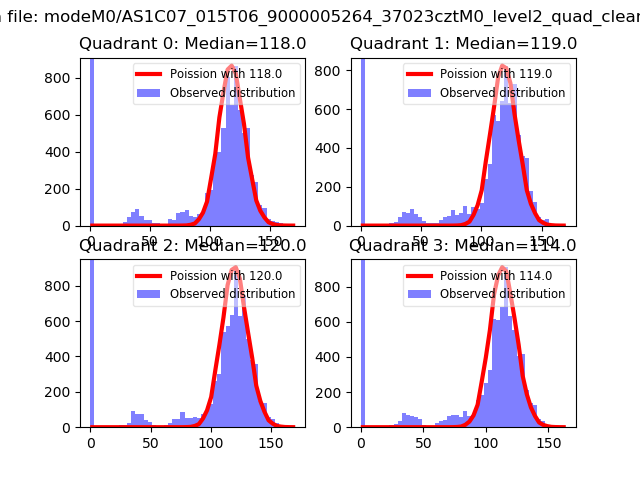
| Comparison with Poisson distribution Blue bars denote a histogram of data divided into 1 sec bins. Red curve is a Poisson curve with rate = median count rate of data. |
 |
 |
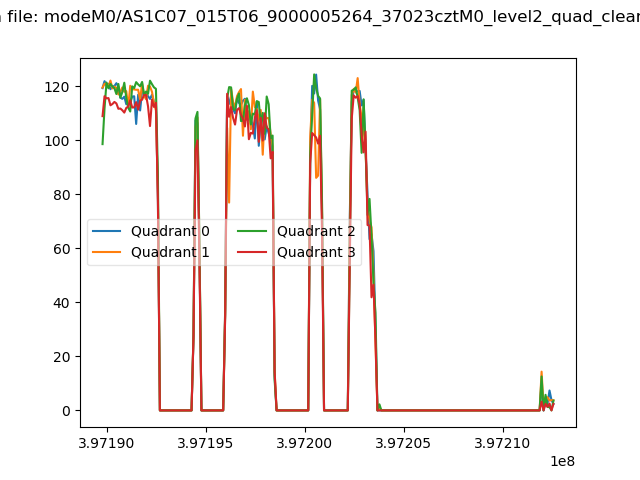
| Quadrant-wise count rates Data is divided into 100 sec bins |
 |
|
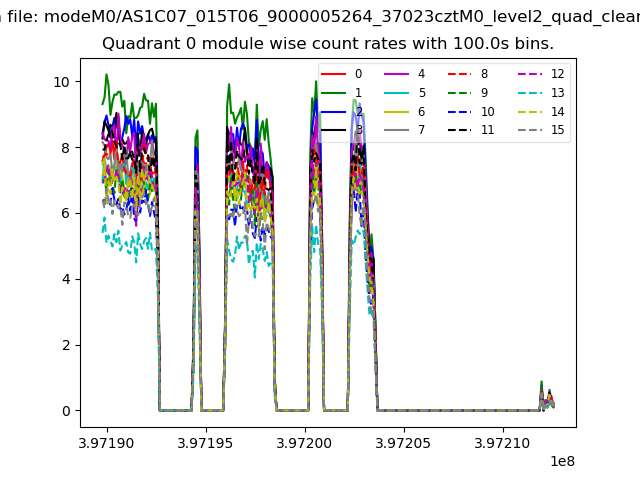
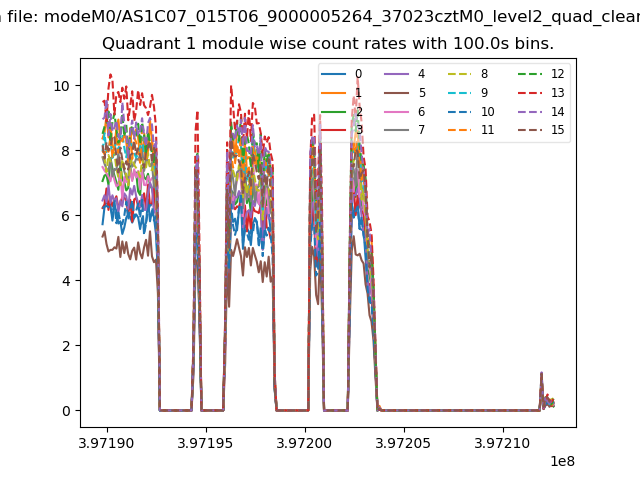
| Module-wise count rates for Quadrant A Data is divided into 100 sec bins |
 |
 |
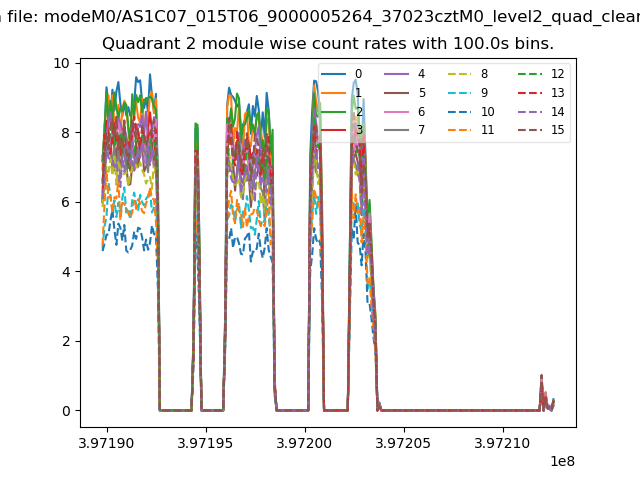
| Module-wise count rates for Quadrant B Data is divided into 100 sec bins |
 |
 |
| Module-wise count rates for Quadrant C Data is divided into 100 sec bins |
 |
 |
| Module-wise count rates for Quadrant D Data is divided into 100 sec bins |
 |
 |
| Parameter | Plot |
|---|---|
| CZT HV Monitor | 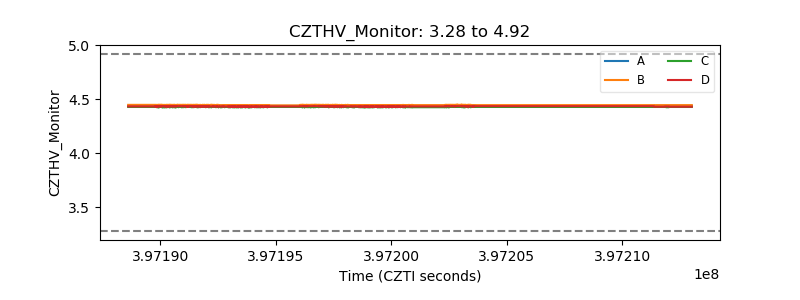 |
| D_VDD | 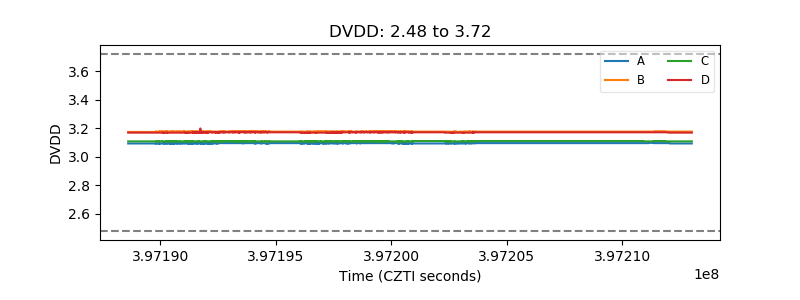 |
| Temperature 1 | 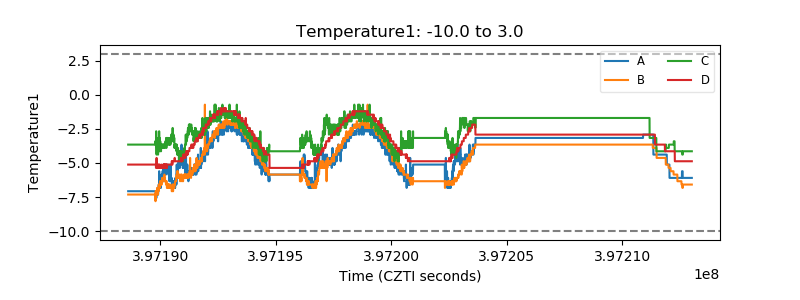 |
| Veto HV Monitor | 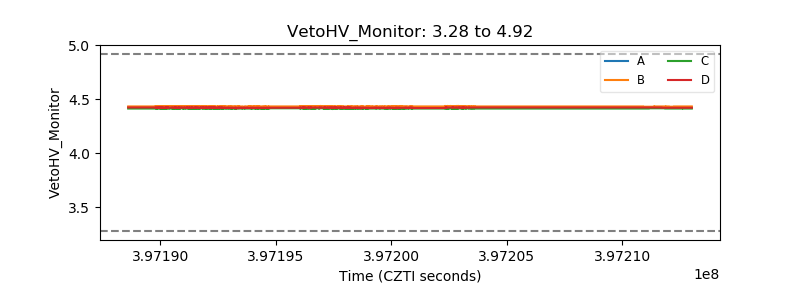 |
| Veto LLD | 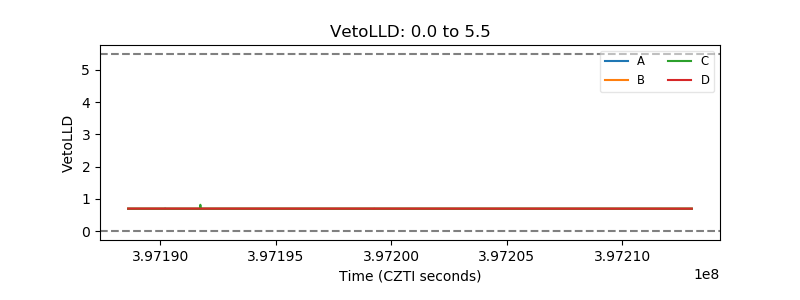 |
| Alpha Counter | 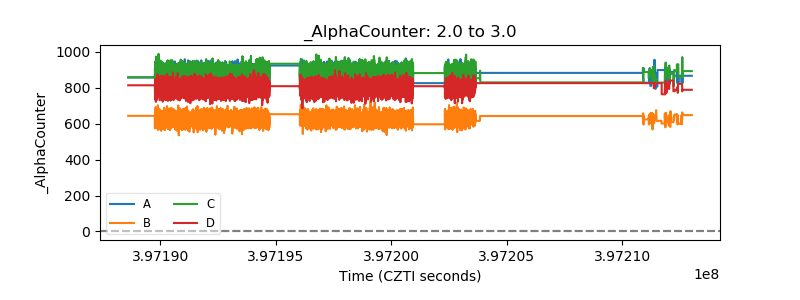 |
| _CPM_Rate | 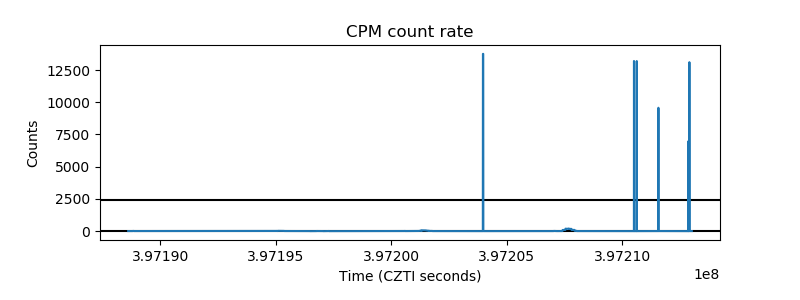 |
| CZT Counter | 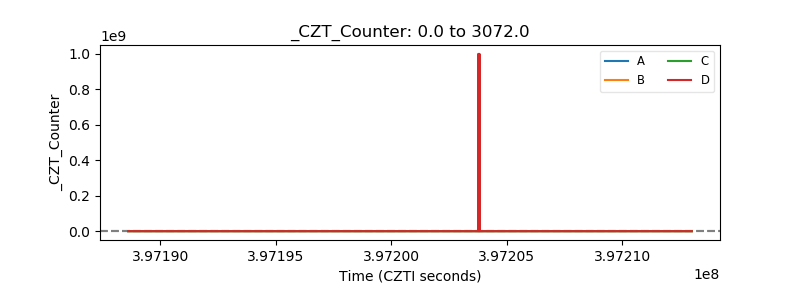 |
| +2.5 Volts monitor | 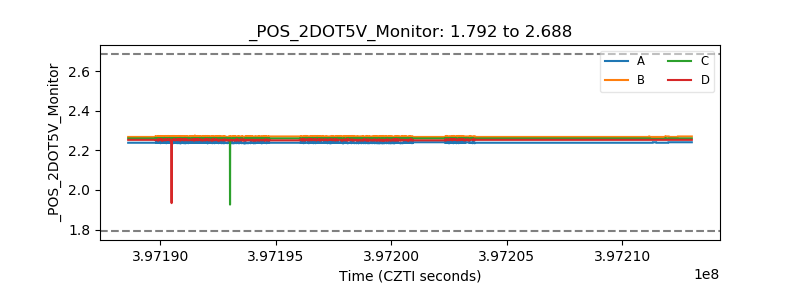 |
| +5 Volts monitor | 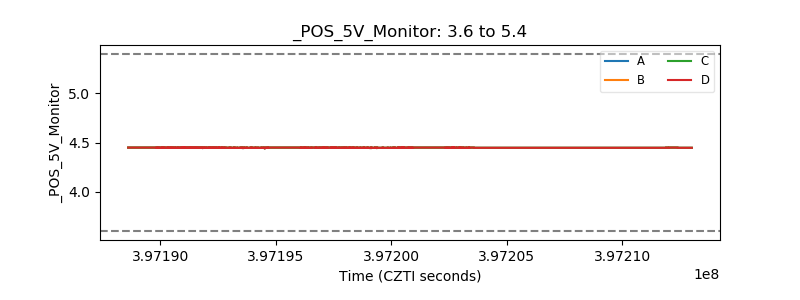 |
| _ROLL_ROT | 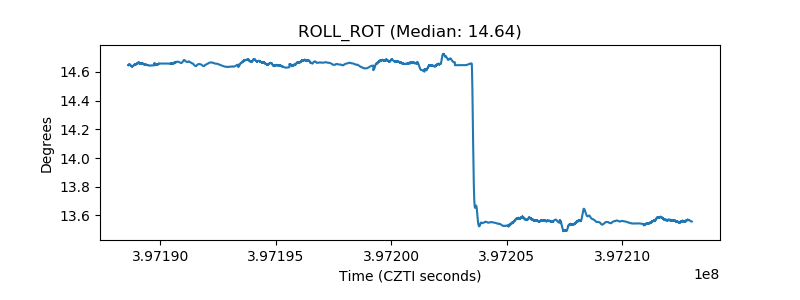 |
| _Roll_DEC | 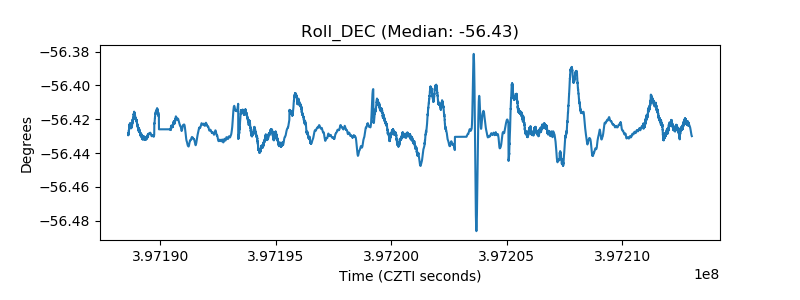 |
| _Roll_RA | 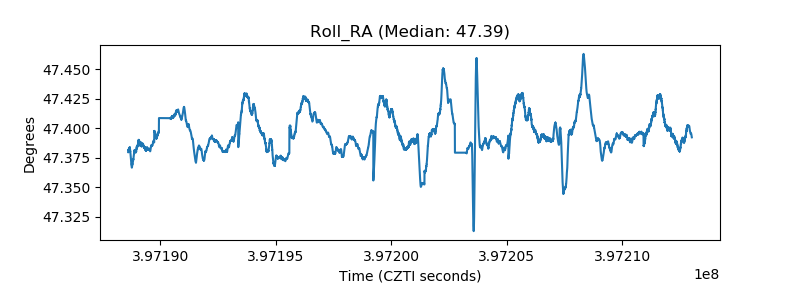 |
| Veto Counter | 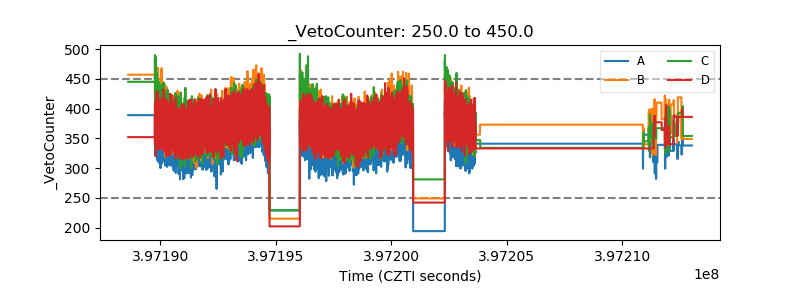 |