| Param | Original file | Final file |
|---|---|---|
| Filename | modeM0/AS1C07_015T06_9000005264_37025cztM0_level2.evt | modeM0/AS1C07_015T06_9000005264_37025cztM0_level2_quad_clean.evt |
| Size (bytes) | 1,421,524,800 | 217,722,240 |
| Size | 1.3 GB | 207.6 MB |
| Events in quadrant A | 8,720,588 | 1,339,134 |
| Events in quadrant B | 10,194,908 | 1,342,259 |
| Events in quadrant C | 9,695,386 | 1,357,764 |
| Events in quadrant D | 13,199,594 | 1,287,800 |
| Mode M9 | |||
|---|---|---|---|
| Quadrant | BADHDUFLAG | Total packets | Discarded packets |
| A | 0 | 41 | 0 |
| B | 0 | 41 | 0 |
| C | 0 | 41 | 0 |
| D | 0 | 41 | 0 |
| Mode M0 | |||
|---|---|---|---|
| Quadrant | BADHDUFLAG | Total packets | Discarded packets |
| A | 0 | 37469 | 3 |
| B | 0 | 42555 | 3 |
| C | 0 | 39919 | 3 |
| D | 0 | 51856 | 3 |
| Mode SS | |||
|---|---|---|---|
| Quadrant | BADHDUFLAG | Total packets | Discarded packets |
| A | 0 | 374 | 0 |
| B | 0 | 374 | 0 |
| C | 0 | 374 | 0 |
| D | 0 | 374 | 0 |
| Quadrant | Total seconds | Saturated seconds | Saturation percentage |
|---|---|---|---|
| A | 18384 | 17 | 0.092472% |
| B | 18384 | 461 | 2.507615% |
| C | 18384 | 147 | 0.799608% |
| D | 18384 | 451 | 2.453220% |
Noise dominated data is calculated using 1-second bins in cleaned event files. If a bin has >2000 counts, and if more than 50% of those come from <1% of pixels, then it is considered to be noise-dominated and hence unusable.
| Quadrant | # 1 sec bins | Bins with >0 counts | Bins with >2000 counts | High rate bins dominated by noise | Noise dominated (total time) | Noise dominated (detector-on time) | Marked lightcurve |
|---|---|---|---|---|---|---|---|
| A | 22564 | 18387 | 1 | 1 | 0.00% | 0.01% | 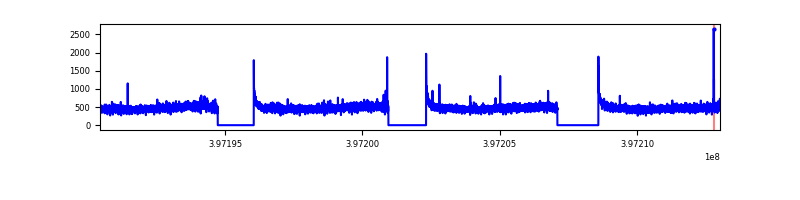 |
| B | 22564 | 18387 | 315 | 315 | 1.40% | 1.71% | 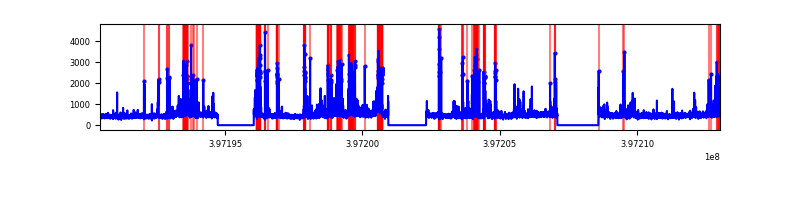 |
| C | 22564 | 18387 | 130 | 130 | 0.58% | 0.71% | 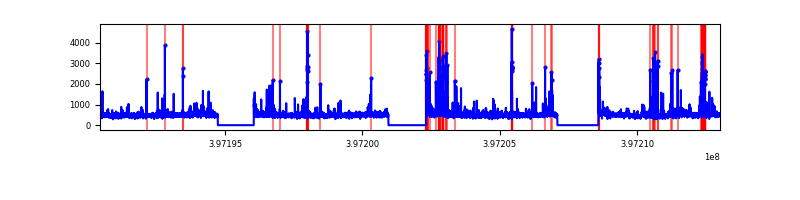 |
| D | 22564 | 18387 | 421 | 421 | 1.87% | 2.29% | 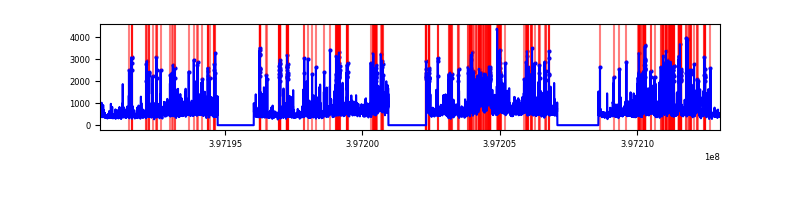 |
Top three noisy pixels from each quadrant. If the there are fewer than three noisy pixels in the level2.evt file, extra rows are filled as -1
| Pixel properties | Quadrant properties | ||||||
|---|---|---|---|---|---|---|---|
| Quadrant | DetID | PixID | Counts | Sigma | Mean | Median | Sigma |
| A | 10 | 83 | 597063 | 1429.22 | 2078 | 2033 | 416.3 |
| A | 13 | 6 | 46507 | 106.82 | 2078 | 2033 | 416.3 |
| A | 9 | 143 | 26374 | 58.47 | 2078 | 2033 | 416.3 |
| B | 5 | 184 | 1349618 | 3491.11 | 2038 | 1984 | 386.0 |
| B | 5 | 172 | 290694 | 747.92 | 2038 | 1984 | 386.0 |
| B | 5 | 255 | 130576 | 333.12 | 2038 | 1984 | 386.0 |
| C | 15 | 214 | 769139 | 1647.0 | 2021 | 2036 | 465.8 |
| C | 1 | 23 | 478367 | 1022.7 | 2021 | 2036 | 465.8 |
| C | 0 | 207 | 259672 | 553.16 | 2021 | 2036 | 465.8 |
| D | 12 | 235 | 2576434 | 5267.69 | 2023 | 1967 | 488.7 |
| D | 2 | 153 | 1221512 | 2495.35 | 2023 | 1967 | 488.7 |
| D | 2 | 250 | 399774 | 813.96 | 2023 | 1967 | 488.7 |
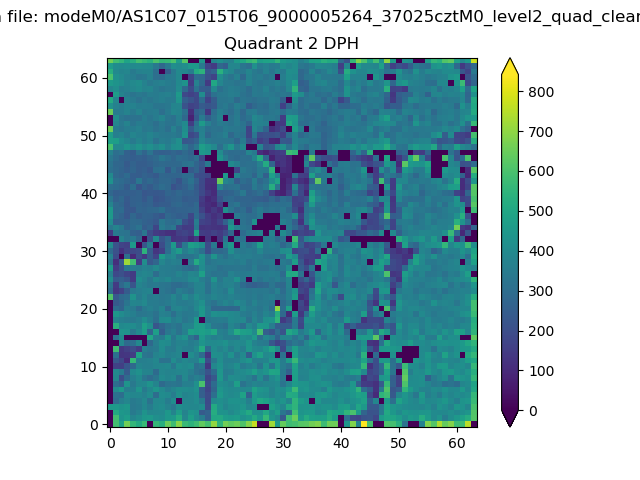
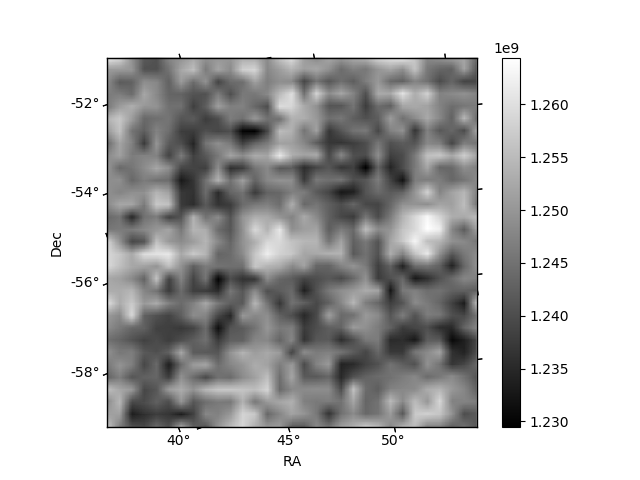
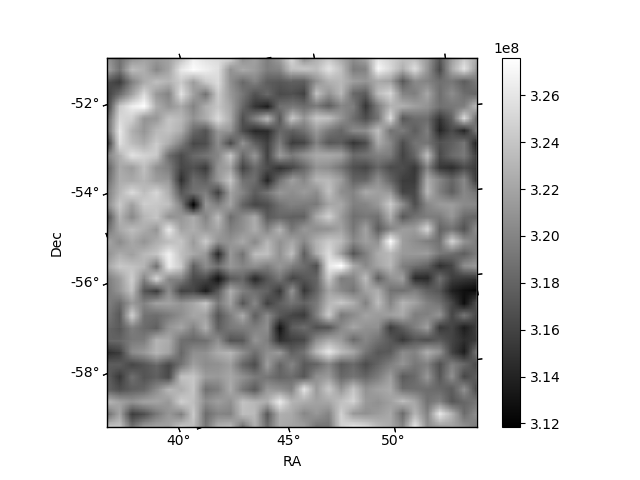
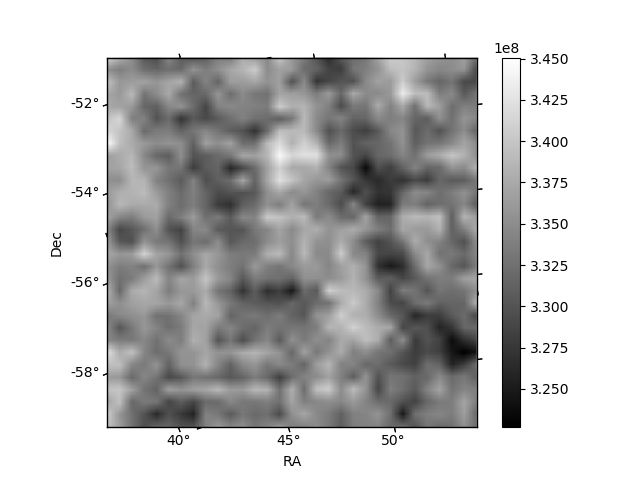
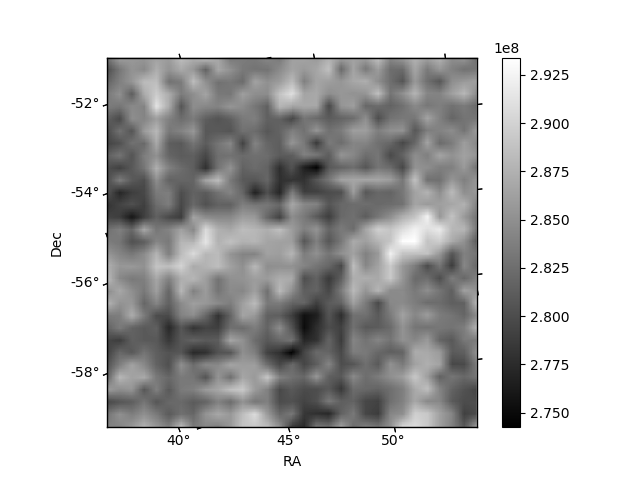
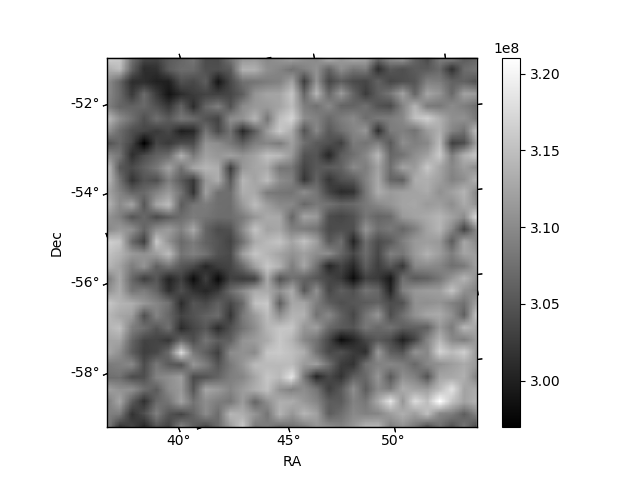
Histogram calculated using DETX and DETY for each event in the final _common_clean file
| Quadrant A | 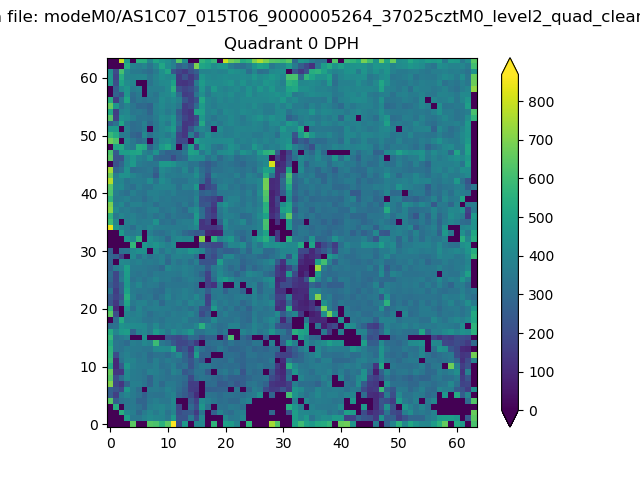 |
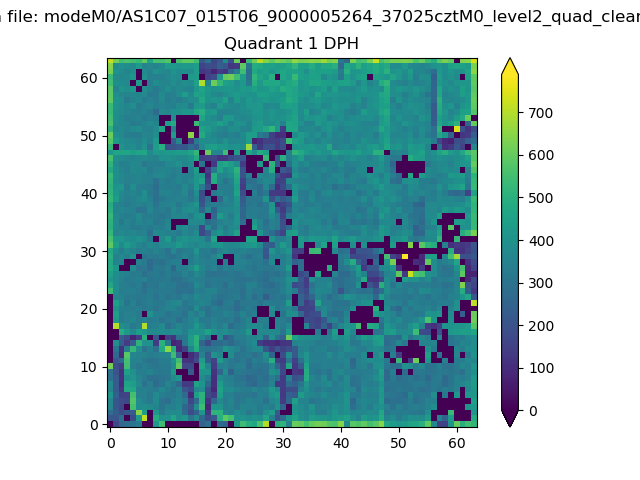 |
Quadrant B |
|---|---|---|---|
| Quadrant D | 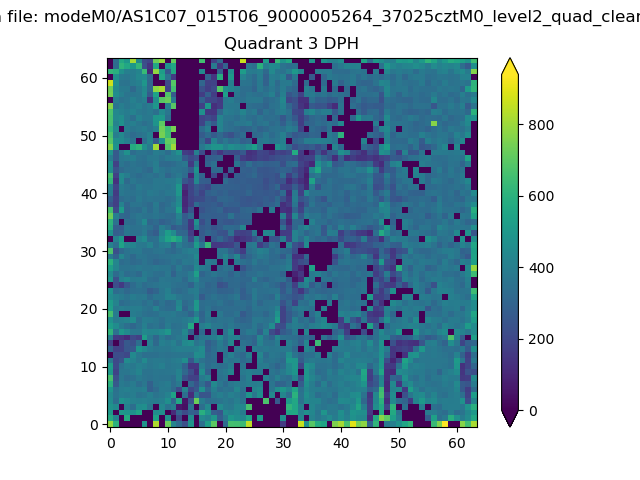 |
 |
Quadrant C |
| Plot type | Count rate plots | Images |
|---|---|---|
| Comparison with Poisson distribution Blue bars denote a histogram of data divided into 1 sec bins. Red curve is a Poisson curve with rate = median count rate of data. |
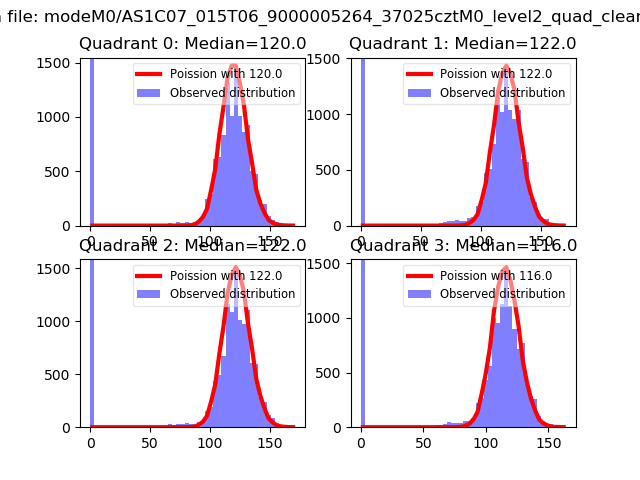 |
 |
| Quadrant-wise count rates Data is divided into 100 sec bins |
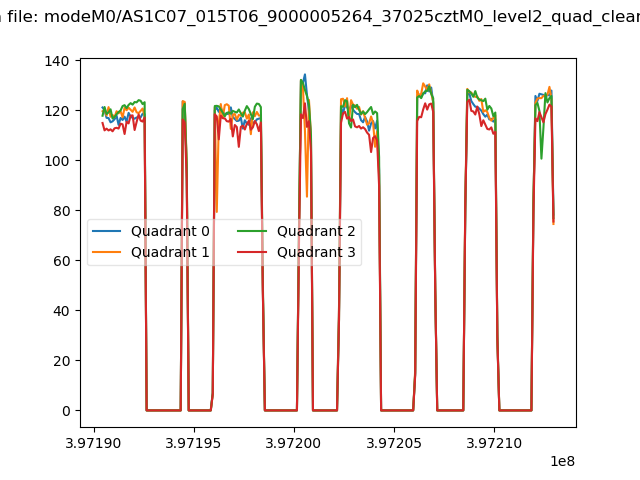 |
|
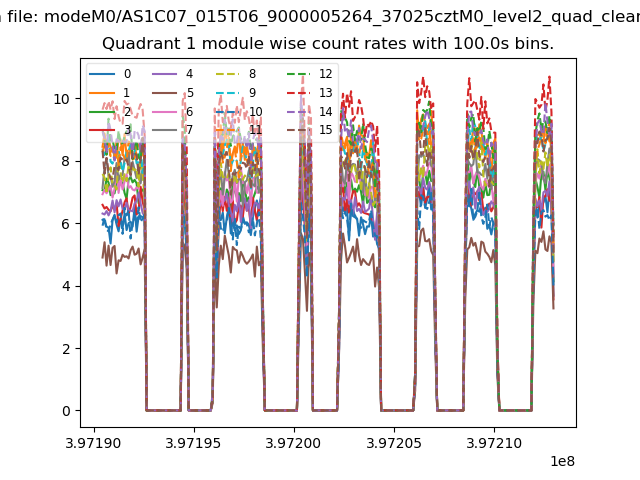
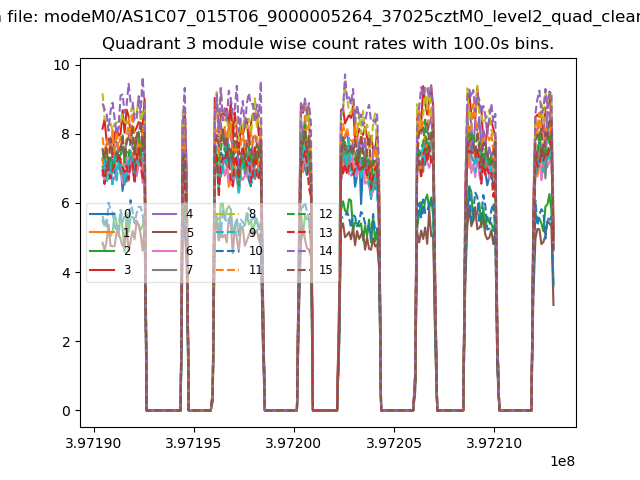
| Module-wise count rates for Quadrant A Data is divided into 100 sec bins |
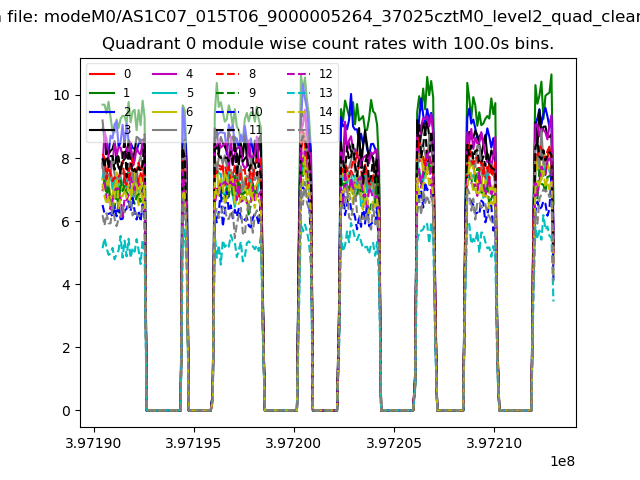 |
 |
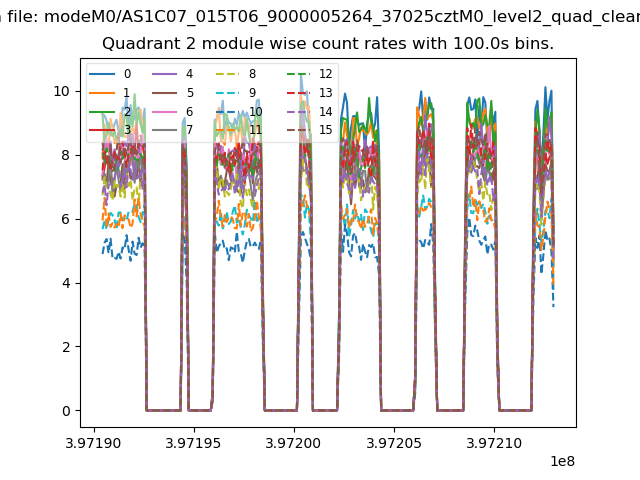
| Module-wise count rates for Quadrant B Data is divided into 100 sec bins |
 |
 |
| Module-wise count rates for Quadrant C Data is divided into 100 sec bins |
 |
 |
| Module-wise count rates for Quadrant D Data is divided into 100 sec bins |
 |
 |
| Parameter | Plot |
|---|---|
| CZT HV Monitor | 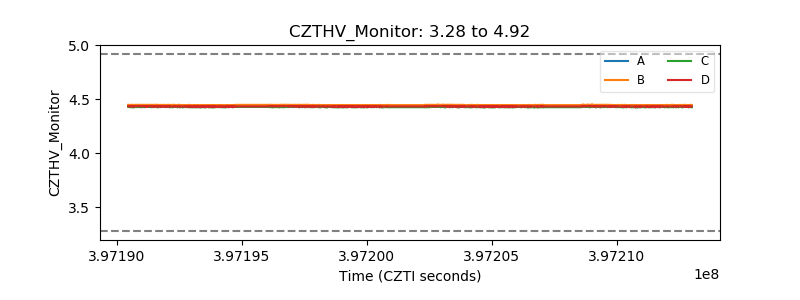 |
| D_VDD | 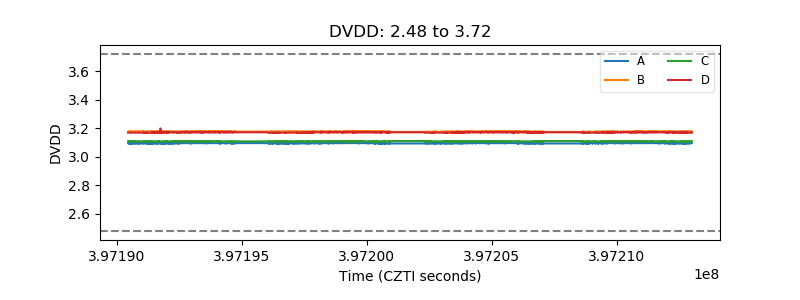 |
| Temperature 1 | 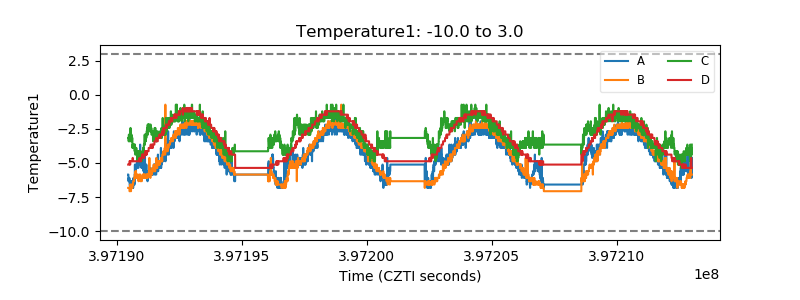 |
| Veto HV Monitor | 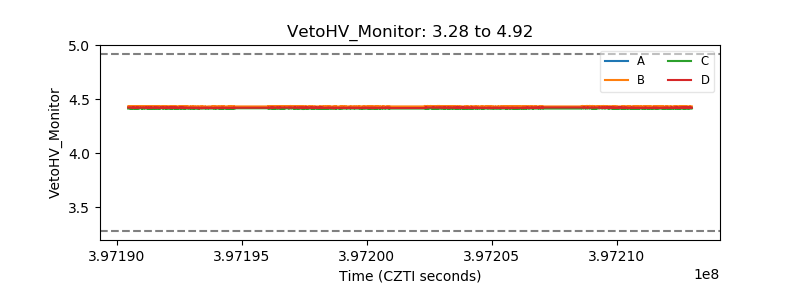 |
| Veto LLD | 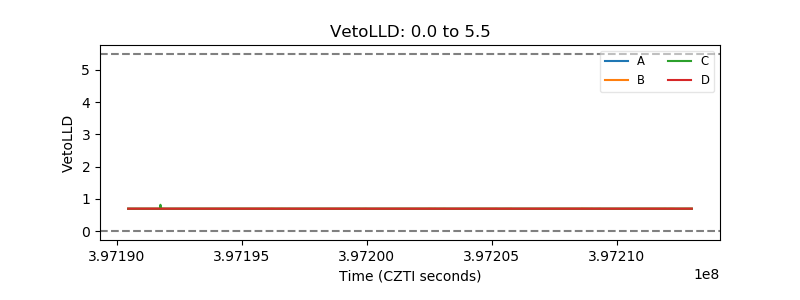 |
| Alpha Counter | 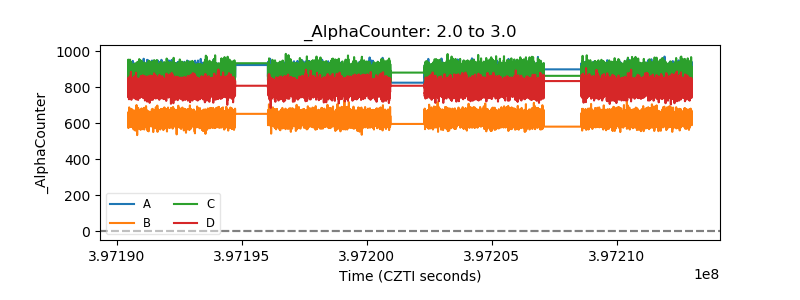 |
| _CPM_Rate | 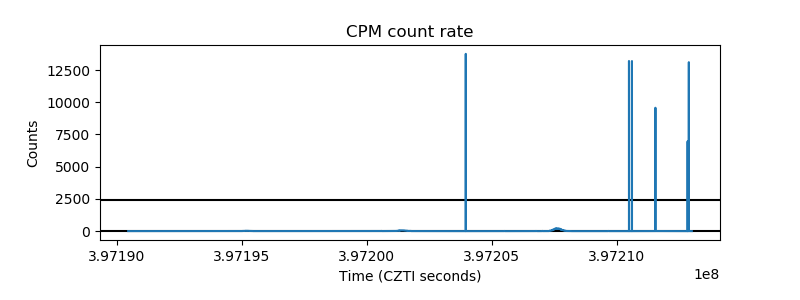 |
| CZT Counter | 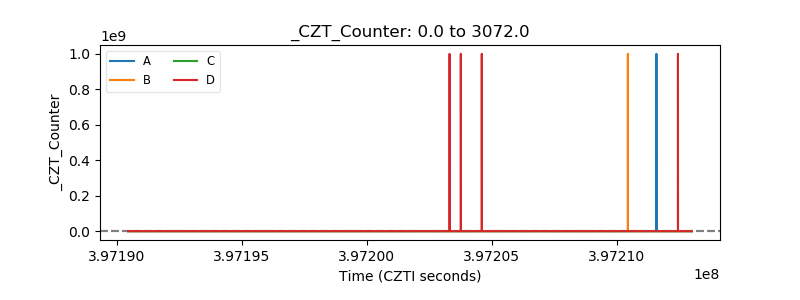 |
| +2.5 Volts monitor | 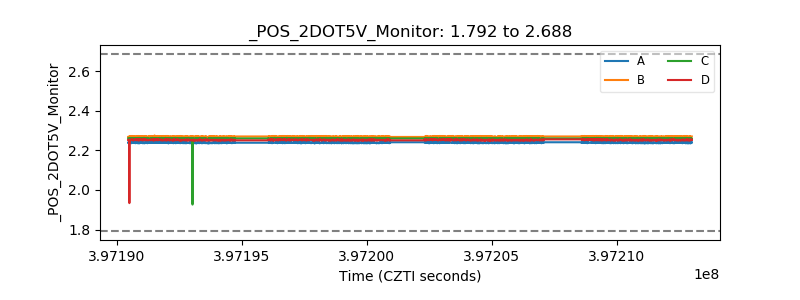 |
| +5 Volts monitor | 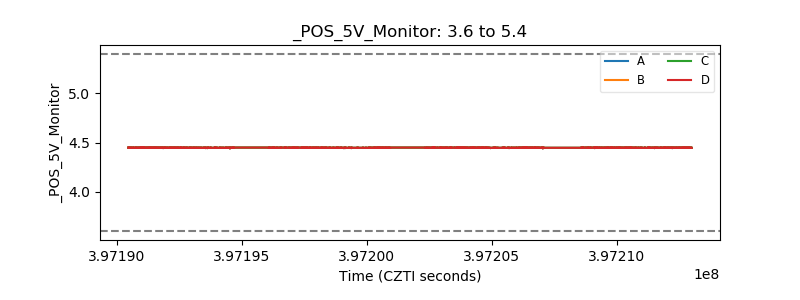 |
| _ROLL_ROT | 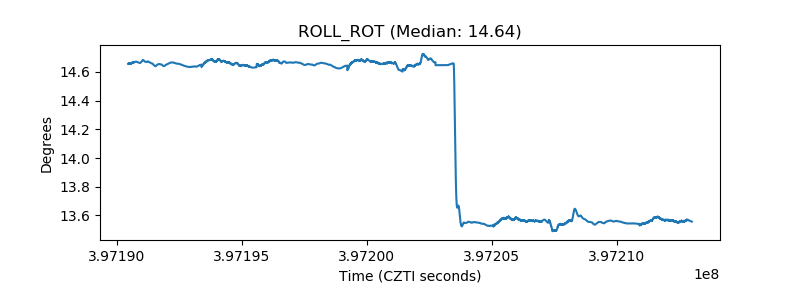 |
| _Roll_DEC | 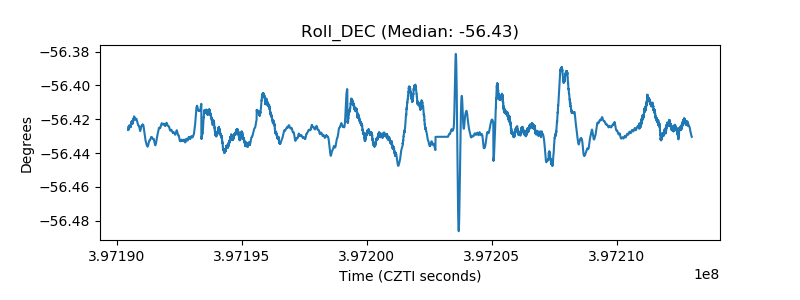 |
| _Roll_RA | 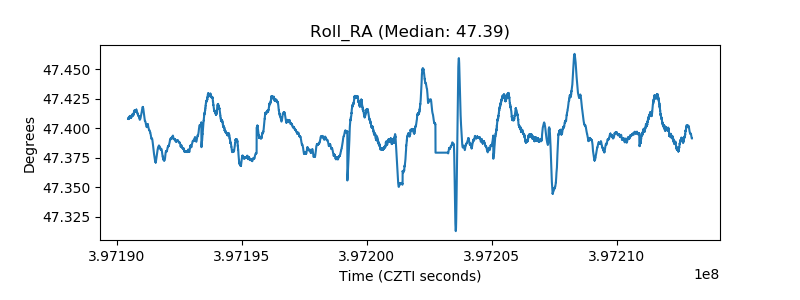 |
| Veto Counter | 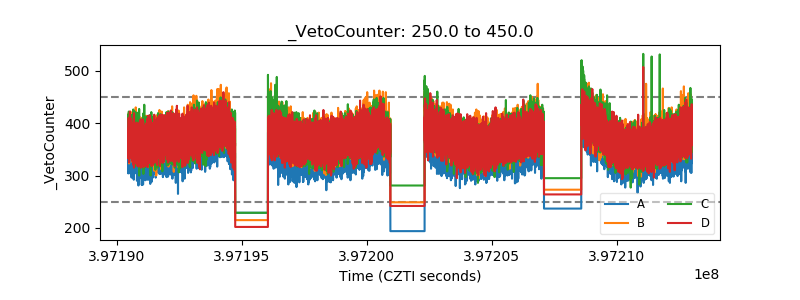 |