| Param | Original file | Final file |
|---|---|---|
| Filename | modeM0/AS1T05_046T01_9000005266cztM0_level2.fits | modeM0/AS1T05_046T01_9000005266cztM0_level2_quad_clean.evt |
| Size (bytes) | 381,214,080 | 242,452,800 |
| Size | 363.6 MB | 231.2 MB |
| Events in quadrant A | 2,378,988 | 1,233,145 |
| Events in quadrant B | 2,213,522 | 1,191,399 |
| Events in quadrant C | 2,256,122 | 1,143,863 |
| Events in quadrant D | 1,965,954 | 1,042,184 |
| Mode M0 | |||
|---|---|---|---|
| Quadrant | BADHDUFLAG | Total packets | Discarded packets |
| A | 0 | 83501 | 0 |
| B | 0 | 101725 | 0 |
| C | 0 | 97214 | 0 |
| D | 0 | 109393 | 0 |
| Mode SS | |||
|---|---|---|---|
| Quadrant | BADHDUFLAG | Total packets | Discarded packets |
| A | 0 | 810 | 0 |
| B | 0 | 812 | 0 |
| C | 0 | 812 | 0 |
| D | 0 | 812 | 0 |
| Mode M9 | |||
|---|---|---|---|
| Quadrant | BADHDUFLAG | Total packets | Discarded packets |
| A | 0 | 161 | 0 |
| B | 0 | 161 | 0 |
| C | 0 | 161 | 0 |
| D | 0 | 161 | 0 |
| Quadrant | Total seconds | Saturated seconds | Saturation percentage |
|---|---|---|---|
| A | 39766 | 76 | 0.191118% |
| B | 39760 | 1557 | 3.915996% |
| C | 39752 | 864 | 2.173476% |
| D | 39747 | 1565 | 3.937404% |
Noise dominated data is calculated using 1-second bins in cleaned event files. If a bin has >2000 counts, and if more than 50% of those come from <1% of pixels, then it is considered to be noise-dominated and hence unusable.
| Quadrant | # 1 sec bins | Bins with >0 counts | Bins with >2000 counts | High rate bins dominated by noise | Noise dominated (total time) | Noise dominated (detector-on time) | Marked lightcurve |
|---|---|---|---|---|---|---|---|
| A | 61387 | 39800 | 0 | 0 | 0.00% | 0.00% |  |
| B | 61387 | 39787 | 0 | 0 | 0.00% | 0.00% |  |
| C | 61387 | 39761 | 0 | 0 | 0.00% | 0.00% |  |
| D | 61387 | 39780 | 0 | 0 | 0.00% | 0.00% |  |
Top three noisy pixels from each quadrant. If the there are fewer than three noisy pixels in the level2.evt file, extra rows are filled as -1
| Pixel properties | Quadrant properties | ||||||
|---|---|---|---|---|---|---|---|
| Quadrant | DetID | PixID | Counts | Sigma | Mean | Median | Sigma |
| A | 9 | 19 | 1936 | 8.75 | 622 | 585 | 154.4 |
| A | 7 | 110 | 1915 | 8.61 | 622 | 585 | 154.4 |
| A | 0 | 29 | 1876 | 8.36 | 622 | 585 | 154.4 |
| B | 2 | 9 | 1934 | 11.75 | 587 | 562 | 116.8 |
| B | 3 | 80 | 1701 | 9.75 | 587 | 562 | 116.8 |
| B | 2 | 8 | 1583 | 8.74 | 587 | 562 | 116.8 |
| C | 1 | 81 | 1921 | 8.87 | 596 | 563 | 153.2 |
| C | 3 | 203 | 1798 | 8.06 | 596 | 563 | 153.2 |
| C | 3 | 202 | 1773 | 7.9 | 596 | 563 | 153.2 |
| D | 6 | 62 | 1477 | 6.35 | 562 | 514 | 151.7 |
| D | 4 | 160 | 1439 | 6.1 | 562 | 514 | 151.7 |
| D | 10 | 113 | 1419 | 5.97 | 562 | 514 | 151.7 |
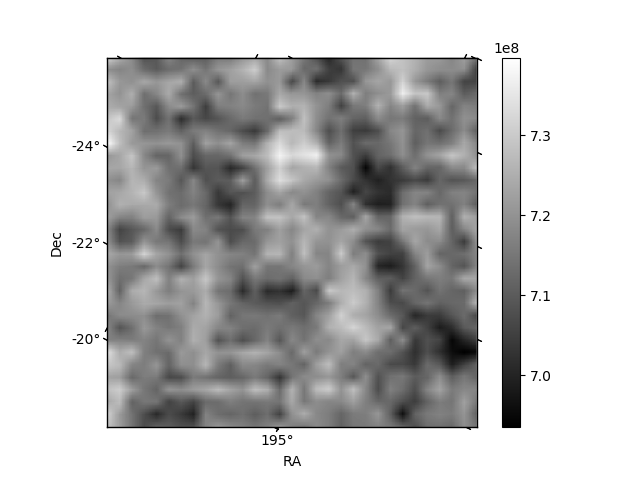
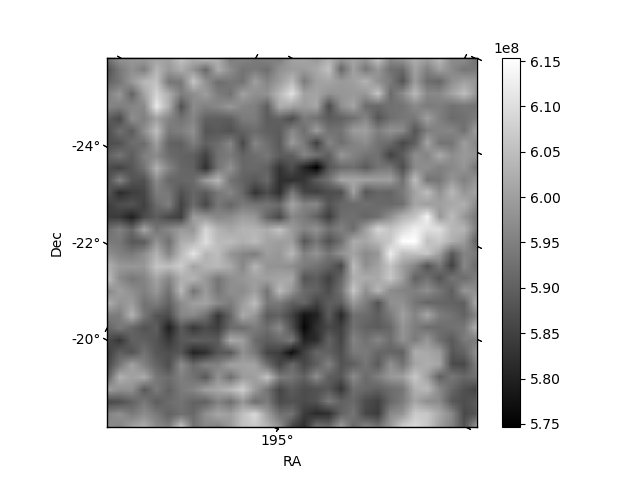
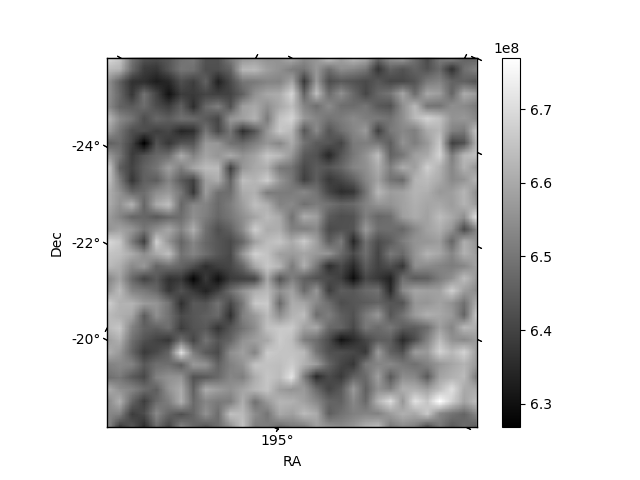
Histogram calculated using DETX and DETY for each event in the final _common_clean file
| Quadrant A | 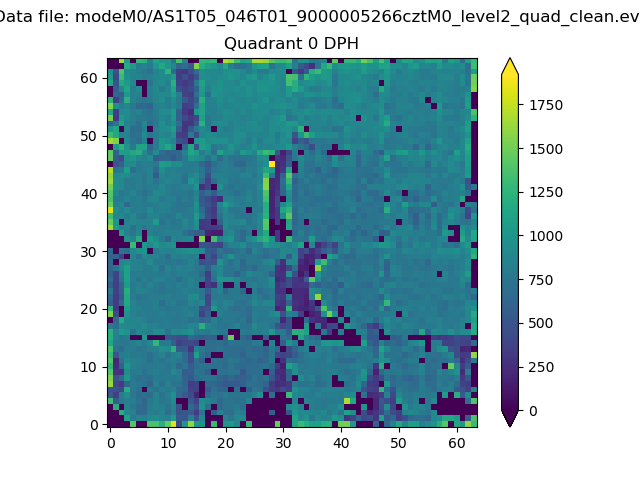 |
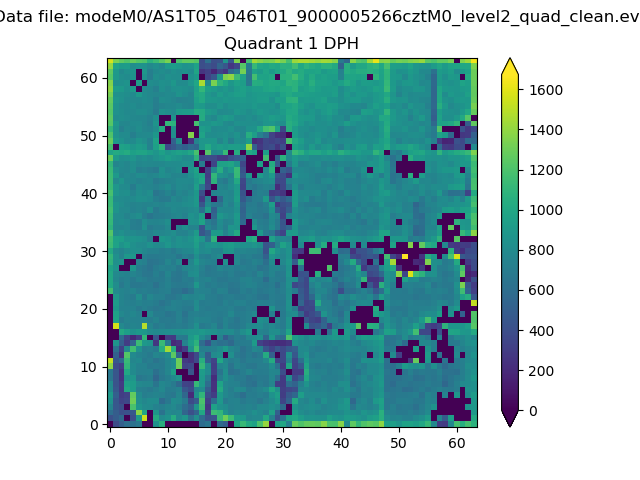 |
Quadrant B |
|---|---|---|---|
| Quadrant D | 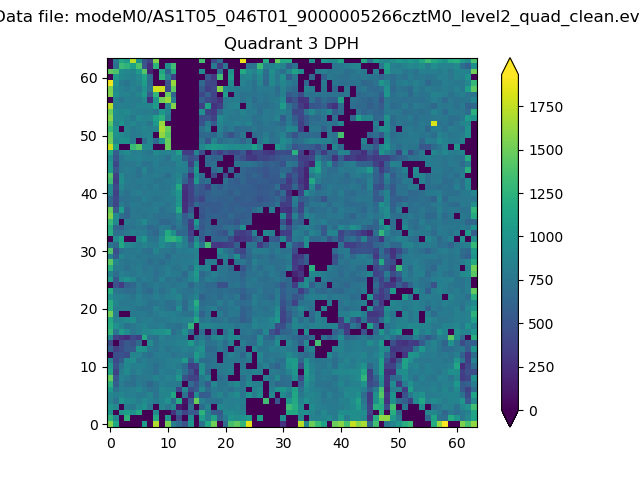 |
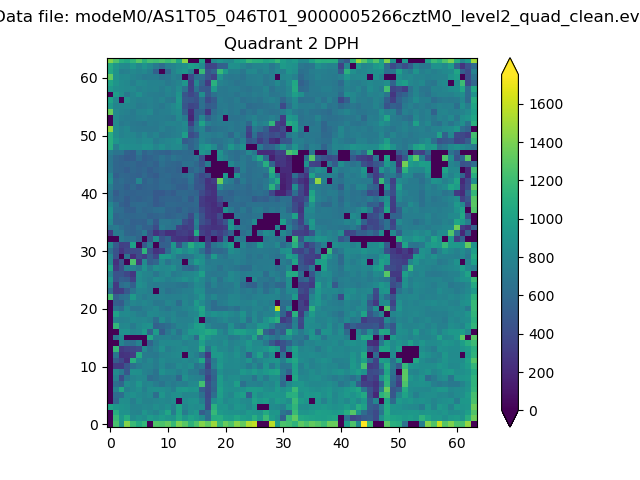 |
Quadrant C |
| Plot type | Count rate plots | Images |
|---|---|---|
| Comparison with Poisson distribution Blue bars denote a histogram of data divided into 1 sec bins. Red curve is a Poisson curve with rate = median count rate of data. |
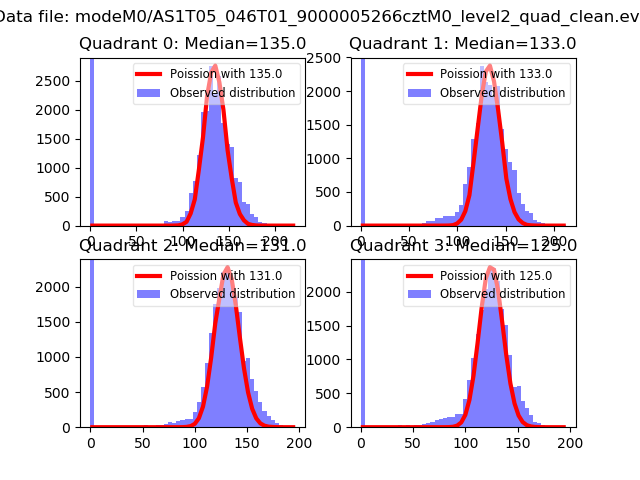 |
 |
| Quadrant-wise count rates Data is divided into 100 sec bins |
 |
|
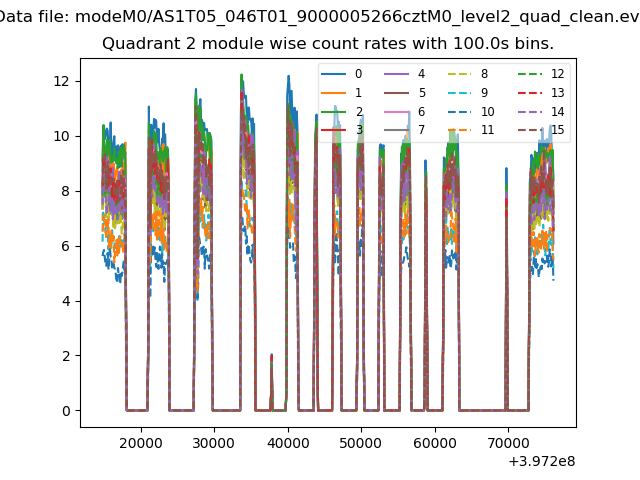
| Module-wise count rates for Quadrant A Data is divided into 100 sec bins |
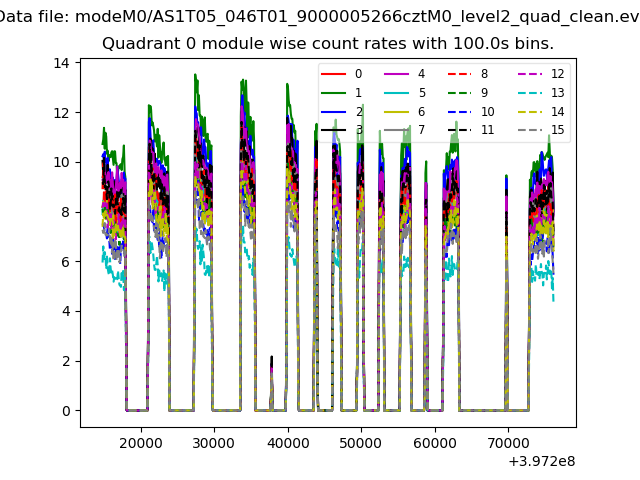 |
 |
| Module-wise count rates for Quadrant B Data is divided into 100 sec bins |
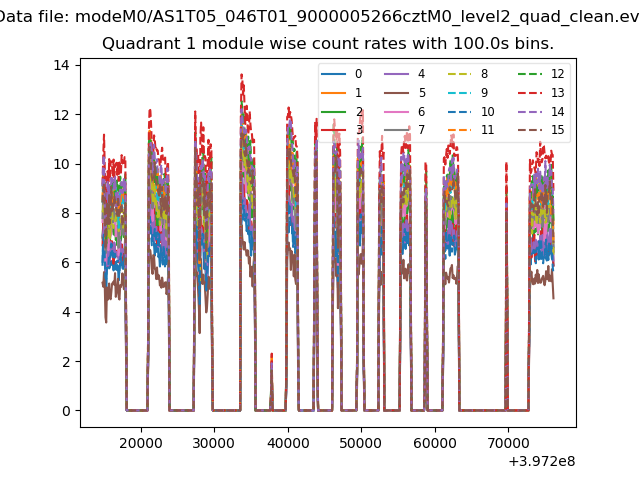 |
 |
| Module-wise count rates for Quadrant C Data is divided into 100 sec bins |
 |
 |
| Module-wise count rates for Quadrant D Data is divided into 100 sec bins |
 |
 |
| Parameter | Plot |
|---|---|
| CZT HV Monitor | 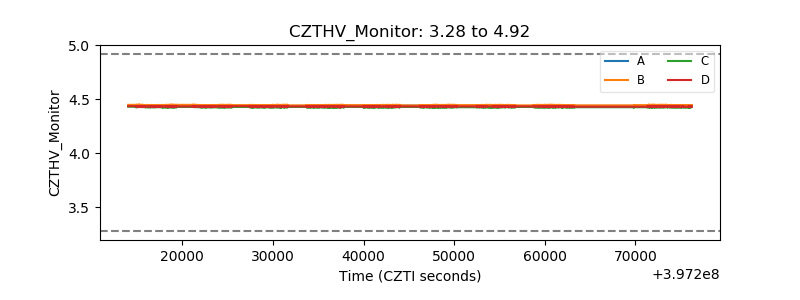 |
| D_VDD |  |
| Temperature 1 | 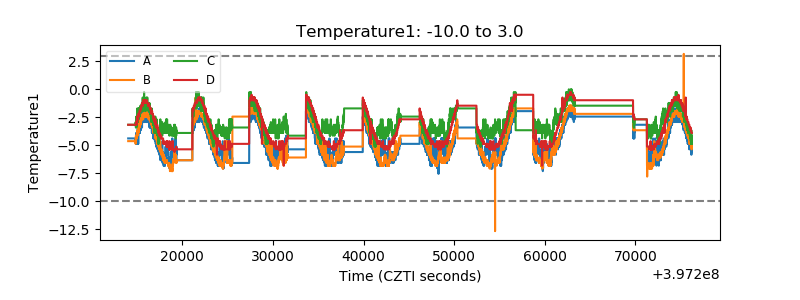 |
| Veto HV Monitor | 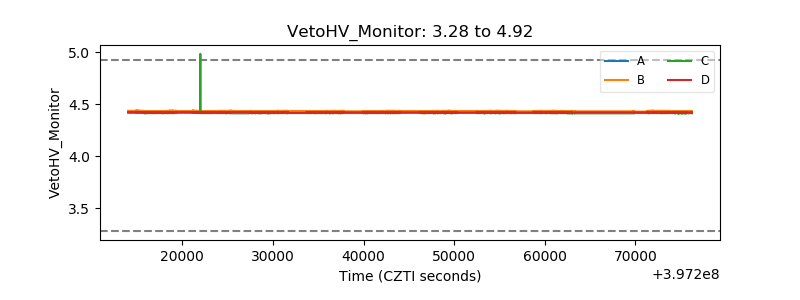 |
| Veto LLD | 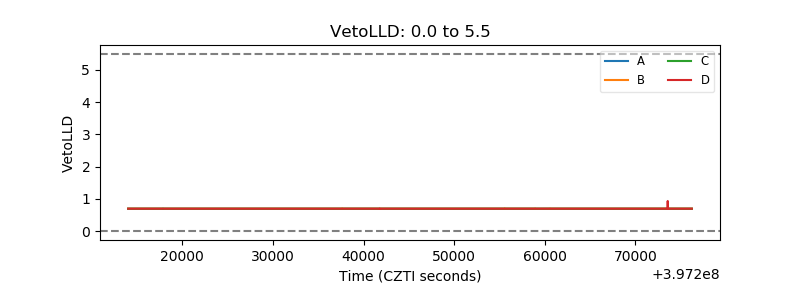 |
| Alpha Counter | 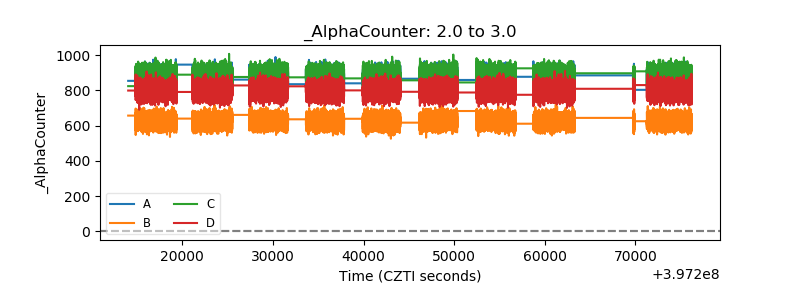 |
| _CPM_Rate |  |
| CZT Counter | 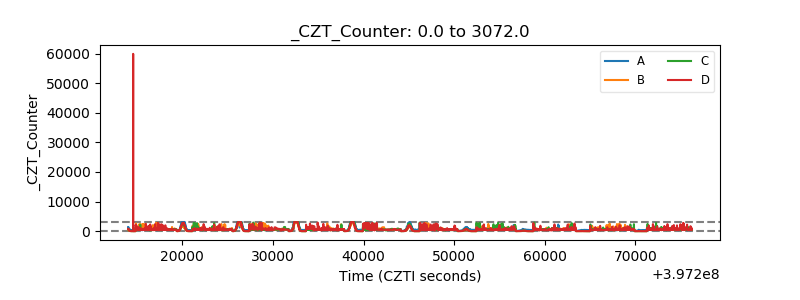 |
| +2.5 Volts monitor | 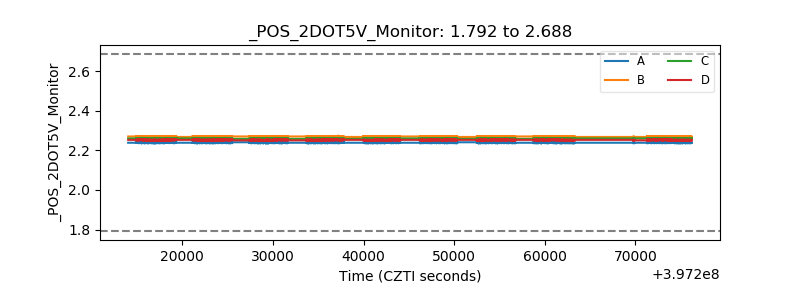 |
| +5 Volts monitor | 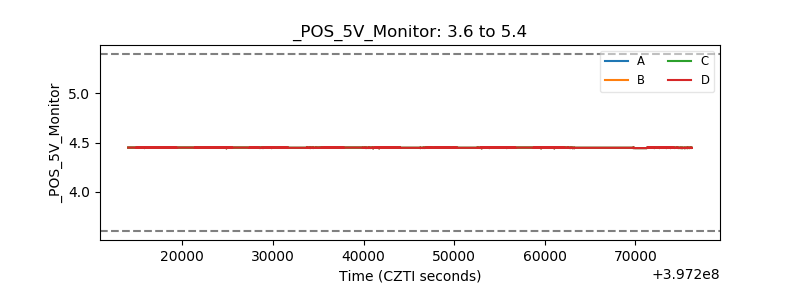 |
| _ROLL_ROT | 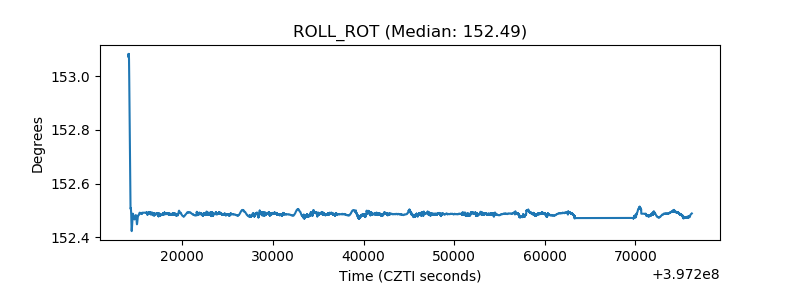 |
| _Roll_DEC |  |
| _Roll_RA | 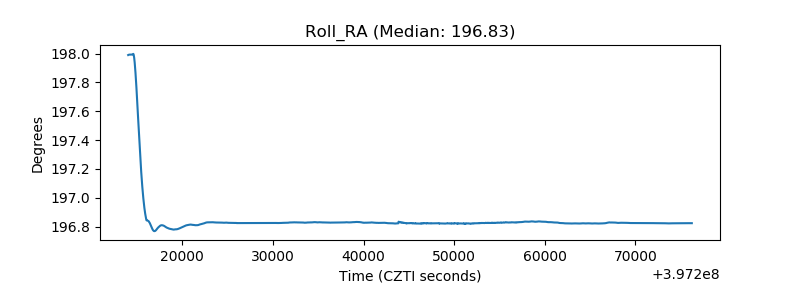 |
| Veto Counter | 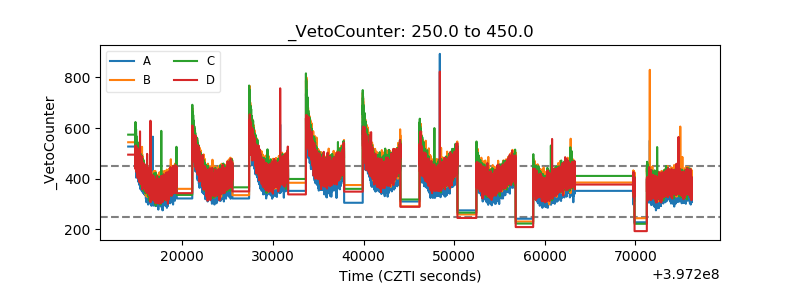 |