| Param | Original file | Final file |
|---|---|---|
| Filename | modeM0/AS1T05_046T01_9000005266_37023cztM0_level2.evt | modeM0/AS1T05_046T01_9000005266_37023cztM0_level2_quad_clean.evt |
| Size (bytes) | 7,401,600 | 1,742,400 |
| Size | 7.1 MB | 1.7 MB |
| Events in quadrant A | 48,847 | 10,291 |
| Events in quadrant B | 50,728 | 8,786 |
| Events in quadrant C | 57,707 | 11,312 |
| Events in quadrant D | 58,624 | 8,776 |
| Mode M0 | |||
|---|---|---|---|
| Quadrant | BADHDUFLAG | Total packets | Discarded packets |
| A | 0 | 1093 | 897 |
| B | 0 | 1682 | 1486 |
| C | 0 | 1217 | 994 |
| D | 0 | 1348 | 1125 |
| Mode SS | |||
|---|---|---|---|
| Quadrant | BADHDUFLAG | Total packets | Discarded packets |
| A | 0 | 8 | 8 |
| B | 0 | 8 | 4 |
| C | 0 | 7 | 5 |
| D | 0 | 8 | 6 |
| Mode M9 | |||
|---|---|---|---|
| Quadrant | BADHDUFLAG | Total packets | Discarded packets |
| A | 0 | 7 | 5 |
| B | 0 | 5 | 3 |
| C | 0 | 6 | 4 |
| D | 0 | 6 | 5 |
| Quadrant | Total seconds | Saturated seconds | Saturation percentage |
|---|---|---|---|
| A | 76 | 2 | 2.631579% |
| B | 63 | 2 | 3.174603% |
| C | 83 | 3 | 3.614458% |
| D | 70 | 8 | 11.428571% |
Noise dominated data is calculated using 1-second bins in cleaned event files. If a bin has >2000 counts, and if more than 50% of those come from <1% of pixels, then it is considered to be noise-dominated and hence unusable.
| Quadrant | # 1 sec bins | Bins with >0 counts | Bins with >2000 counts | High rate bins dominated by noise | Noise dominated (total time) | Noise dominated (detector-on time) | Marked lightcurve |
|---|---|---|---|---|---|---|---|
| A | 442 | 118 | 0 | 0 | 0.00% | 0.00% | 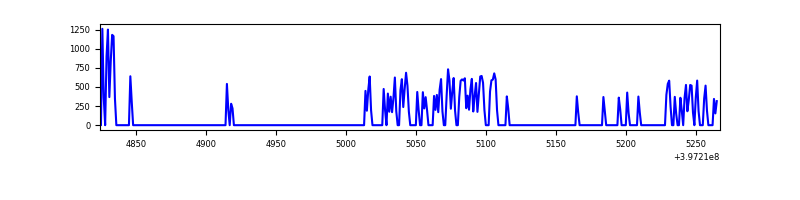 |
| B | 438 | 98 | 1 | 1 | 0.23% | 1.02% | 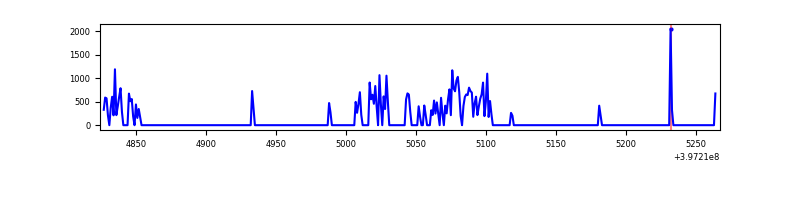 |
| C | 435 | 128 | 0 | 0 | 0.00% | 0.00% | 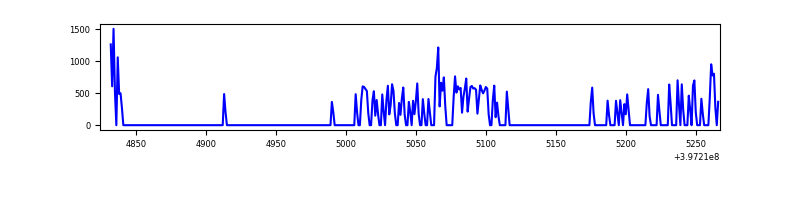 |
| D | 430 | 103 | 2 | 2 | 0.47% | 1.94% | 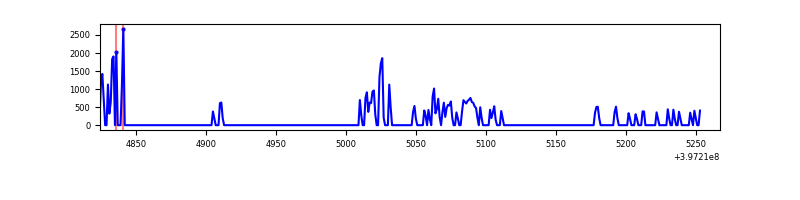 |
Top three noisy pixels from each quadrant. If the there are fewer than three noisy pixels in the level2.evt file, extra rows are filled as -1
| Pixel properties | Quadrant properties | ||||||
|---|---|---|---|---|---|---|---|
| Quadrant | DetID | PixID | Counts | Sigma | Mean | Median | Sigma |
| A | 10 | 83 | 9644 | 2528.84 | 9 | 9 | 3.8 |
| A | 10 | 67 | 421 | 108.14 | 9 | 9 | 3.8 |
| A | 13 | 6 | 169 | 41.99 | 9 | 9 | 3.8 |
| B | 5 | 184 | 17685 | 5458.27 | 8 | 8 | 3.2 |
| B | 11 | 111 | 221 | 65.77 | 8 | 8 | 3.2 |
| B | 12 | 111 | 218 | 64.84 | 8 | 8 | 3.2 |
| C | 1 | 23 | 4969 | 1205.17 | 10 | 10 | 4.1 |
| C | 15 | 214 | 4801 | 1164.35 | 10 | 10 | 4.1 |
| C | 0 | 10 | 3081 | 746.34 | 10 | 10 | 4.1 |
| D | 13 | 171 | 9743 | 2695.11 | 8 | 8 | 3.6 |
| D | 1 | 52 | 5108 | 1411.92 | 8 | 8 | 3.6 |
| D | 10 | 118 | 2635 | 727.28 | 8 | 8 | 3.6 |
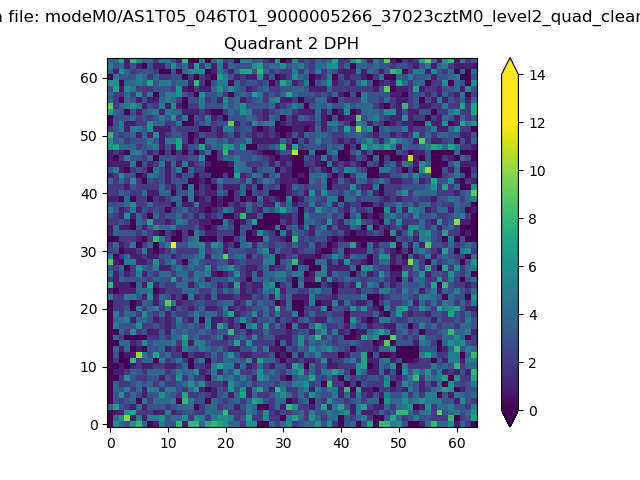
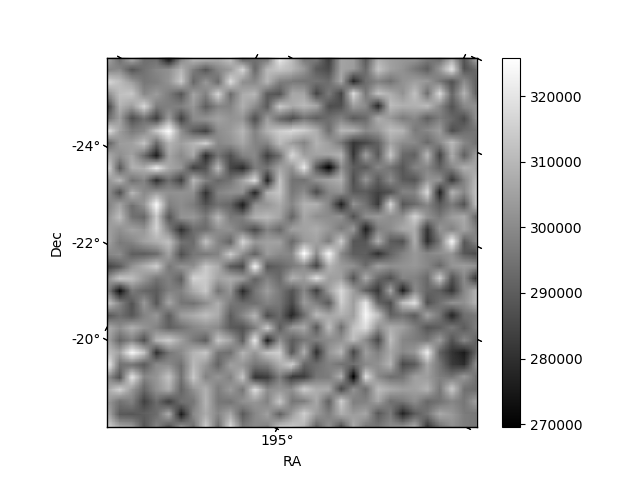
Histogram calculated using DETX and DETY for each event in the final _common_clean file
| Quadrant A | 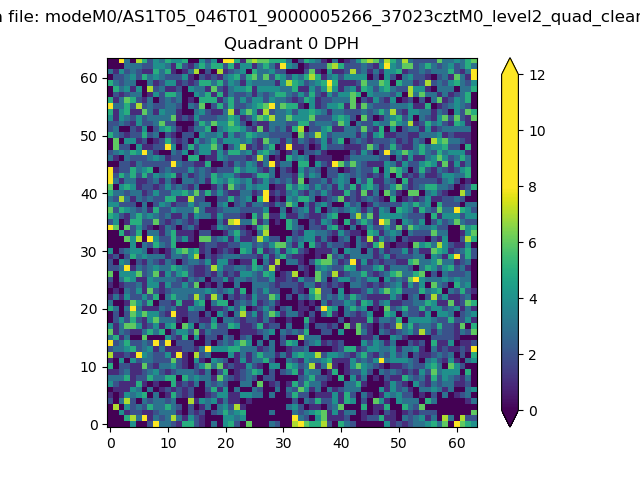 |
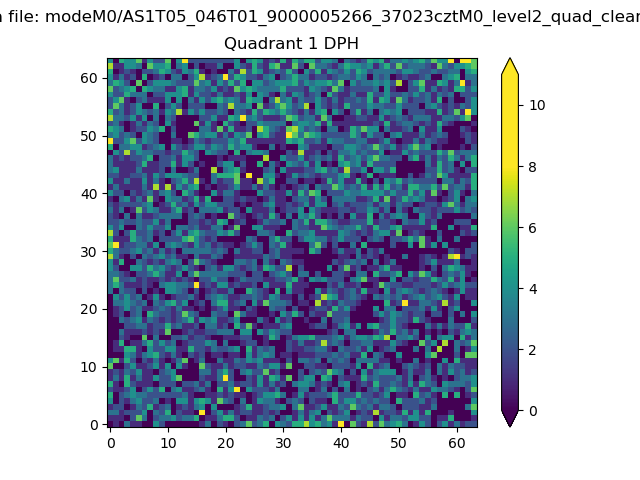 |
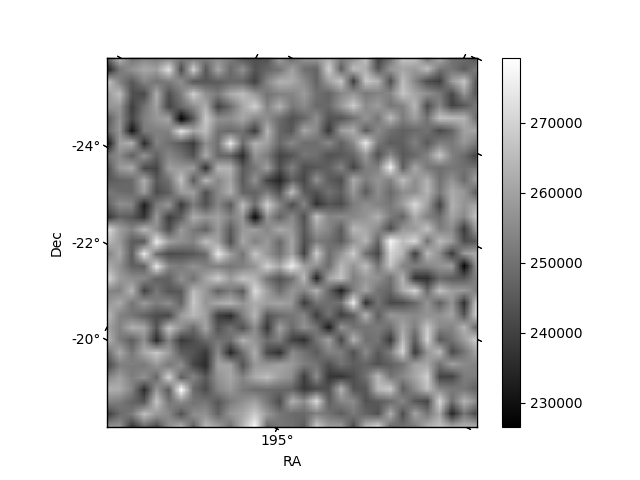
Quadrant B |
|---|---|---|---|
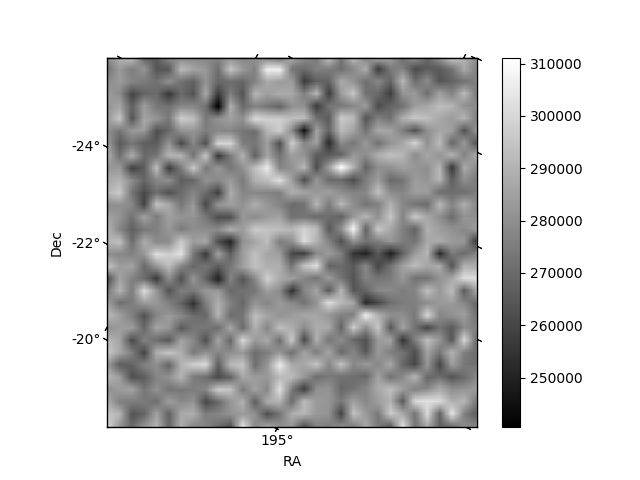
| Quadrant D | 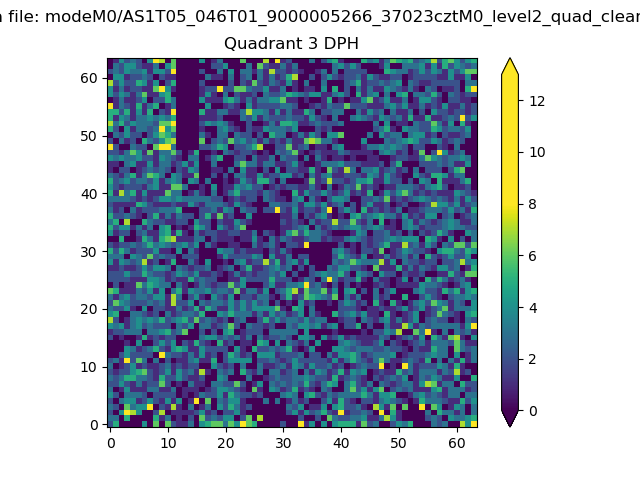 |
 |
Quadrant C |
| Plot type | Count rate plots | Images |
|---|---|---|
| Comparison with Poisson distribution Blue bars denote a histogram of data divided into 1 sec bins. Red curve is a Poisson curve with rate = median count rate of data. |
 |
 |
| Quadrant-wise count rates Data is divided into 100 sec bins |
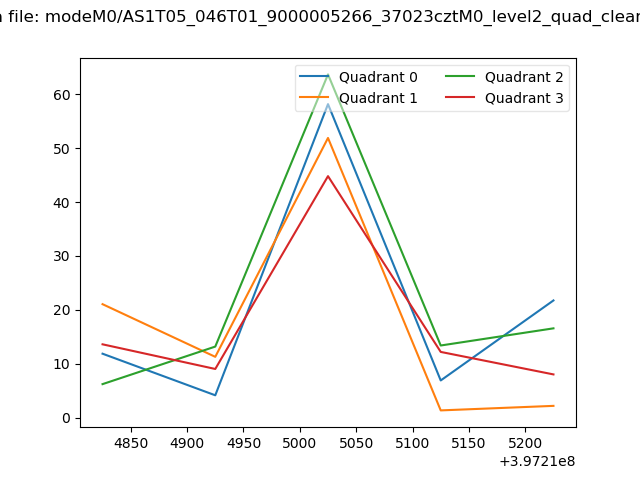 |
|
| Module-wise count rates for Quadrant A Data is divided into 100 sec bins |
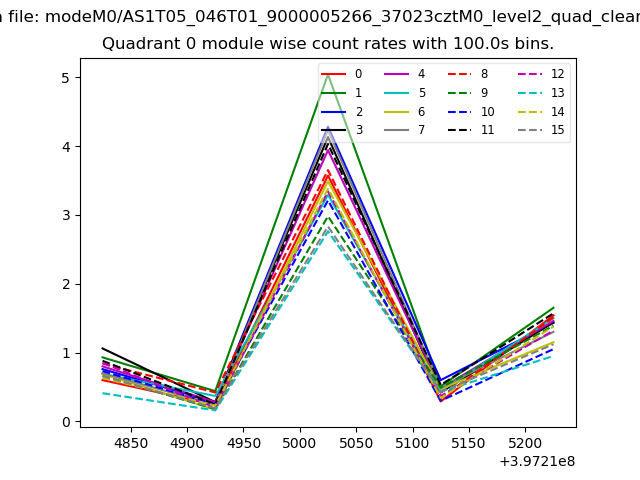 |
 |
| Module-wise count rates for Quadrant B Data is divided into 100 sec bins |
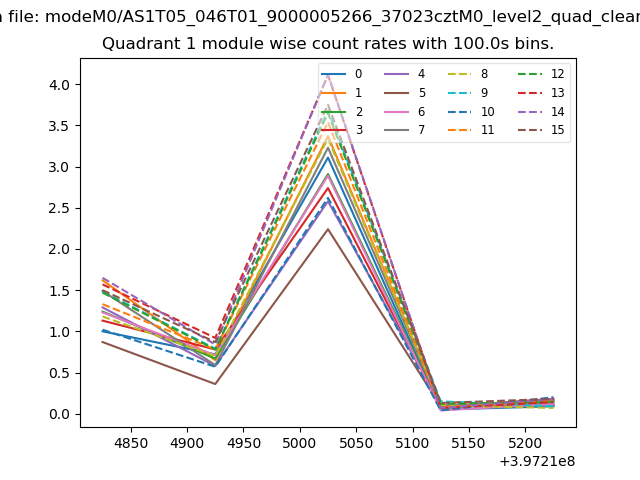 |
 |
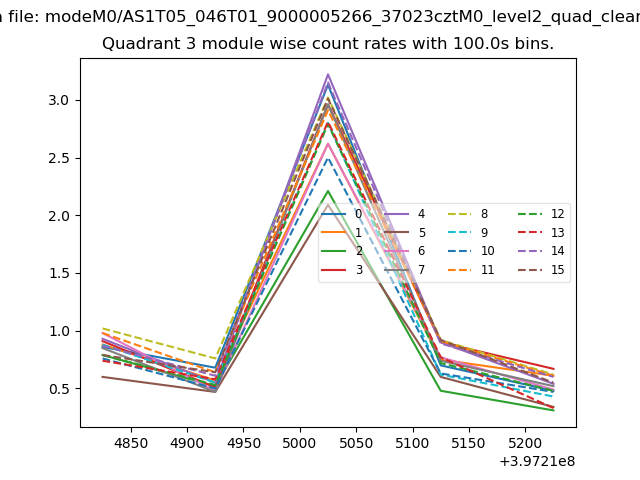
| Module-wise count rates for Quadrant C Data is divided into 100 sec bins |
 |
 |
| Module-wise count rates for Quadrant D Data is divided into 100 sec bins |
 |
 |
| Parameter | Plot |
|---|---|
| CZT HV Monitor |  |
| D_VDD | 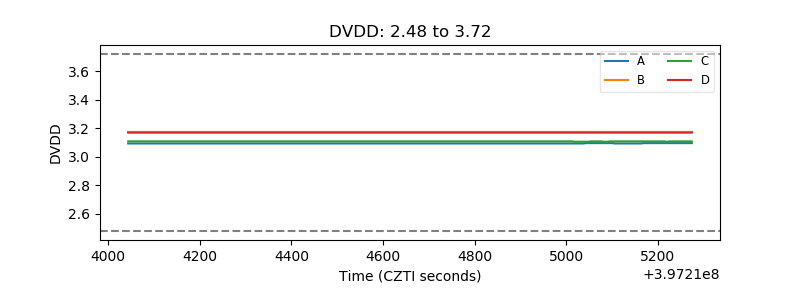 |
| Temperature 1 | 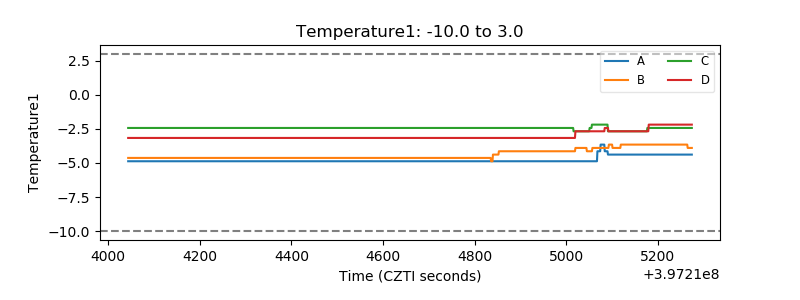 |
| Veto HV Monitor | 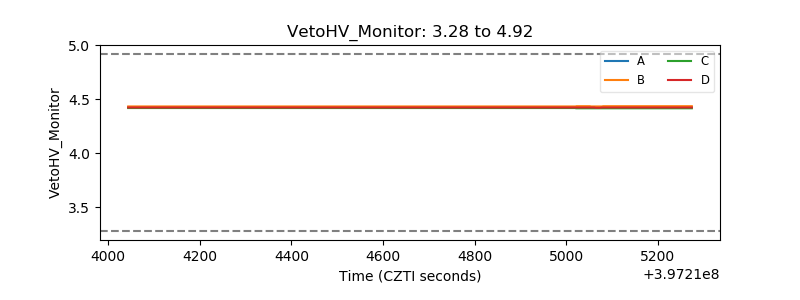 |
| Veto LLD | 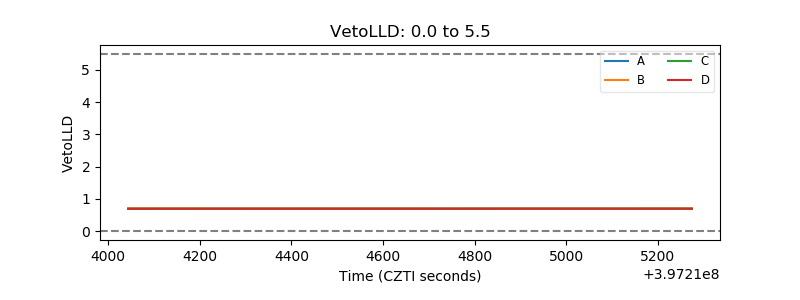 |
| Alpha Counter |  |
| _CPM_Rate | 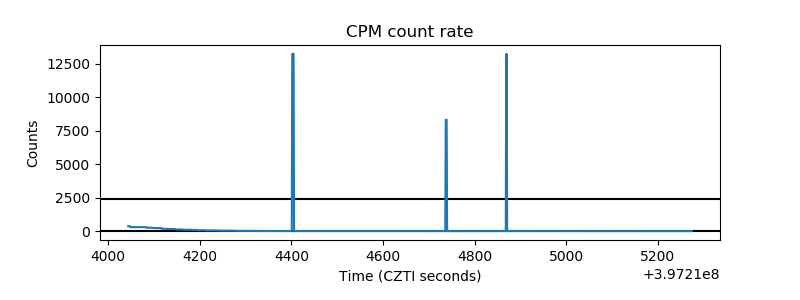 |
| CZT Counter |  |
| +2.5 Volts monitor | 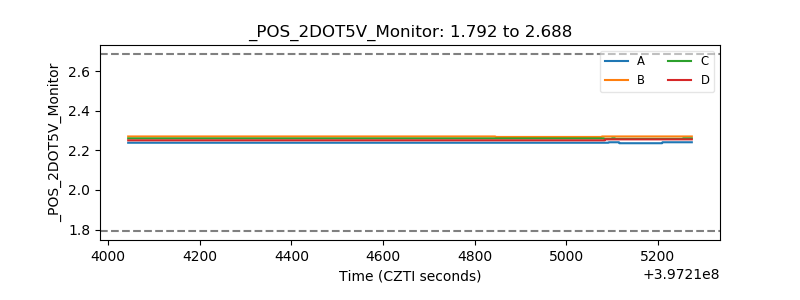 |
| +5 Volts monitor |  |
| _ROLL_ROT | 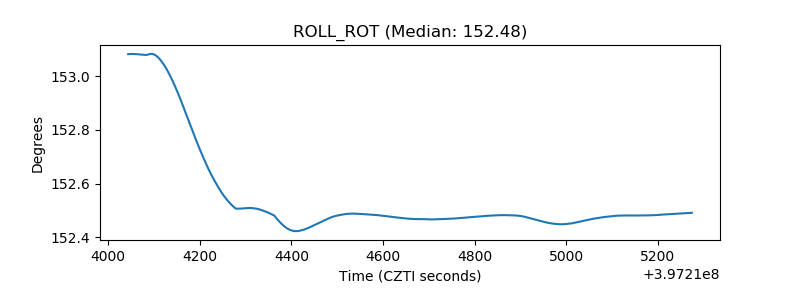 |
| _Roll_DEC | 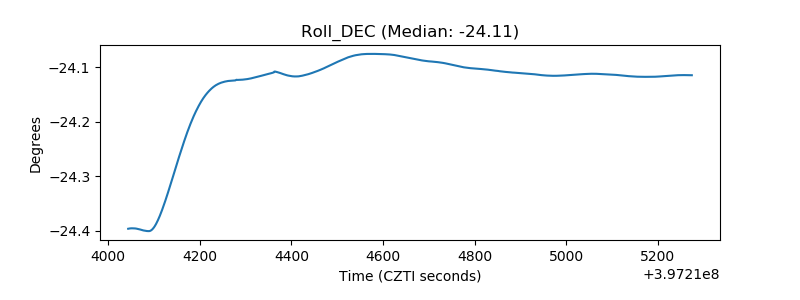 |
| _Roll_RA |  |
| Veto Counter | 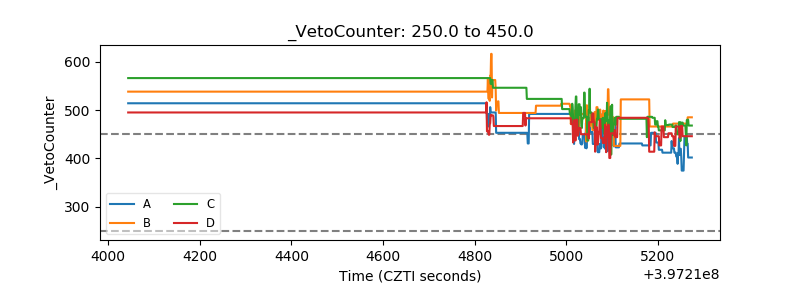 |