| Param | Original file | Final file |
|---|---|---|
| Filename | modeM0/AS1T05_046T01_9000005266_37025cztM0_level2.evt | modeM0/AS1T05_046T01_9000005266_37025cztM0_level2_quad_clean.evt |
| Size (bytes) | 486,432,000 | 84,660,480 |
| Size | 463.9 MB | 80.7 MB |
| Events in quadrant A | 2,843,878 | 568,905 |
| Events in quadrant B | 4,152,385 | 539,901 |
| Events in quadrant C | 3,432,737 | 539,022 |
| Events in quadrant D | 3,924,223 | 525,547 |
| Mode M0 | |||
|---|---|---|---|
| Quadrant | BADHDUFLAG | Total packets | Discarded packets |
| A | 0 | 12003 | 3 |
| B | 0 | 16099 | 2 |
| C | 0 | 13668 | 2 |
| D | 0 | 15330 | 2 |
| Mode SS | |||
|---|---|---|---|
| Quadrant | BADHDUFLAG | Total packets | Discarded packets |
| A | 0 | 114 | 0 |
| B | 0 | 114 | 0 |
| C | 0 | 114 | 0 |
| D | 0 | 114 | 0 |
| Mode M9 | |||
|---|---|---|---|
| Quadrant | BADHDUFLAG | Total packets | Discarded packets |
| A | 0 | 26 | 0 |
| B | 0 | 26 | 0 |
| C | 0 | 26 | 0 |
| D | 0 | 26 | 0 |
| Quadrant | Total seconds | Saturated seconds | Saturation percentage |
|---|---|---|---|
| A | 5574 | 19 | 0.340868% |
| B | 5574 | 472 | 8.467887% |
| C | 5574 | 207 | 3.713671% |
| D | 5574 | 180 | 3.229279% |
Noise dominated data is calculated using 1-second bins in cleaned event files. If a bin has >2000 counts, and if more than 50% of those come from <1% of pixels, then it is considered to be noise-dominated and hence unusable.
| Quadrant | # 1 sec bins | Bins with >0 counts | Bins with >2000 counts | High rate bins dominated by noise | Noise dominated (total time) | Noise dominated (detector-on time) | Marked lightcurve |
|---|---|---|---|---|---|---|---|
| A | 7306 | 5575 | 2 | 2 | 0.03% | 0.04% | 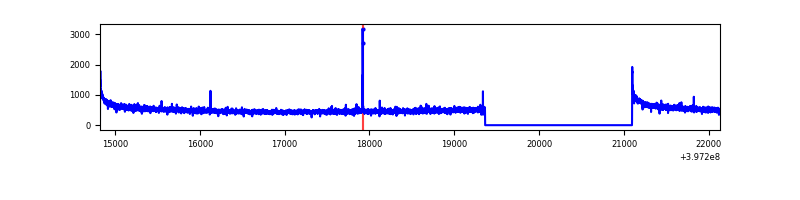 |
| B | 7306 | 5575 | 308 | 308 | 4.22% | 5.52% | 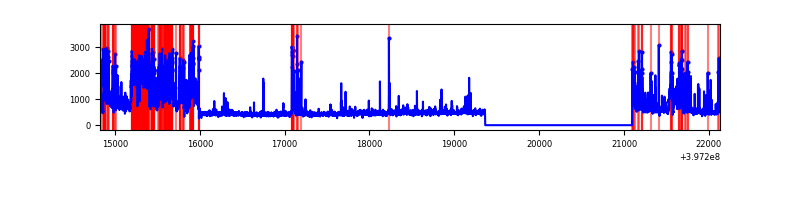 |
| C | 7306 | 5575 | 161 | 161 | 2.20% | 2.89% | 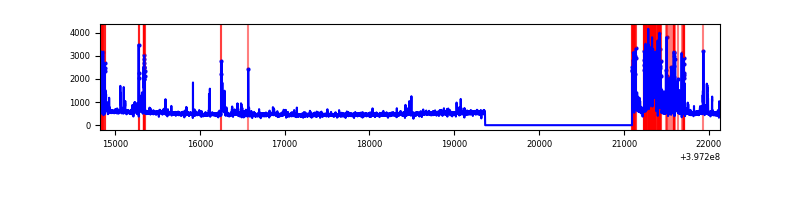 |
| D | 7306 | 5575 | 152 | 152 | 2.08% | 2.73% | 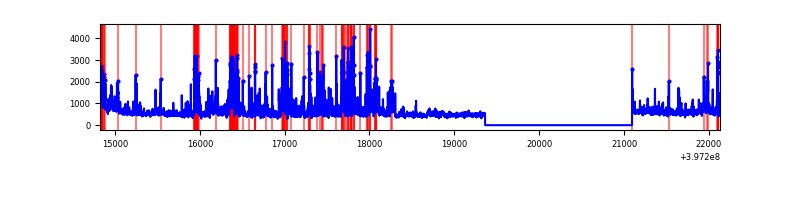 |
Top three noisy pixels from each quadrant. If the there are fewer than three noisy pixels in the level2.evt file, extra rows are filled as -1
| Pixel properties | Quadrant properties | ||||||
|---|---|---|---|---|---|---|---|
| Quadrant | DetID | PixID | Counts | Sigma | Mean | Median | Sigma |
| A | 10 | 83 | 235343 | 1741.39 | 665 | 652 | 134.8 |
| A | 13 | 6 | 20327 | 145.99 | 665 | 652 | 134.8 |
| A | 9 | 143 | 18691 | 133.85 | 665 | 652 | 134.8 |
| B | 5 | 184 | 1319124 | 10814.96 | 633 | 617 | 121.9 |
| B | 5 | 172 | 199079 | 1627.87 | 633 | 617 | 121.9 |
| B | 0 | 219 | 37653 | 303.79 | 633 | 617 | 121.9 |
| C | 1 | 23 | 458533 | 3168.66 | 624 | 631 | 144.5 |
| C | 15 | 214 | 236777 | 1634.12 | 624 | 631 | 144.5 |
| C | 0 | 10 | 150834 | 1039.4 | 624 | 631 | 144.5 |
| D | 13 | 171 | 357682 | 2300.54 | 638 | 622 | 155.2 |
| D | 2 | 153 | 337885 | 2172.99 | 638 | 622 | 155.2 |
| D | 2 | 250 | 243651 | 1565.84 | 638 | 622 | 155.2 |
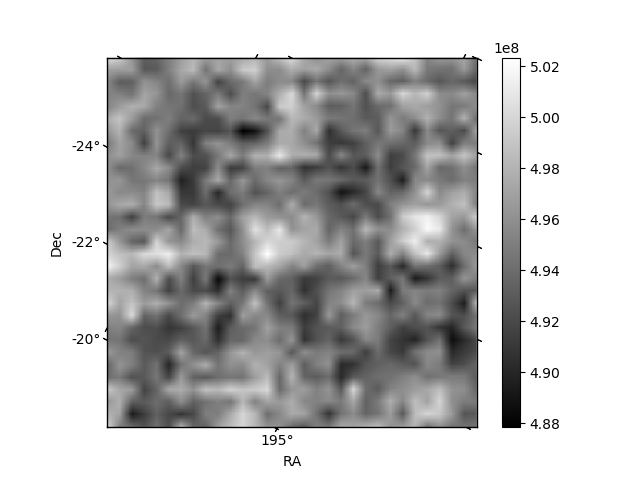
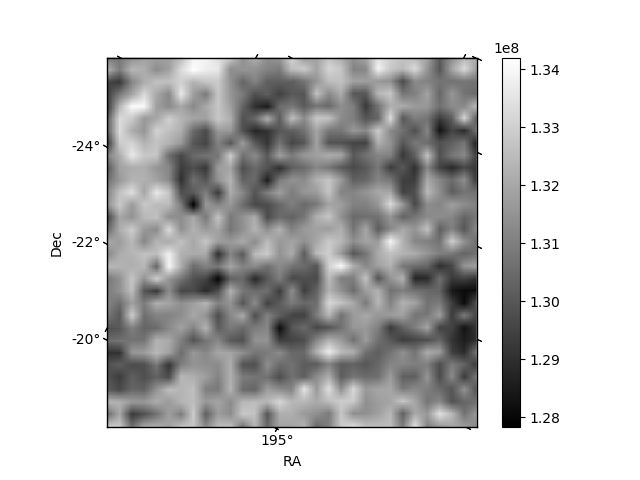
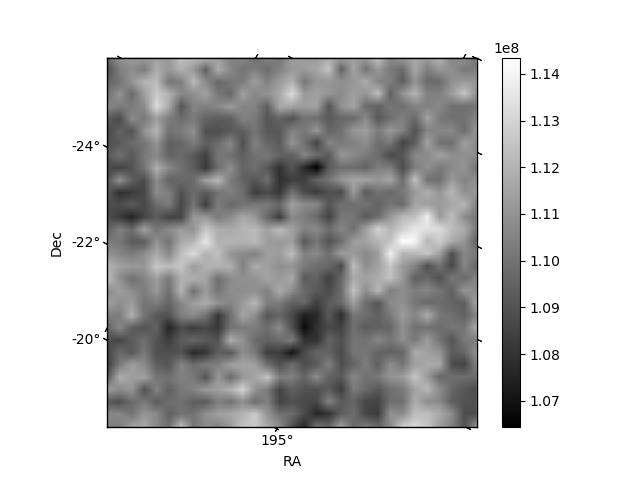
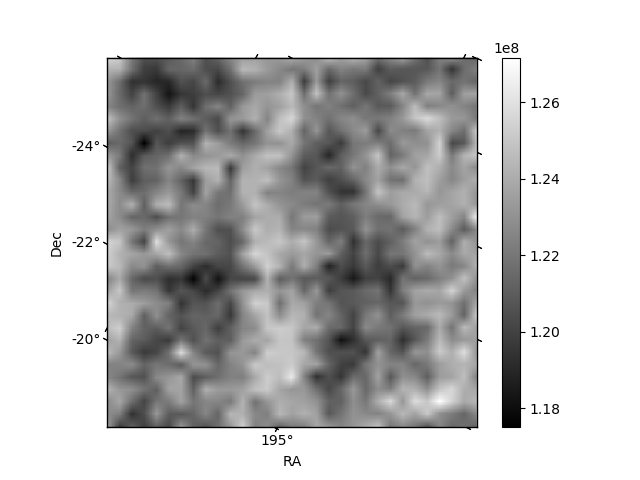
Histogram calculated using DETX and DETY for each event in the final _common_clean file
| Quadrant A | 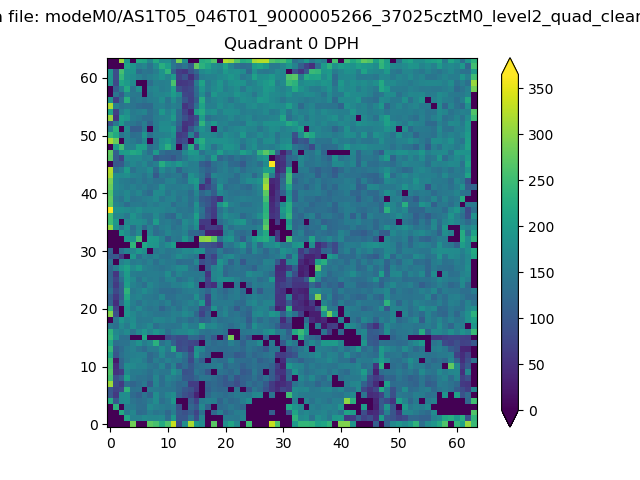 |
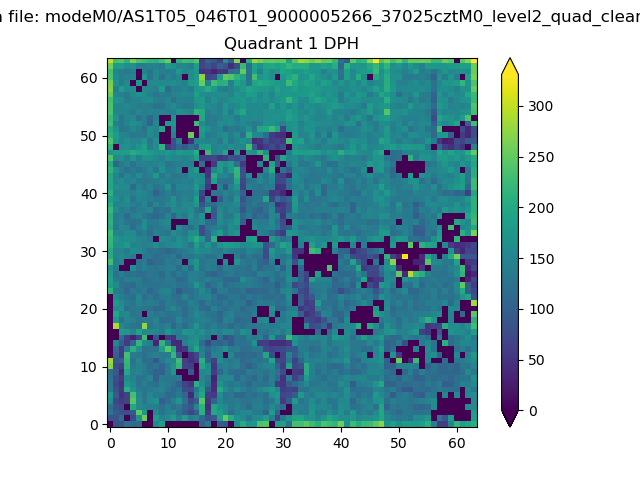 |
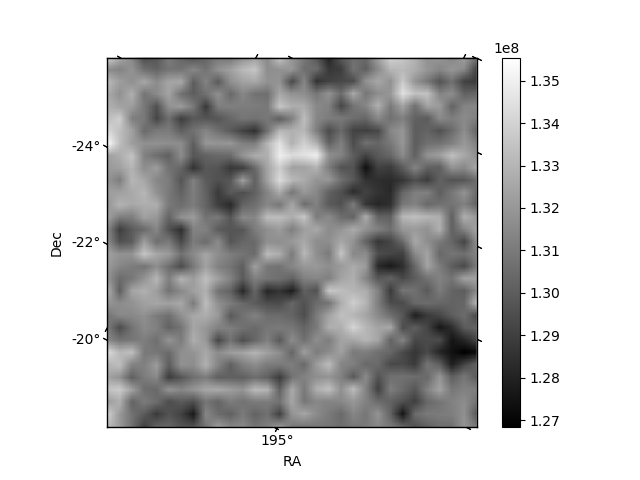
Quadrant B |
|---|---|---|---|
| Quadrant D | 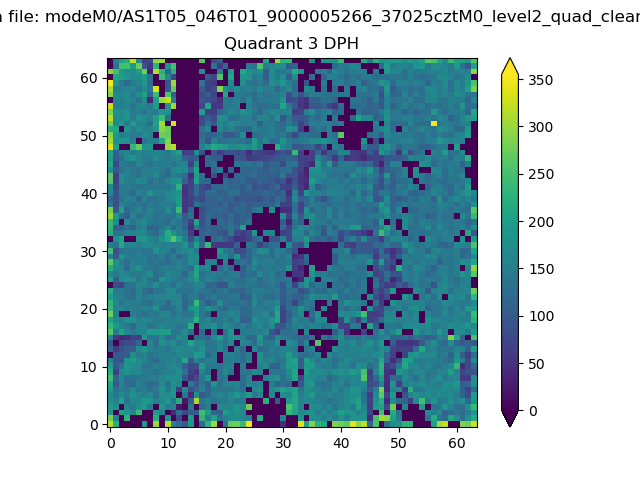 |
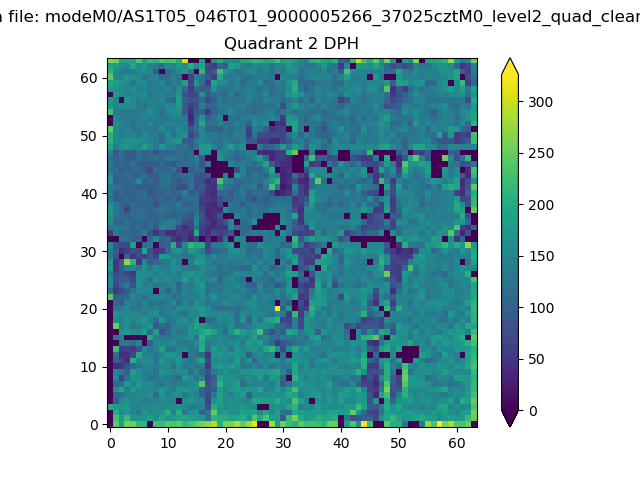 |
Quadrant C |
| Plot type | Count rate plots | Images |
|---|---|---|
| Comparison with Poisson distribution Blue bars denote a histogram of data divided into 1 sec bins. Red curve is a Poisson curve with rate = median count rate of data. |
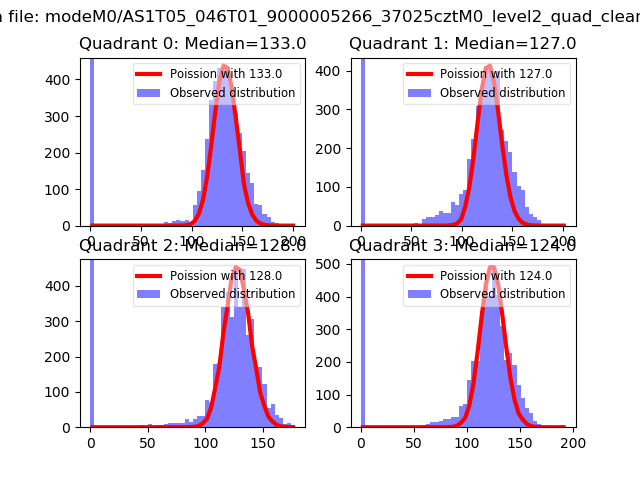 |
 |
| Quadrant-wise count rates Data is divided into 100 sec bins |
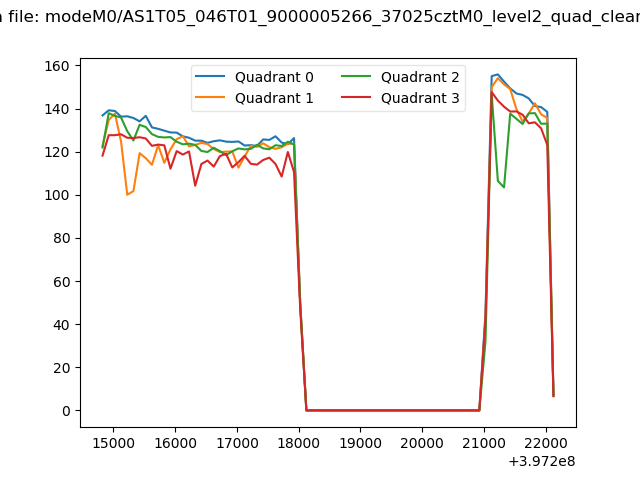 |
|
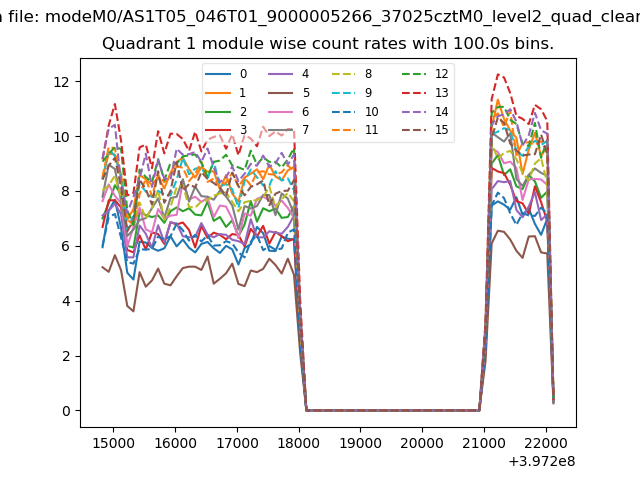
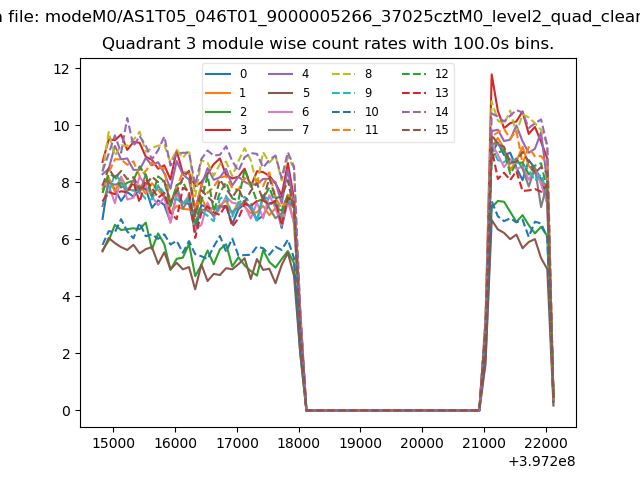
| Module-wise count rates for Quadrant A Data is divided into 100 sec bins |
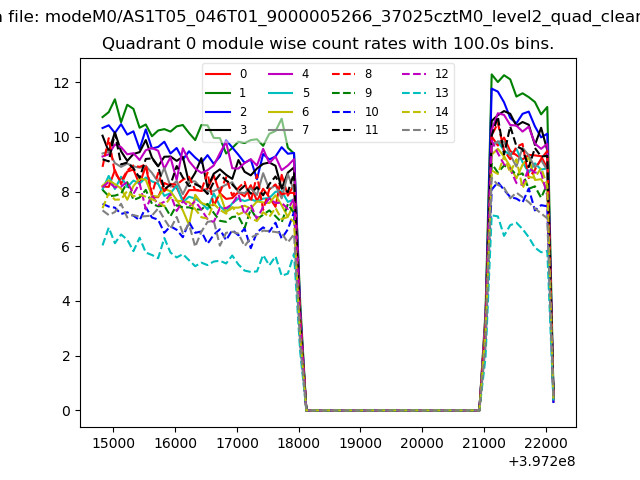 |
 |
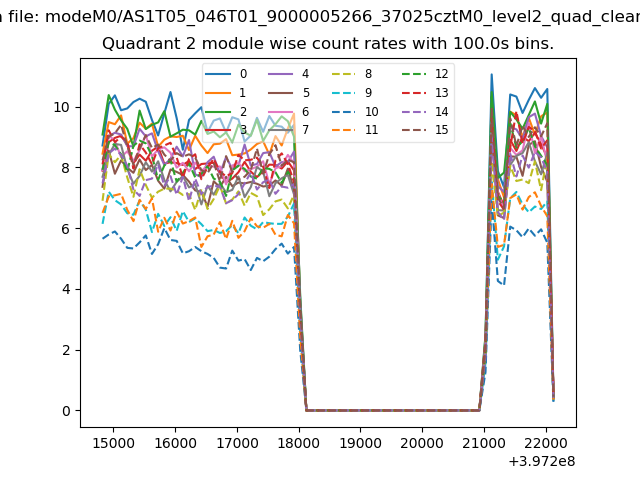
| Module-wise count rates for Quadrant B Data is divided into 100 sec bins |
 |
 |
| Module-wise count rates for Quadrant C Data is divided into 100 sec bins |
 |
 |
| Module-wise count rates for Quadrant D Data is divided into 100 sec bins |
 |
 |
| Parameter | Plot |
|---|---|
| CZT HV Monitor | 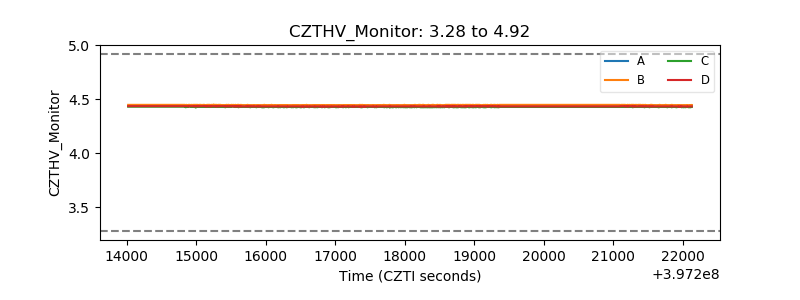 |
| D_VDD | 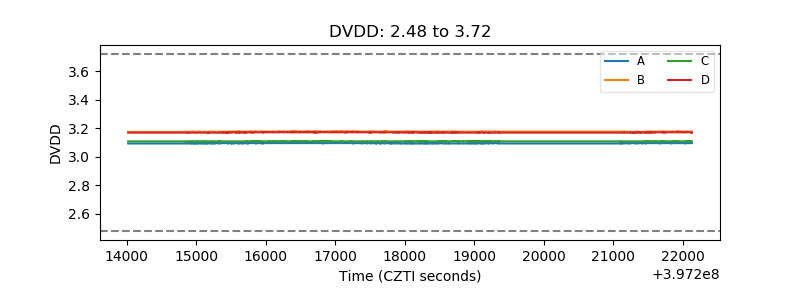 |
| Temperature 1 | 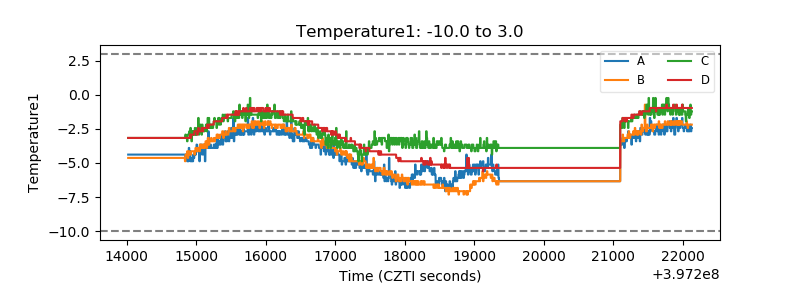 |
| Veto HV Monitor | 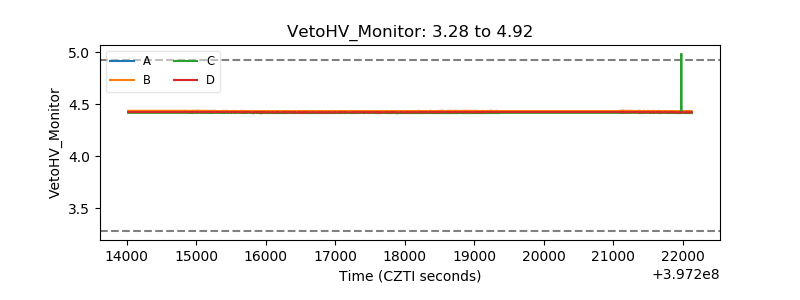 |
| Veto LLD | 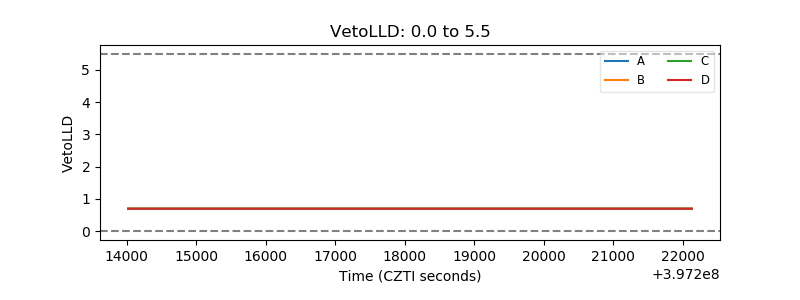 |
| Alpha Counter | 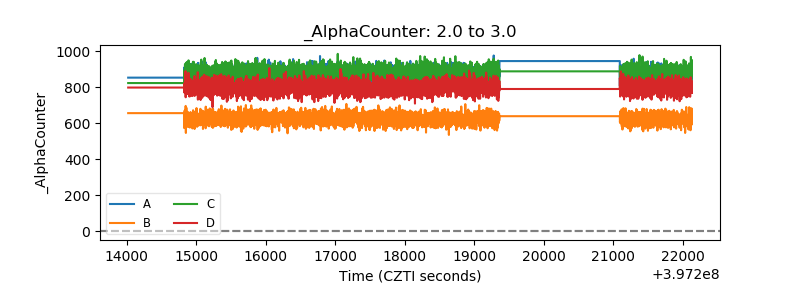 |
| _CPM_Rate | 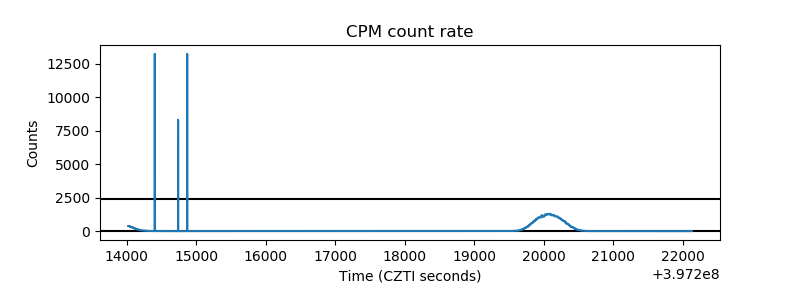 |
| CZT Counter | 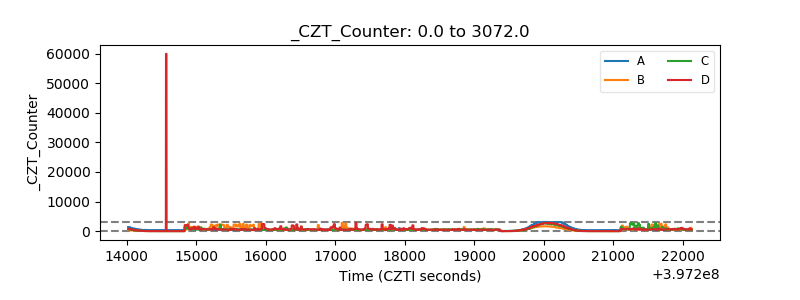 |
| +2.5 Volts monitor | 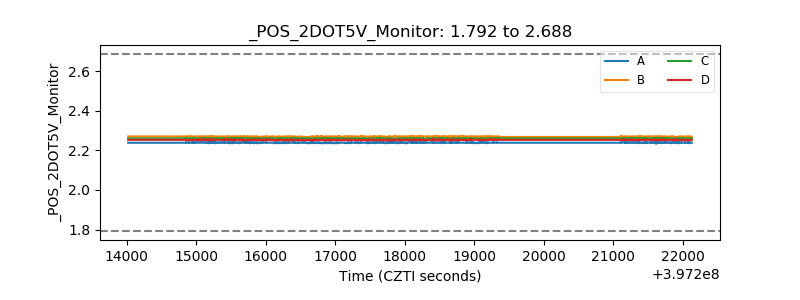 |
| +5 Volts monitor | 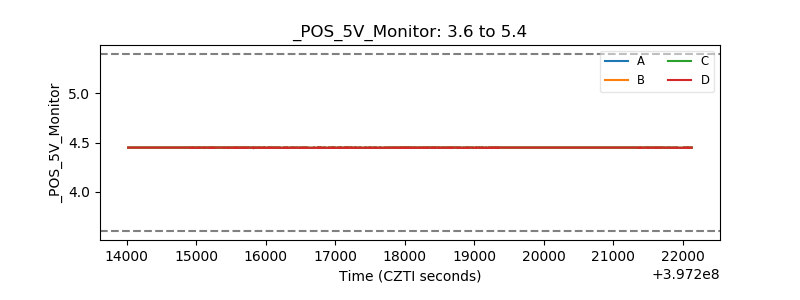 |
| _ROLL_ROT | 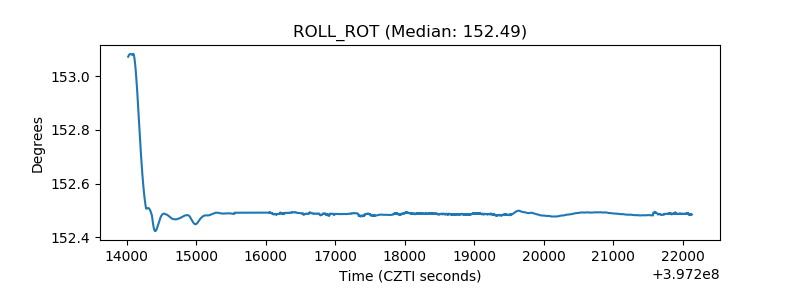 |
| _Roll_DEC | 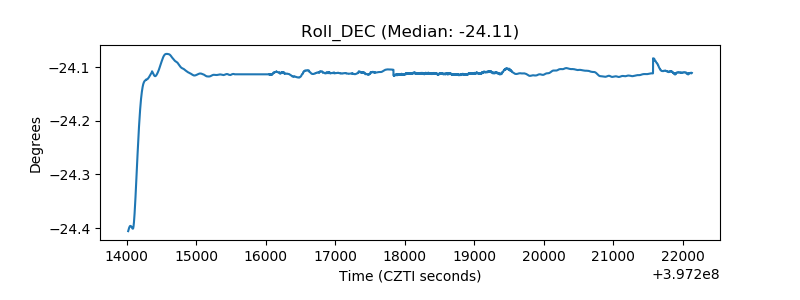 |
| _Roll_RA | 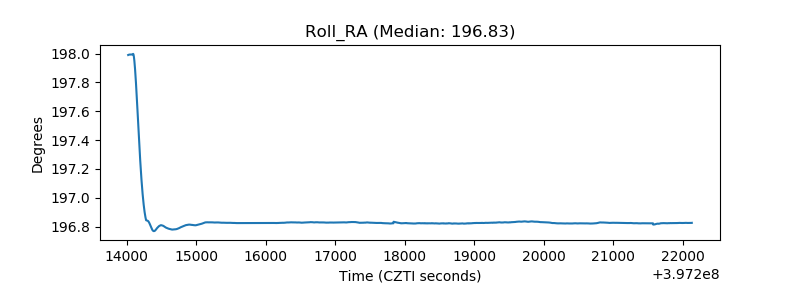 |
| Veto Counter | 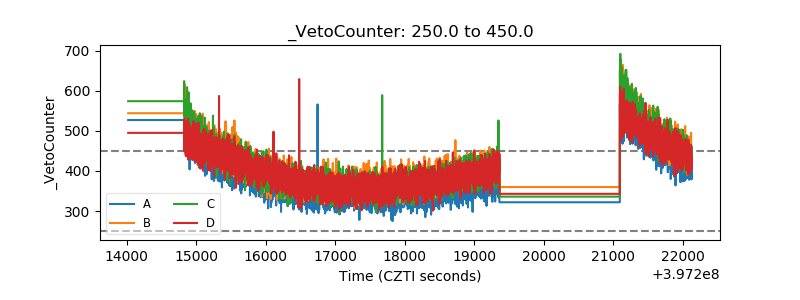 |