| Param | Original file | Final file |
|---|---|---|
| Filename | modeM0/AS1T05_046T01_9000005266_37026cztM0_level2.evt | modeM0/AS1T05_046T01_9000005266_37026cztM0_level2_quad_clean.evt |
| Size (bytes) | 489,709,440 | 80,208,000 |
| Size | 467.0 MB | 76.5 MB |
| Events in quadrant A | 2,818,945 | 544,107 |
| Events in quadrant B | 4,288,705 | 505,830 |
| Events in quadrant C | 3,637,377 | 496,109 |
| Events in quadrant D | 3,717,823 | 502,784 |
| Mode M0 | |||
|---|---|---|---|
| Quadrant | BADHDUFLAG | Total packets | Discarded packets |
| A | 0 | 11770 | 3 |
| B | 0 | 16432 | 2 |
| C | 0 | 14166 | 2 |
| D | 0 | 14725 | 2 |
| Mode SS | |||
|---|---|---|---|
| Quadrant | BADHDUFLAG | Total packets | Discarded packets |
| A | 0 | 110 | 0 |
| B | 0 | 110 | 0 |
| C | 0 | 110 | 0 |
| D | 0 | 110 | 0 |
| Mode M9 | |||
|---|---|---|---|
| Quadrant | BADHDUFLAG | Total packets | Discarded packets |
| A | 0 | 19 | 0 |
| B | 0 | 19 | 0 |
| C | 0 | 19 | 0 |
| D | 0 | 19 | 0 |
| Quadrant | Total seconds | Saturated seconds | Saturation percentage |
|---|---|---|---|
| A | 5427 | 11 | 0.202690% |
| B | 5427 | 492 | 9.065782% |
| C | 5427 | 300 | 5.527916% |
| D | 5428 | 91 | 1.676492% |
Noise dominated data is calculated using 1-second bins in cleaned event files. If a bin has >2000 counts, and if more than 50% of those come from <1% of pixels, then it is considered to be noise-dominated and hence unusable.
| Quadrant | # 1 sec bins | Bins with >0 counts | Bins with >2000 counts | High rate bins dominated by noise | Noise dominated (total time) | Noise dominated (detector-on time) | Marked lightcurve |
|---|---|---|---|---|---|---|---|
| A | 7280 | 5428 | 0 | 0 | 0.00% | 0.00% | 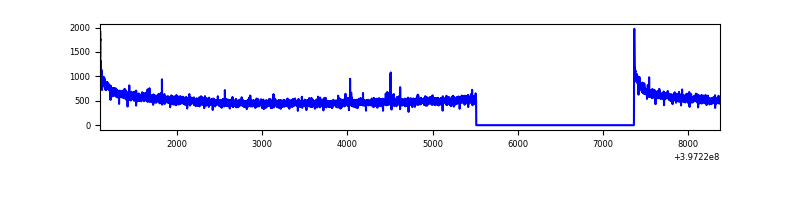 |
| B | 7280 | 5428 | 383 | 383 | 5.26% | 7.06% | 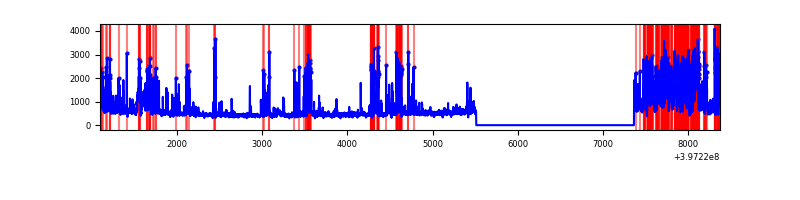 |
| C | 7280 | 5428 | 257 | 257 | 3.53% | 4.73% | 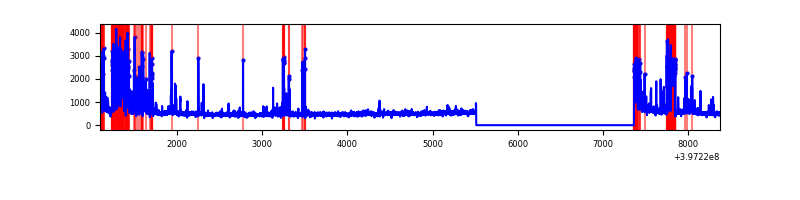 |
| D | 7281 | 5429 | 87 | 87 | 1.19% | 1.60% | 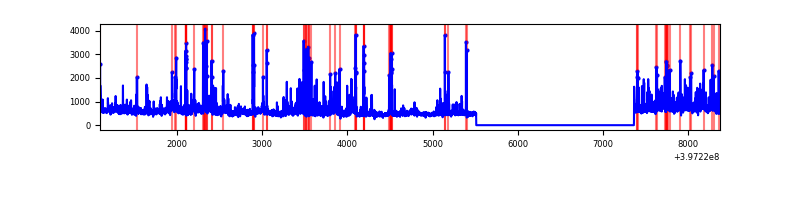 |
Top three noisy pixels from each quadrant. If the there are fewer than three noisy pixels in the level2.evt file, extra rows are filled as -1
| Pixel properties | Quadrant properties | ||||||
|---|---|---|---|---|---|---|---|
| Quadrant | DetID | PixID | Counts | Sigma | Mean | Median | Sigma |
| A | 10 | 83 | 233735 | 1742.32 | 662 | 650 | 133.8 |
| A | 13 | 6 | 20892 | 151.31 | 662 | 650 | 133.8 |
| A | 9 | 143 | 7177 | 48.79 | 662 | 650 | 133.8 |
| B | 5 | 184 | 1536365 | 12935.02 | 622 | 606 | 118.7 |
| B | 5 | 172 | 179865 | 1509.82 | 622 | 606 | 118.7 |
| B | 15 | 85 | 31903 | 263.6 | 622 | 606 | 118.7 |
| C | 1 | 23 | 716411 | 5086.76 | 608 | 613 | 140.7 |
| C | 15 | 214 | 228243 | 1617.63 | 608 | 613 | 140.7 |
| C | 0 | 10 | 192006 | 1360.12 | 608 | 613 | 140.7 |
| D | 12 | 235 | 429634 | 2772.99 | 633 | 617 | 154.7 |
| D | 2 | 153 | 342820 | 2211.86 | 633 | 617 | 154.7 |
| D | 2 | 250 | 248279 | 1600.79 | 633 | 617 | 154.7 |
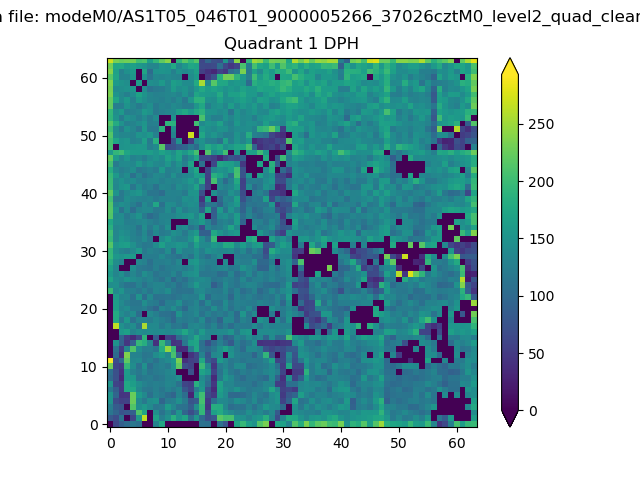
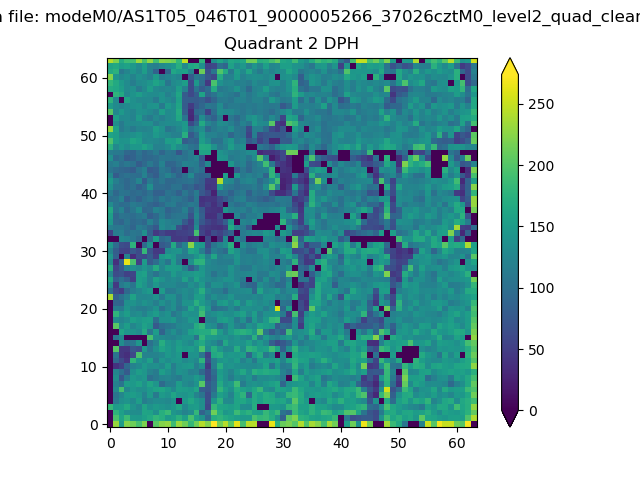
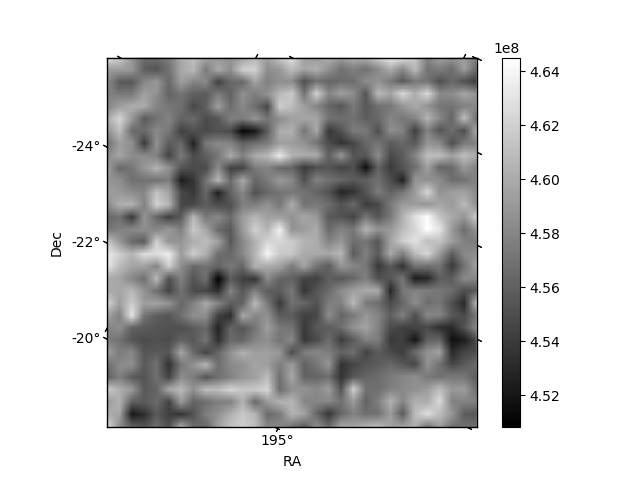
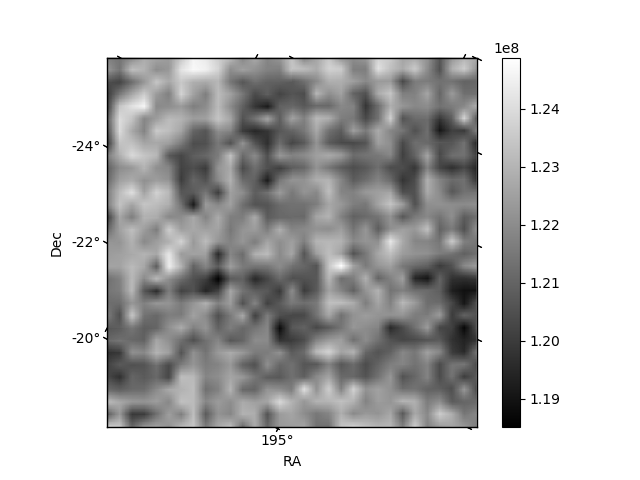
Histogram calculated using DETX and DETY for each event in the final _common_clean file
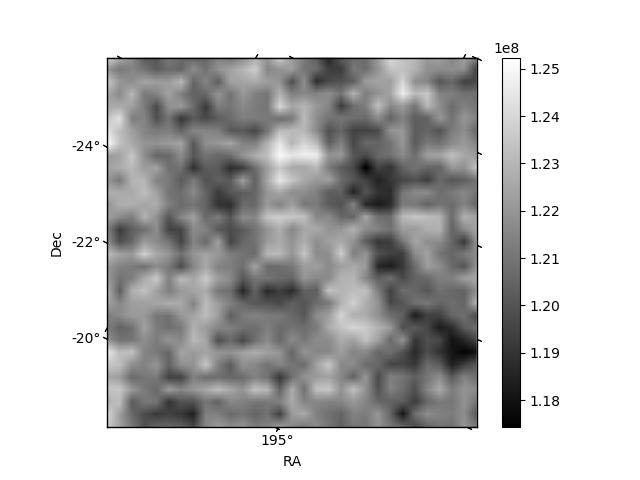
| Quadrant A |  |
 |
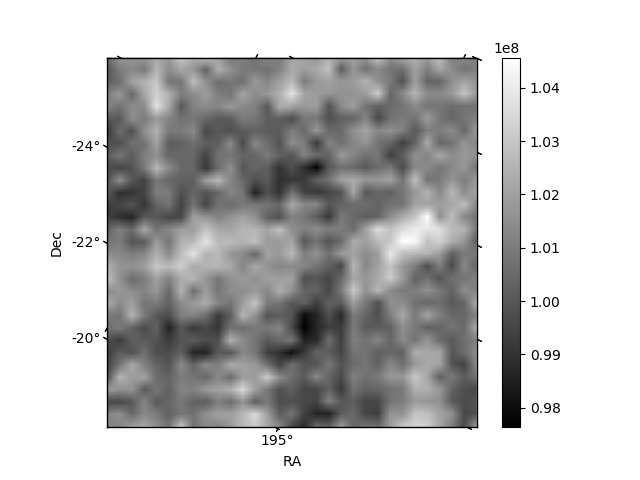
Quadrant B |
|---|---|---|---|
| Quadrant D | 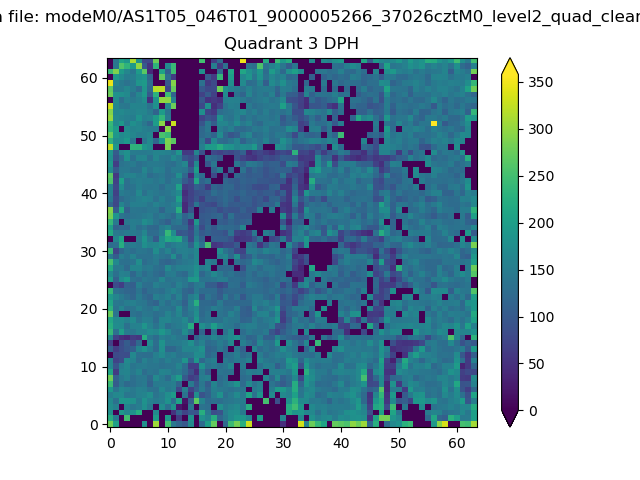 |
 |
Quadrant C |
| Plot type | Count rate plots | Images |
|---|---|---|
| Comparison with Poisson distribution Blue bars denote a histogram of data divided into 1 sec bins. Red curve is a Poisson curve with rate = median count rate of data. |
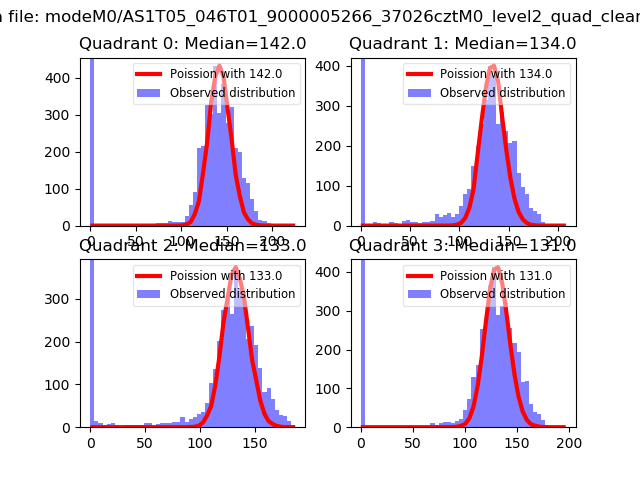 |
 |
| Quadrant-wise count rates Data is divided into 100 sec bins |
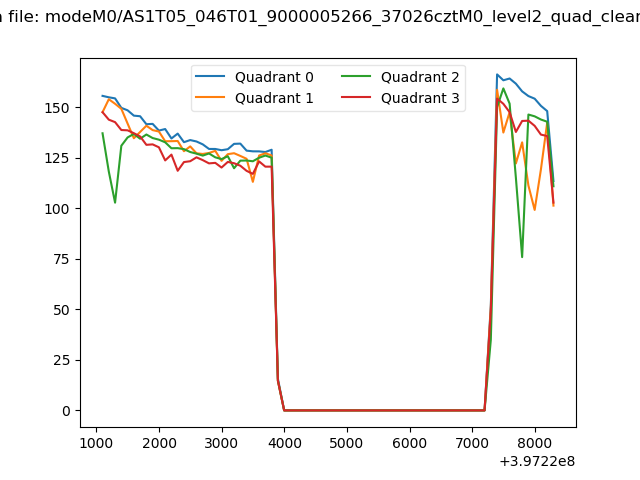 |
|
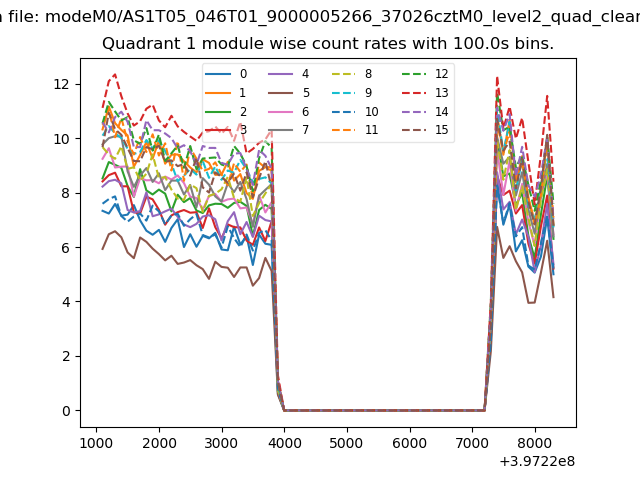
| Module-wise count rates for Quadrant A Data is divided into 100 sec bins |
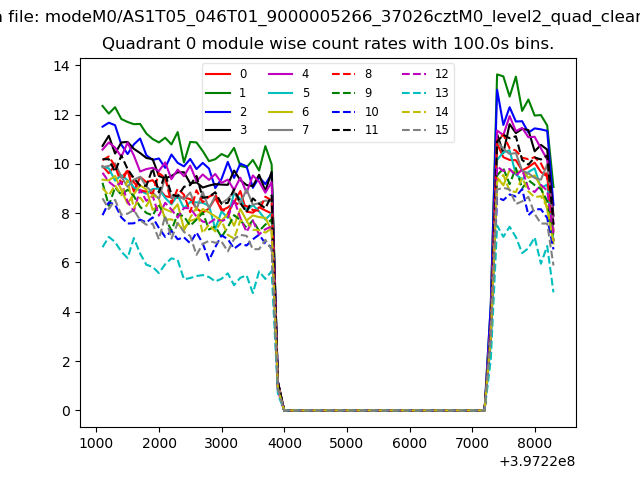 |
 |
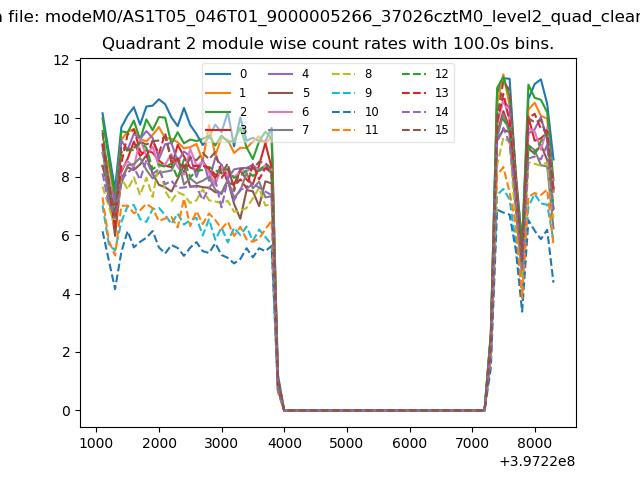
| Module-wise count rates for Quadrant B Data is divided into 100 sec bins |
 |
 |
| Module-wise count rates for Quadrant C Data is divided into 100 sec bins |
 |
 |
| Module-wise count rates for Quadrant D Data is divided into 100 sec bins |
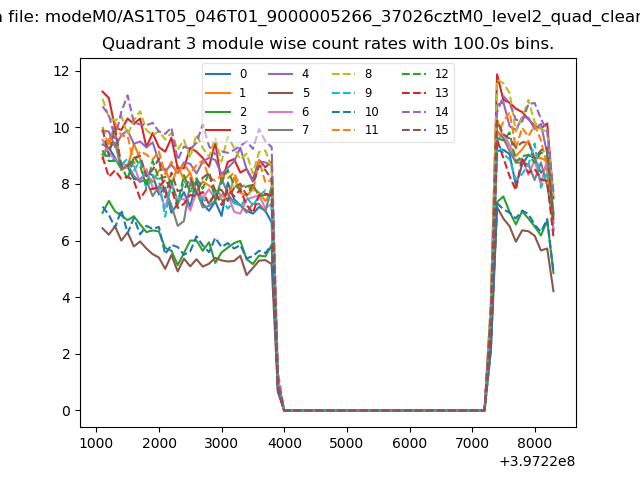 |
 |
| Parameter | Plot |
|---|---|
| CZT HV Monitor | 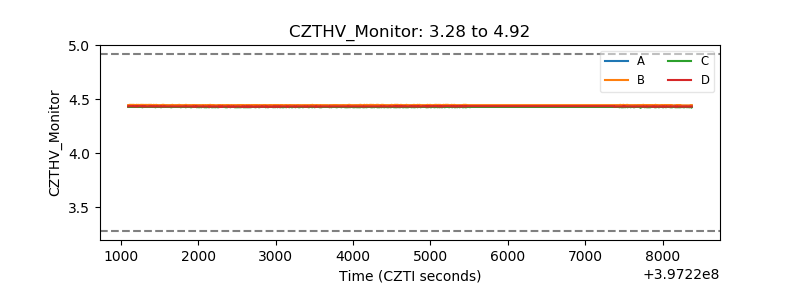 |
| D_VDD | 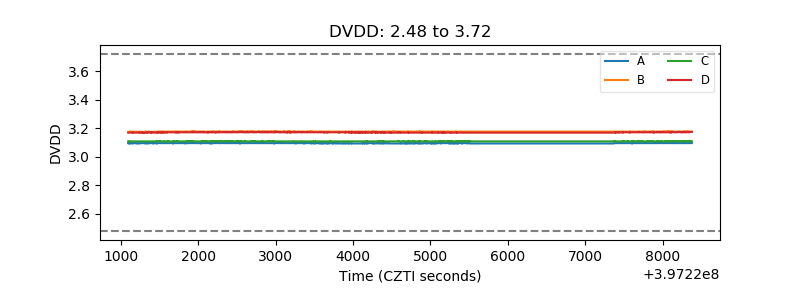 |
| Temperature 1 | 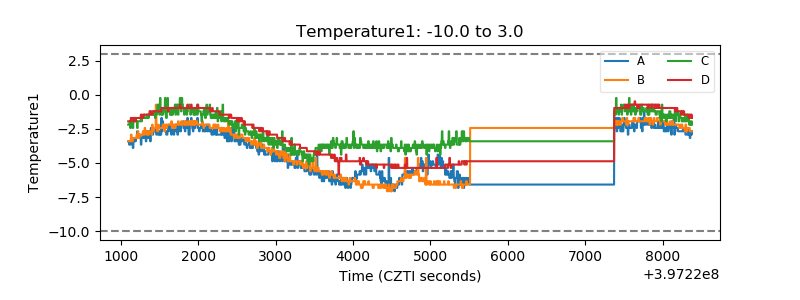 |
| Veto HV Monitor | 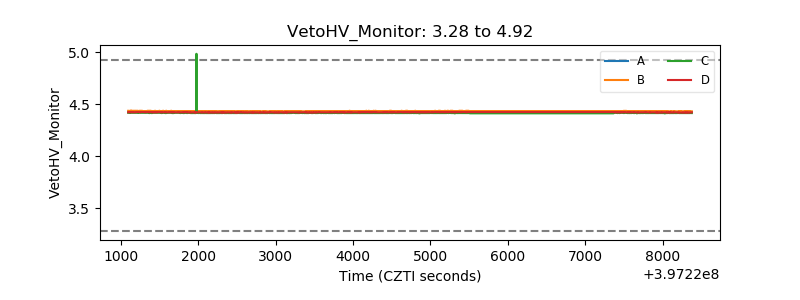 |
| Veto LLD | 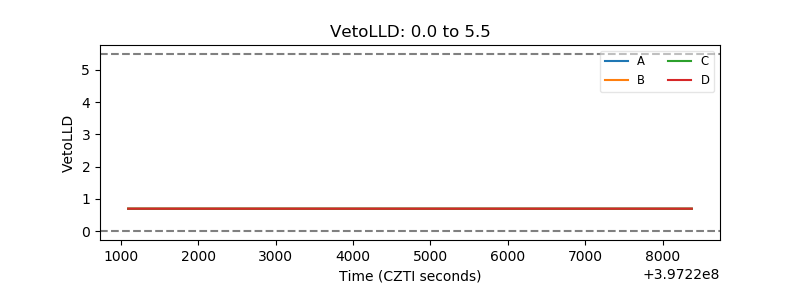 |
| Alpha Counter | 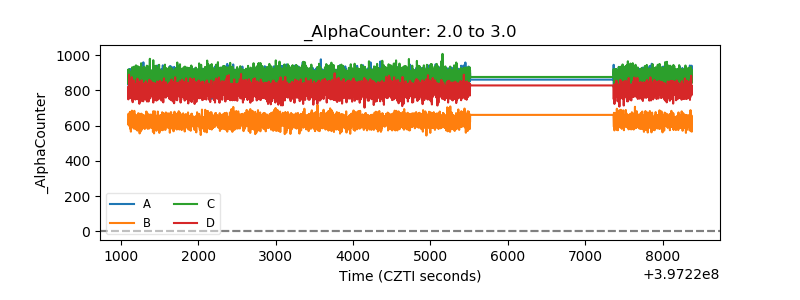 |
| _CPM_Rate | 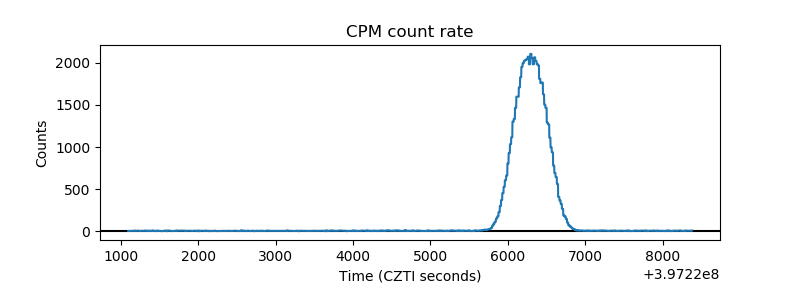 |
| CZT Counter | 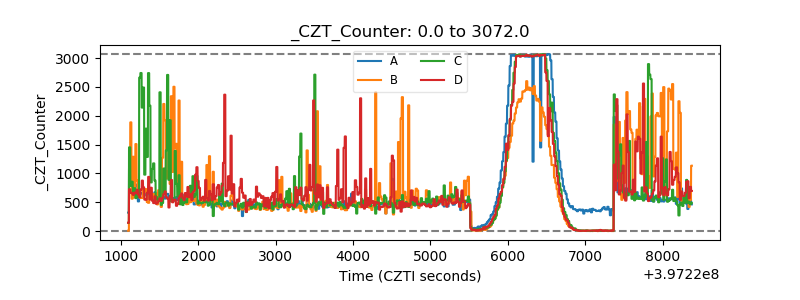 |
| +2.5 Volts monitor | 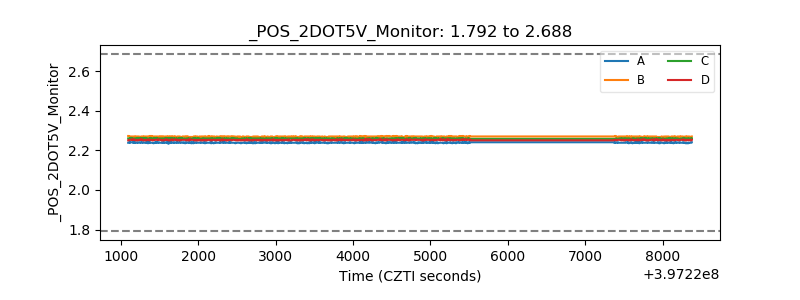 |
| +5 Volts monitor | 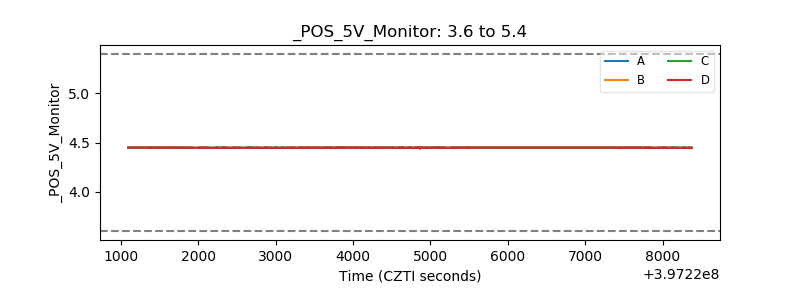 |
| _ROLL_ROT | 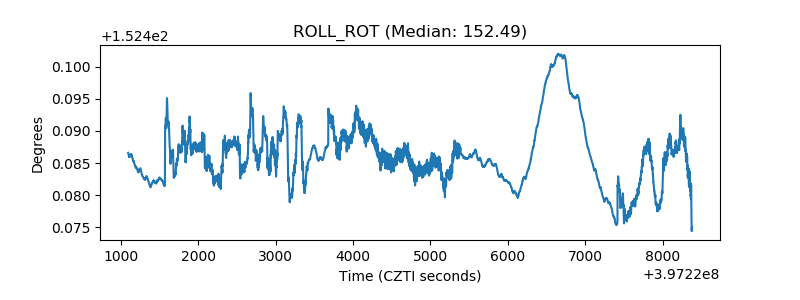 |
| _Roll_DEC | 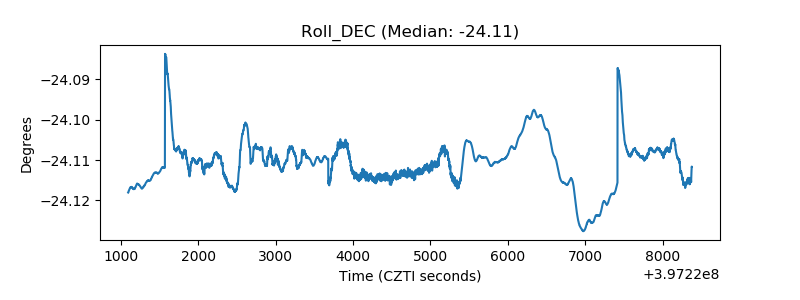 |
| _Roll_RA | 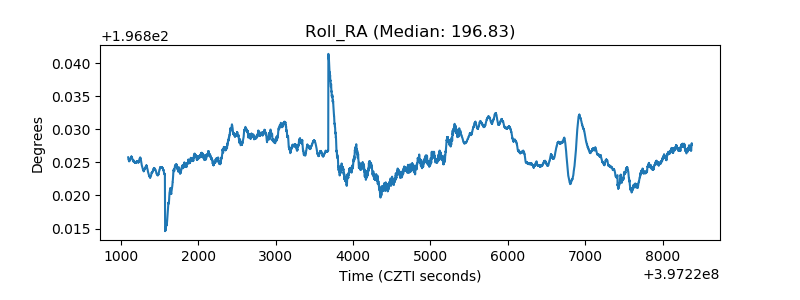 |
| Veto Counter | 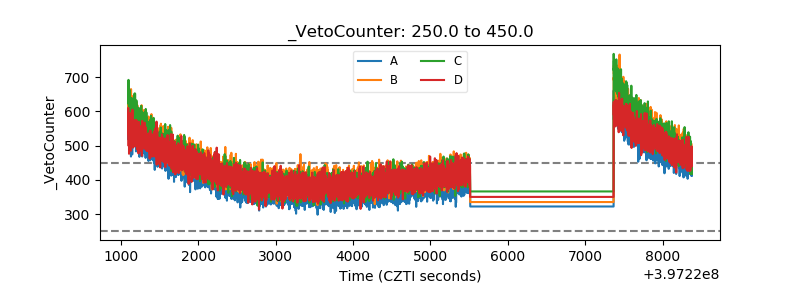 |