| Param | Original file | Final file |
|---|---|---|
| Filename | modeM0/AS1T05_046T01_9000005266_37027cztM0_level2.evt | modeM0/AS1T05_046T01_9000005266_37027cztM0_level2_quad_clean.evt |
| Size (bytes) | 496,356,480 | 69,531,840 |
| Size | 473.4 MB | 66.3 MB |
| Events in quadrant A | 2,639,886 | 467,243 |
| Events in quadrant B | 4,694,383 | 425,007 |
| Events in quadrant C | 3,076,287 | 436,989 |
| Events in quadrant D | 4,279,345 | 421,852 |
| Mode M0 | |||
|---|---|---|---|
| Quadrant | BADHDUFLAG | Total packets | Discarded packets |
| A | 0 | 10900 | 2 |
| B | 0 | 17206 | 1 |
| C | 0 | 12221 | 1 |
| D | 0 | 16172 | 1 |
| Mode SS | |||
|---|---|---|---|
| Quadrant | BADHDUFLAG | Total packets | Discarded packets |
| A | 0 | 102 | 0 |
| B | 0 | 102 | 0 |
| C | 0 | 102 | 0 |
| D | 0 | 102 | 0 |
| Mode M9 | |||
|---|---|---|---|
| Quadrant | BADHDUFLAG | Total packets | Discarded packets |
| A | 0 | 20 | 0 |
| B | 0 | 20 | 0 |
| C | 0 | 20 | 0 |
| D | 0 | 20 | 0 |
| Quadrant | Total seconds | Saturated seconds | Saturation percentage |
|---|---|---|---|
| A | 5054 | 10 | 0.197863% |
| B | 5054 | 602 | 11.911357% |
| C | 5054 | 132 | 2.611793% |
| D | 5054 | 242 | 4.788287% |
Noise dominated data is calculated using 1-second bins in cleaned event files. If a bin has >2000 counts, and if more than 50% of those come from <1% of pixels, then it is considered to be noise-dominated and hence unusable.
| Quadrant | # 1 sec bins | Bins with >0 counts | Bins with >2000 counts | High rate bins dominated by noise | Noise dominated (total time) | Noise dominated (detector-on time) | Marked lightcurve |
|---|---|---|---|---|---|---|---|
| A | 7026 | 5055 | 4 | 4 | 0.06% | 0.08% | 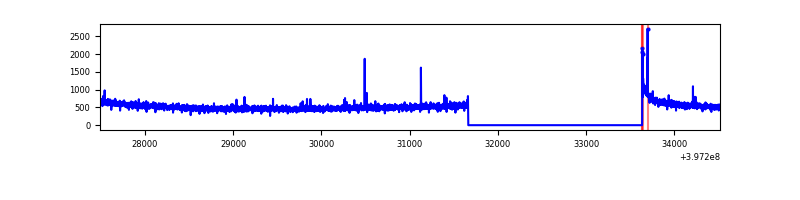 |
| B | 7026 | 5055 | 516 | 516 | 7.34% | 10.21% | 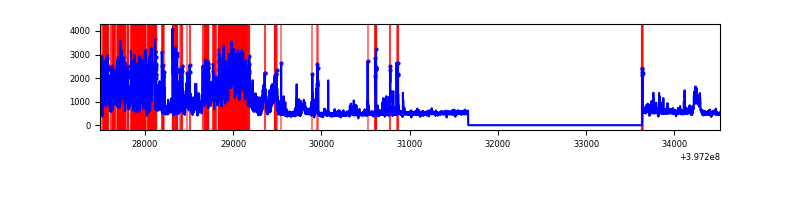 |
| C | 7026 | 5055 | 117 | 117 | 1.67% | 2.31% | 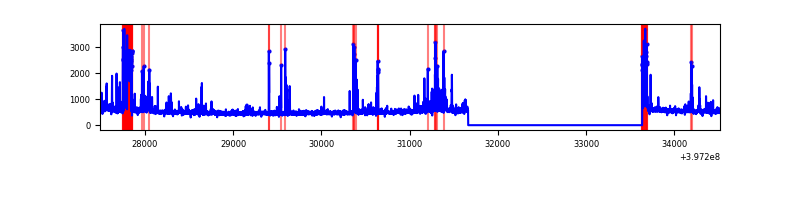 |
| D | 7026 | 5055 | 218 | 218 | 3.10% | 4.31% | 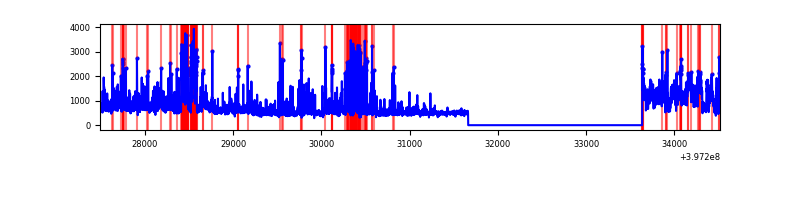 |
Top three noisy pixels from each quadrant. If the there are fewer than three noisy pixels in the level2.evt file, extra rows are filled as -1
| Pixel properties | Quadrant properties | ||||||
|---|---|---|---|---|---|---|---|
| Quadrant | DetID | PixID | Counts | Sigma | Mean | Median | Sigma |
| A | 10 | 83 | 196248 | 1562.74 | 624 | 615 | 125.2 |
| A | 9 | 143 | 17548 | 135.26 | 624 | 615 | 125.2 |
| A | 13 | 6 | 13145 | 100.09 | 624 | 615 | 125.2 |
| B | 5 | 184 | 2031672 | 18155.92 | 587 | 573 | 111.9 |
| B | 5 | 172 | 229341 | 2044.95 | 587 | 573 | 111.9 |
| B | 4 | 81 | 23426 | 204.28 | 587 | 573 | 111.9 |
| C | 1 | 23 | 237606 | 1756.83 | 583 | 587 | 134.9 |
| C | 15 | 214 | 214244 | 1583.67 | 583 | 587 | 134.9 |
| C | 0 | 10 | 118212 | 871.86 | 583 | 587 | 134.9 |
| D | 12 | 235 | 775559 | 5420.23 | 588 | 573 | 143.0 |
| D | 2 | 250 | 443398 | 3097.11 | 588 | 573 | 143.0 |
| D | 2 | 153 | 261420 | 1824.36 | 588 | 573 | 143.0 |
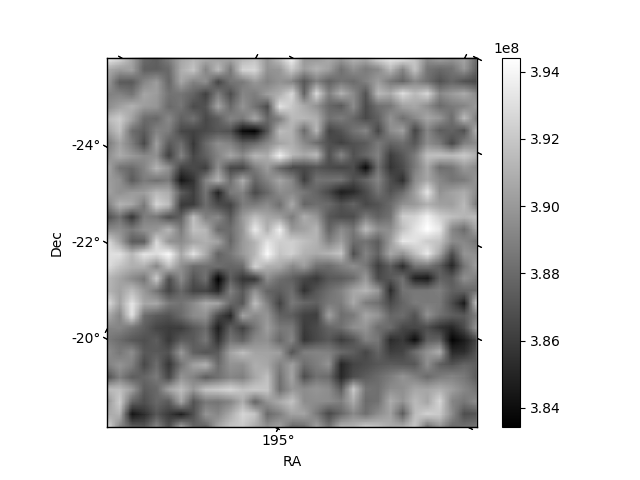
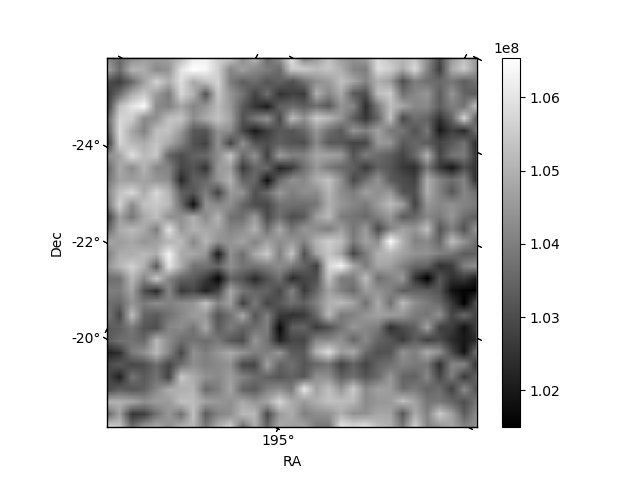
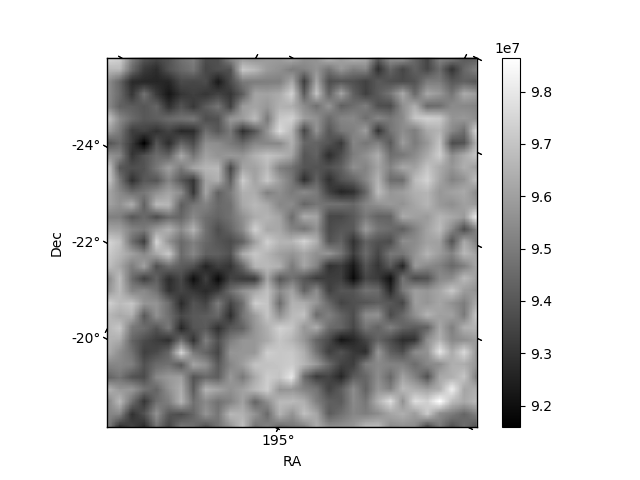
Histogram calculated using DETX and DETY for each event in the final _common_clean file
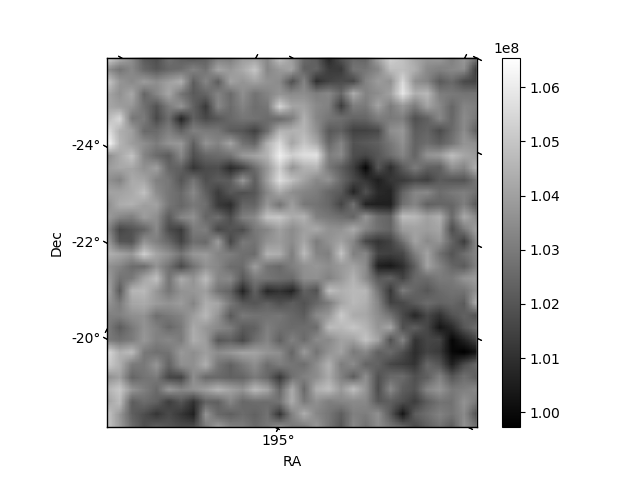
| Quadrant A | 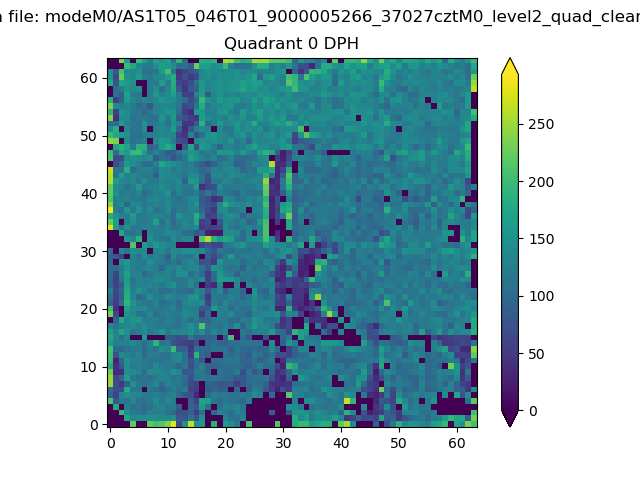 |
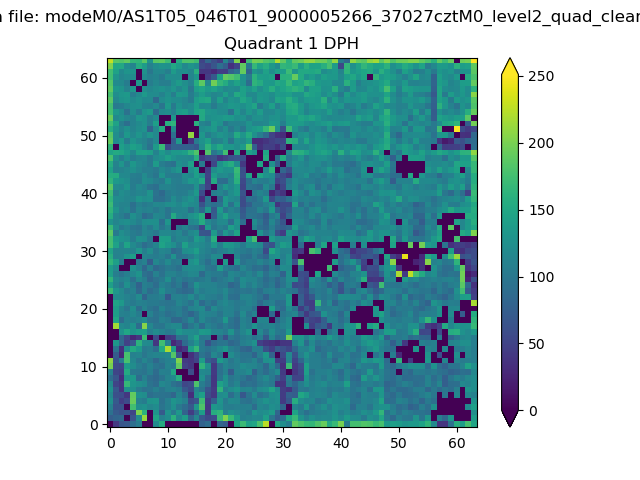 |
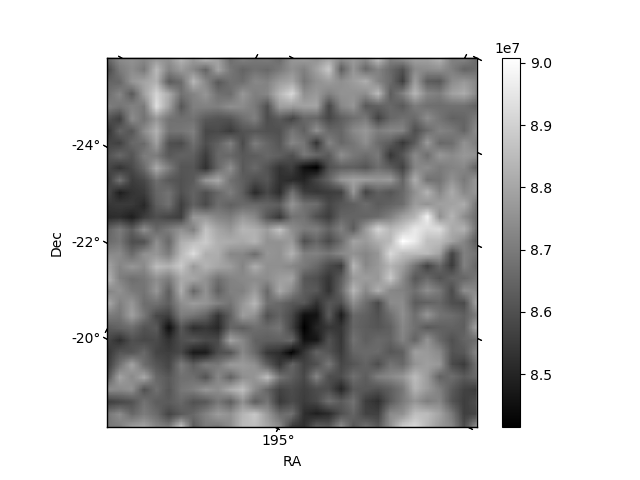
Quadrant B |
|---|---|---|---|
| Quadrant D | 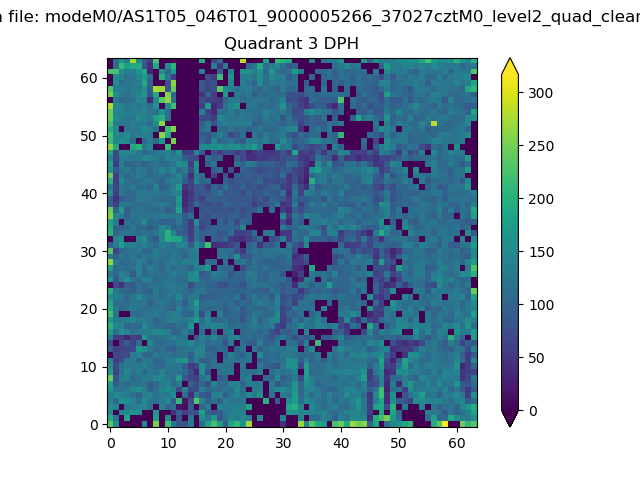 |
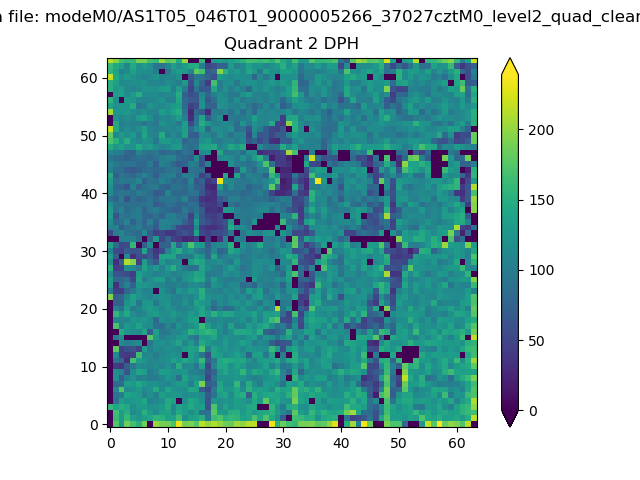 |
Quadrant C |
| Plot type | Count rate plots | Images |
|---|---|---|
| Comparison with Poisson distribution Blue bars denote a histogram of data divided into 1 sec bins. Red curve is a Poisson curve with rate = median count rate of data. |
 |
 |
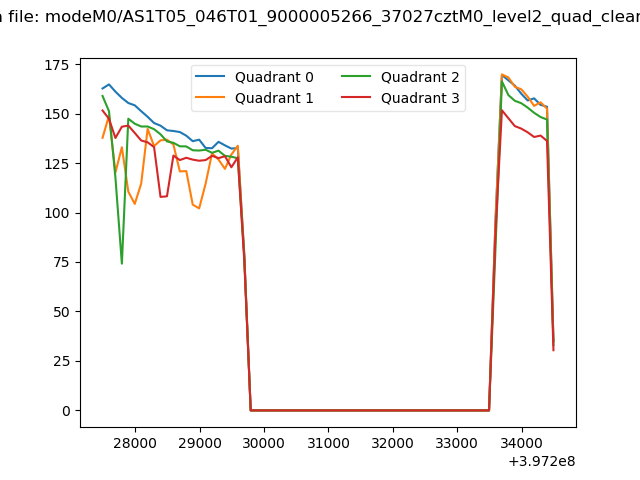
| Quadrant-wise count rates Data is divided into 100 sec bins |
 |
|
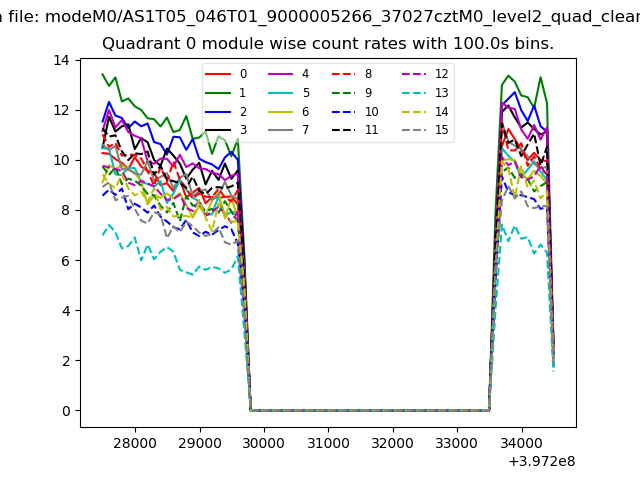
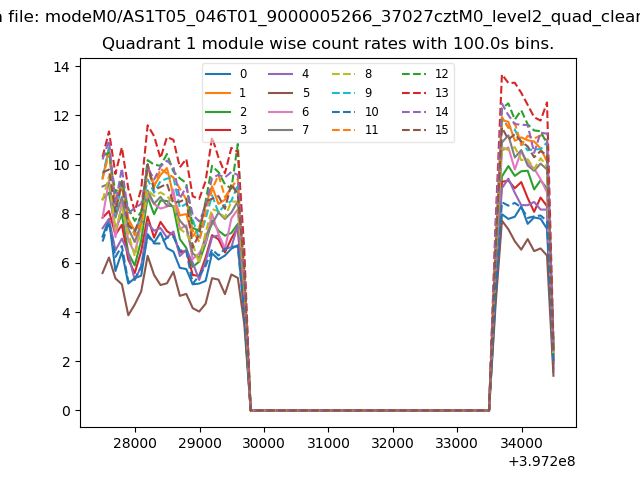
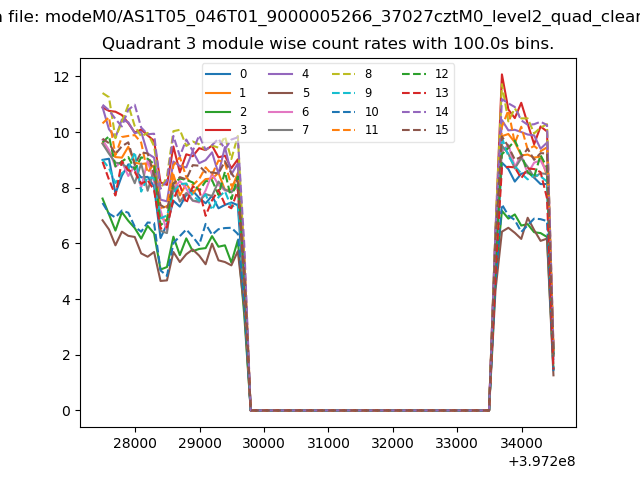
| Module-wise count rates for Quadrant A Data is divided into 100 sec bins |
 |
 |
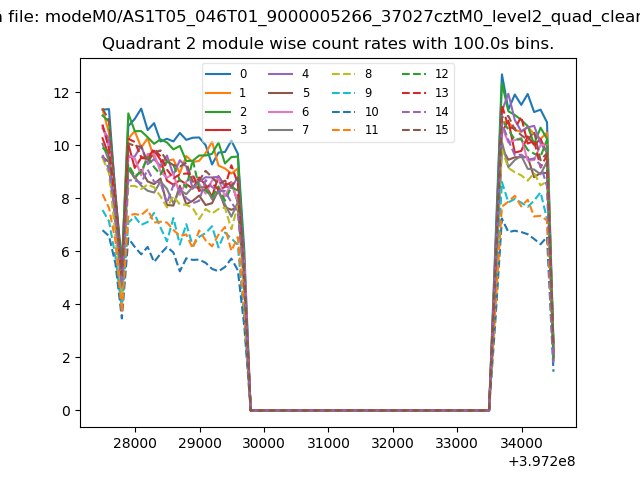
| Module-wise count rates for Quadrant B Data is divided into 100 sec bins |
 |
 |
| Module-wise count rates for Quadrant C Data is divided into 100 sec bins |
 |
 |
| Module-wise count rates for Quadrant D Data is divided into 100 sec bins |
 |
 |
| Parameter | Plot |
|---|---|
| CZT HV Monitor | 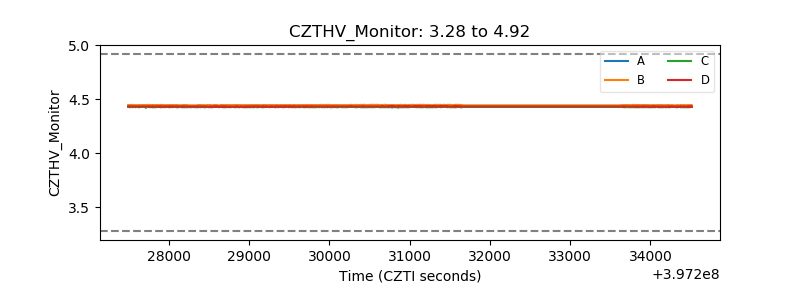 |
| D_VDD | 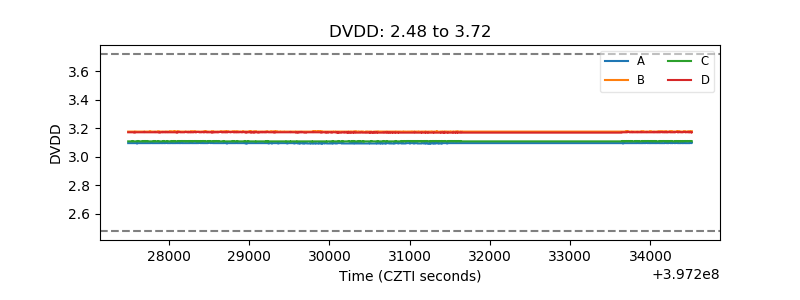 |
| Temperature 1 |  |
| Veto HV Monitor | 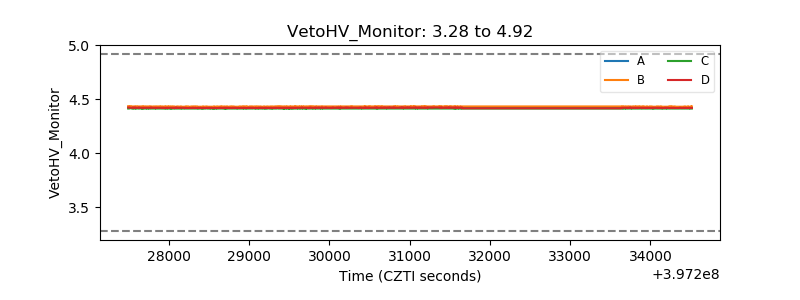 |
| Veto LLD | 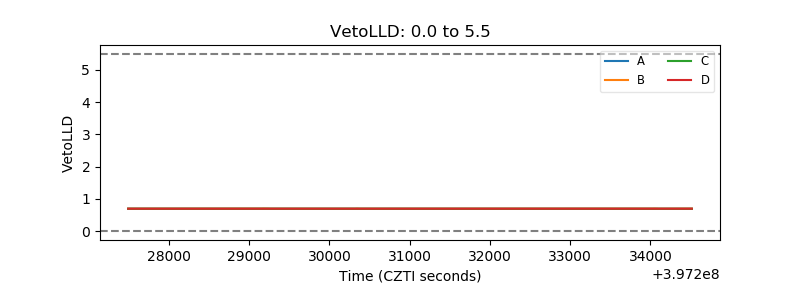 |
| Alpha Counter |  |
| _CPM_Rate | 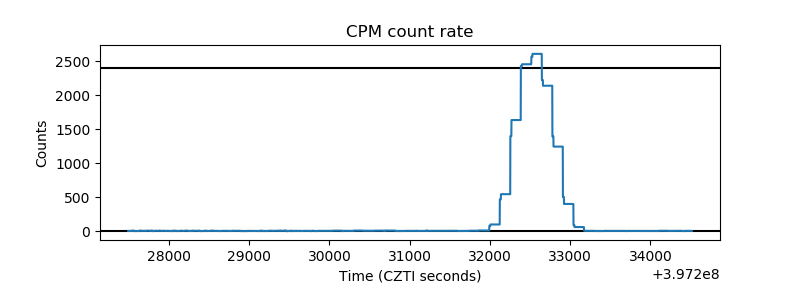 |
| CZT Counter | 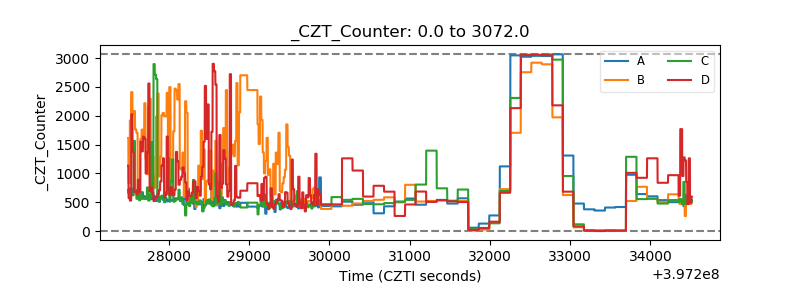 |
| +2.5 Volts monitor | 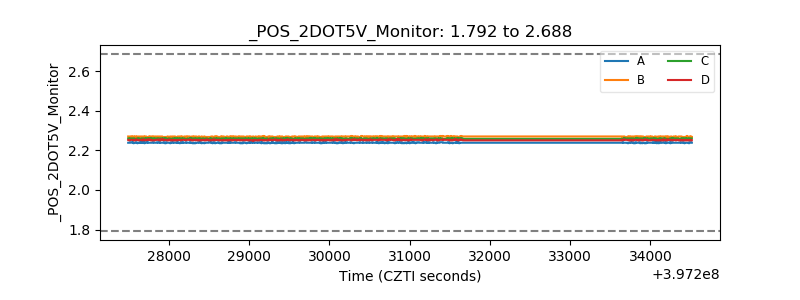 |
| +5 Volts monitor |  |
| _ROLL_ROT | 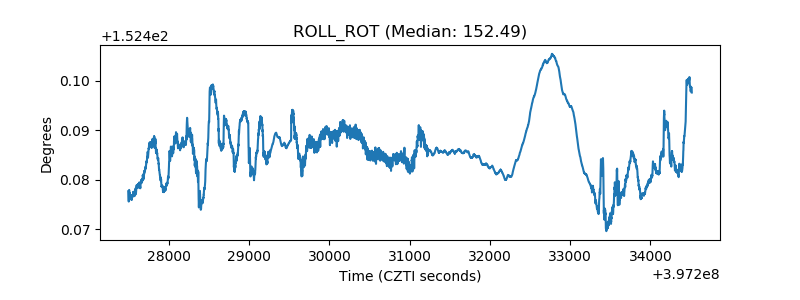 |
| _Roll_DEC | 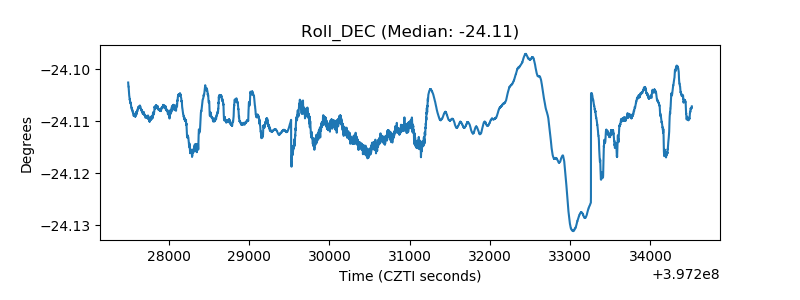 |
| _Roll_RA | 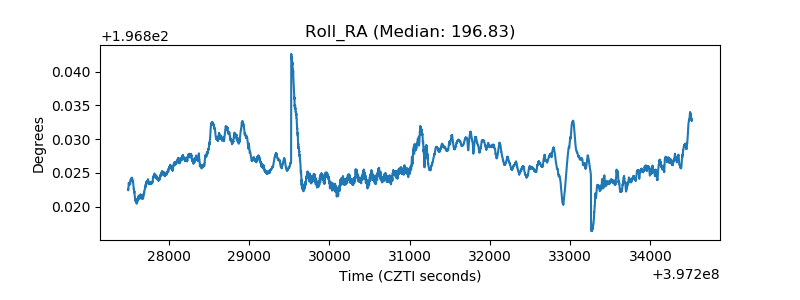 |
| Veto Counter | 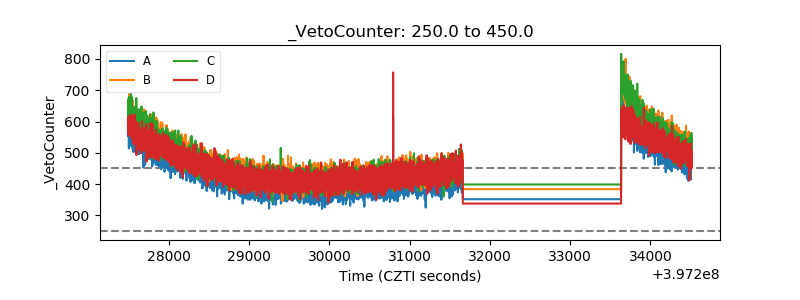 |