| Param | Original file | Final file |
|---|---|---|
| Filename | modeM0/AS1T05_046T01_9000005266_37028cztM0_level2.evt | modeM0/AS1T05_046T01_9000005266_37028cztM0_level2_quad_clean.evt |
| Size (bytes) | 441,570,240 | 62,110,080 |
| Size | 421.1 MB | 59.2 MB |
| Events in quadrant A | 2,606,868 | 405,585 |
| Events in quadrant B | 3,069,233 | 402,262 |
| Events in quadrant C | 2,901,575 | 386,072 |
| Events in quadrant D | 4,462,914 | 342,763 |
| Mode M0 | |||
|---|---|---|---|
| Quadrant | BADHDUFLAG | Total packets | Discarded packets |
| A | 0 | 10698 | 3 |
| B | 0 | 12169 | 2 |
| C | 0 | 11540 | 2 |
| D | 0 | 16488 | 2 |
| Mode SS | |||
|---|---|---|---|
| Quadrant | BADHDUFLAG | Total packets | Discarded packets |
| A | 0 | 100 | 0 |
| B | 0 | 100 | 0 |
| C | 0 | 100 | 0 |
| D | 0 | 100 | 0 |
| Mode M9 | |||
|---|---|---|---|
| Quadrant | BADHDUFLAG | Total packets | Discarded packets |
| A | 0 | 27 | 0 |
| B | 0 | 27 | 0 |
| C | 0 | 27 | 0 |
| D | 0 | 28 | 0 |
| Quadrant | Total seconds | Saturated seconds | Saturation percentage |
|---|---|---|---|
| A | 4898 | 14 | 0.285831% |
| B | 4898 | 80 | 1.633320% |
| C | 4898 | 79 | 1.612903% |
| D | 4898 | 460 | 9.391588% |
Noise dominated data is calculated using 1-second bins in cleaned event files. If a bin has >2000 counts, and if more than 50% of those come from <1% of pixels, then it is considered to be noise-dominated and hence unusable.
| Quadrant | # 1 sec bins | Bins with >0 counts | Bins with >2000 counts | High rate bins dominated by noise | Noise dominated (total time) | Noise dominated (detector-on time) | Marked lightcurve |
|---|---|---|---|---|---|---|---|
| A | 6960 | 4899 | 7 | 7 | 0.10% | 0.14% | 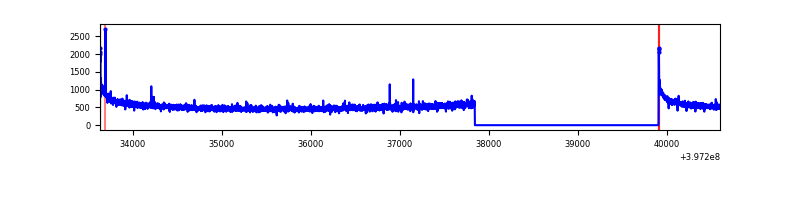 |
| B | 6960 | 4899 | 65 | 65 | 0.93% | 1.33% | 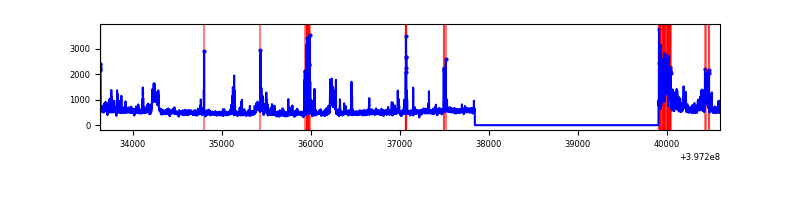 |
| C | 6960 | 4899 | 68 | 68 | 0.98% | 1.39% | 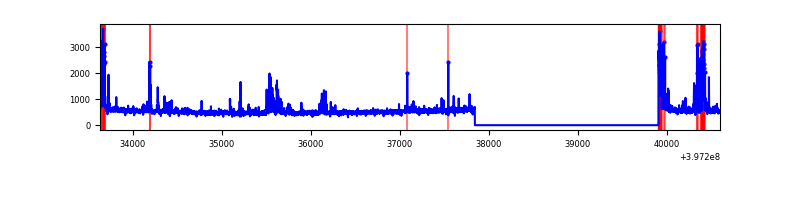 |
| D | 6960 | 4899 | 434 | 434 | 6.24% | 8.86% | 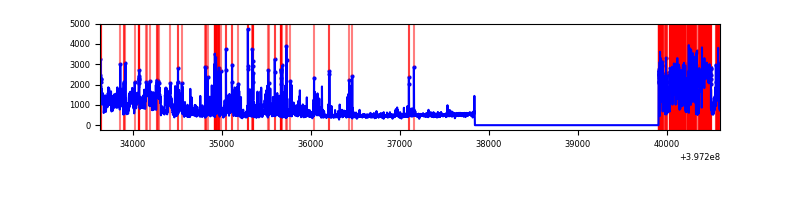 |
Top three noisy pixels from each quadrant. If the there are fewer than three noisy pixels in the level2.evt file, extra rows are filled as -1
| Pixel properties | Quadrant properties | ||||||
|---|---|---|---|---|---|---|---|
| Quadrant | DetID | PixID | Counts | Sigma | Mean | Median | Sigma |
| A | 10 | 83 | 224129 | 1834.78 | 608 | 598 | 121.8 |
| A | 13 | 6 | 14952 | 117.82 | 608 | 598 | 121.8 |
| A | 9 | 143 | 7826 | 59.33 | 608 | 598 | 121.8 |
| B | 5 | 184 | 412510 | 3634.79 | 600 | 587 | 113.3 |
| B | 5 | 172 | 139992 | 1230.1 | 600 | 587 | 113.3 |
| B | 5 | 255 | 38777 | 336.99 | 600 | 587 | 113.3 |
| C | 15 | 214 | 211968 | 1575.72 | 577 | 583 | 134.2 |
| C | 14 | 254 | 188694 | 1402.23 | 577 | 583 | 134.2 |
| C | 0 | 10 | 162630 | 1207.94 | 577 | 583 | 134.2 |
| D | 12 | 235 | 705128 | 5170.16 | 560 | 546 | 136.3 |
| D | 13 | 249 | 685831 | 5028.56 | 560 | 546 | 136.3 |
| D | 2 | 250 | 292118 | 2139.53 | 560 | 546 | 136.3 |
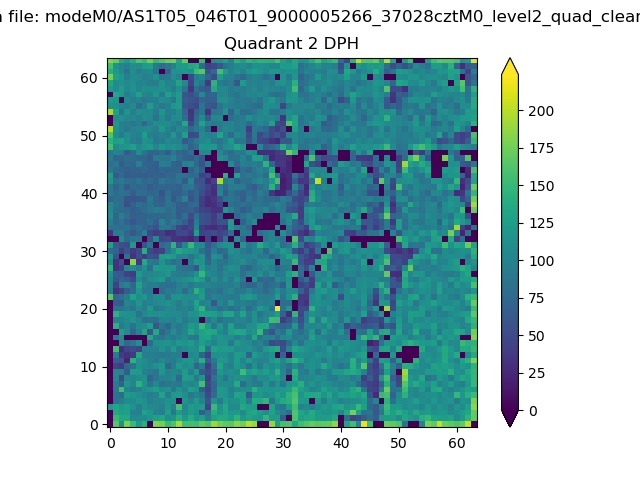
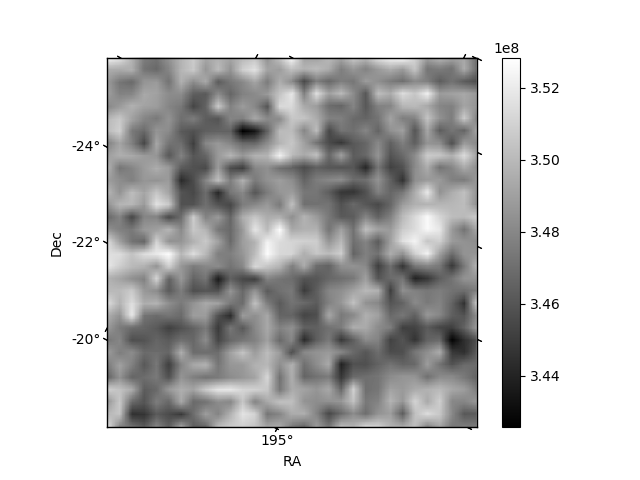
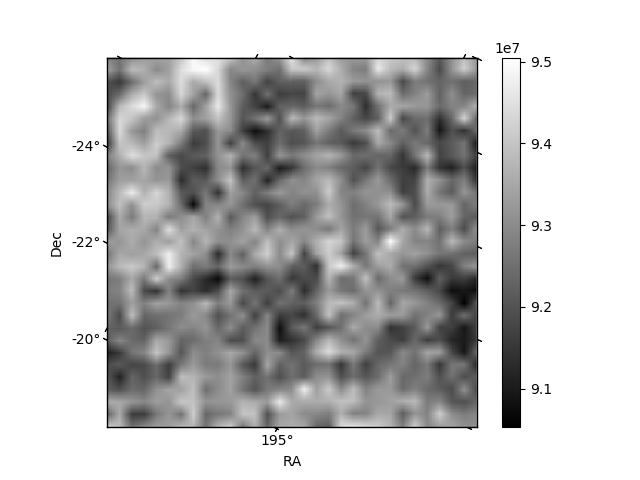
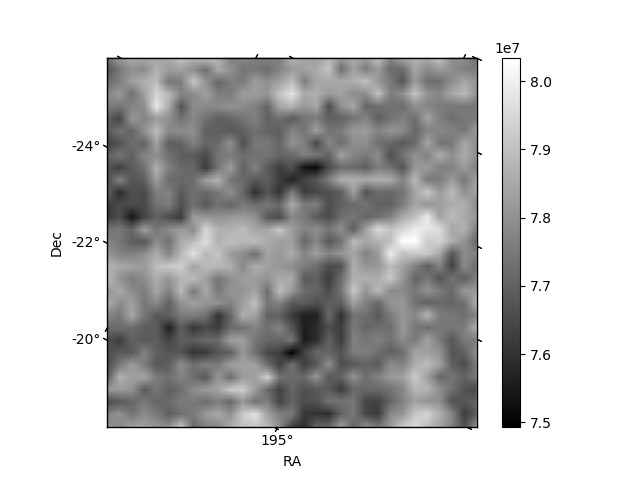
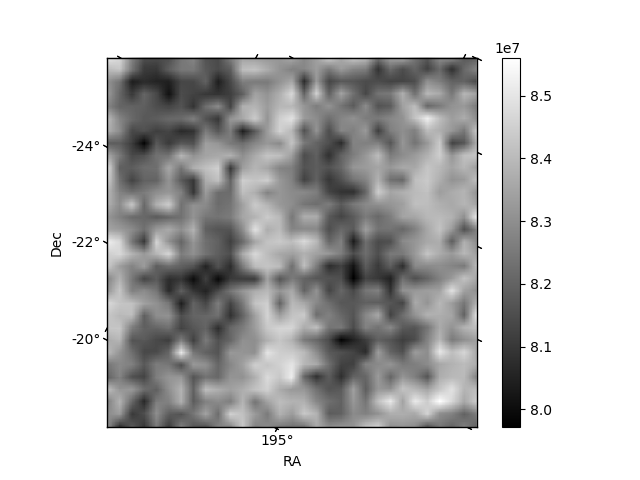
Histogram calculated using DETX and DETY for each event in the final _common_clean file
| Quadrant A | 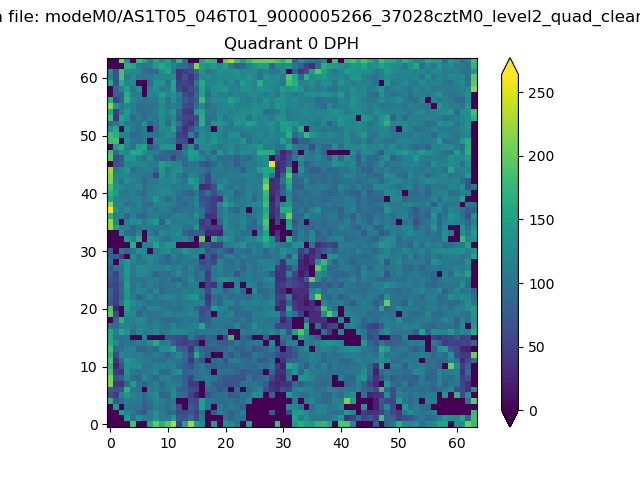 |
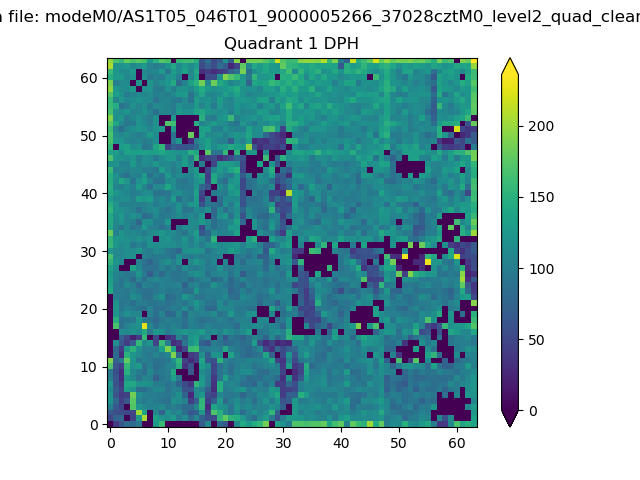 |
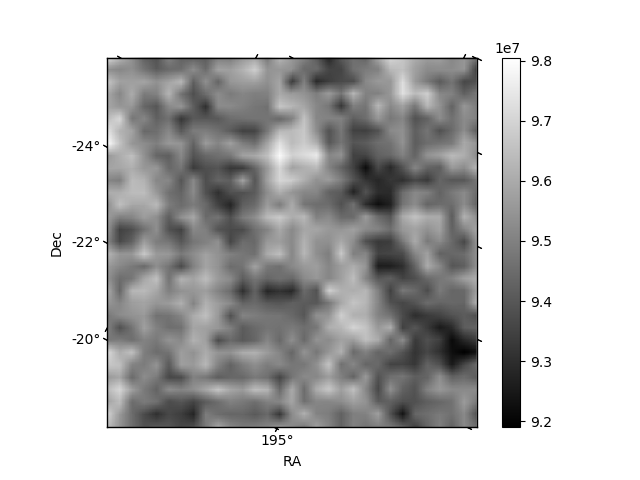
Quadrant B |
|---|---|---|---|
| Quadrant D | 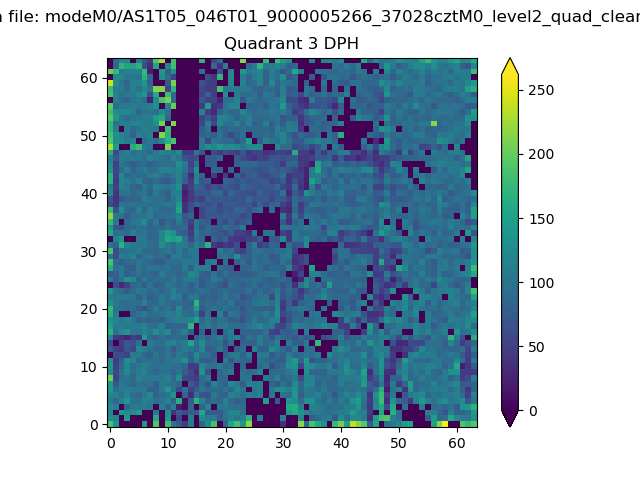 |
 |
Quadrant C |
| Plot type | Count rate plots | Images |
|---|---|---|
| Comparison with Poisson distribution Blue bars denote a histogram of data divided into 1 sec bins. Red curve is a Poisson curve with rate = median count rate of data. |
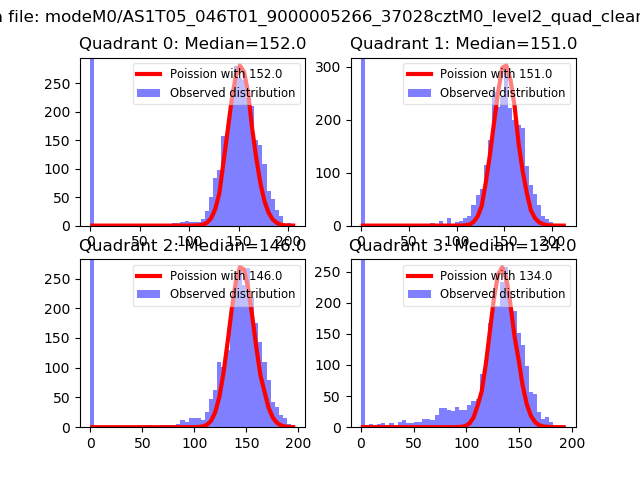 |
 |
| Quadrant-wise count rates Data is divided into 100 sec bins |
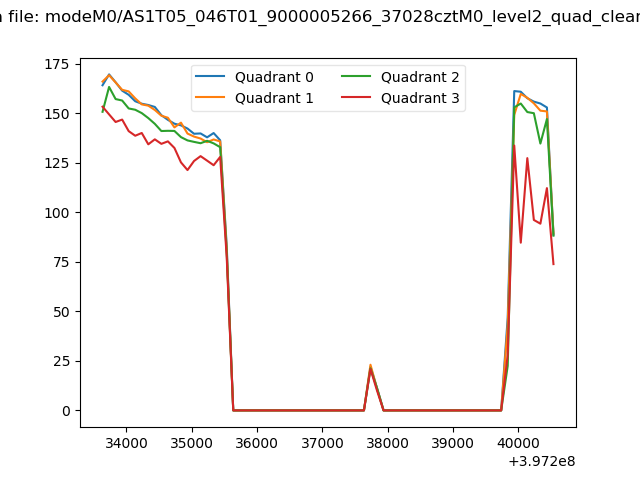 |
|
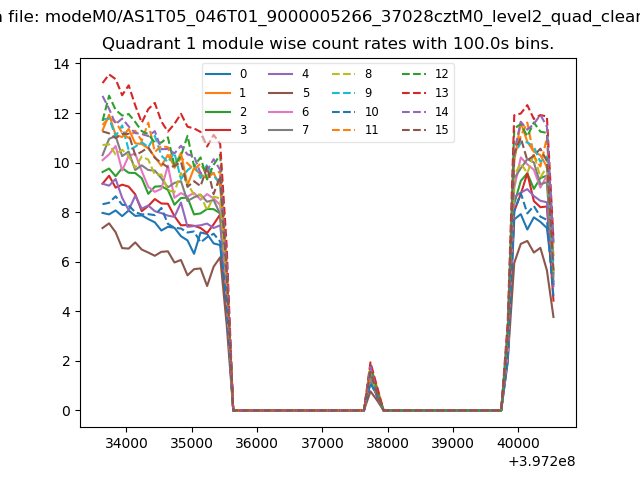
| Module-wise count rates for Quadrant A Data is divided into 100 sec bins |
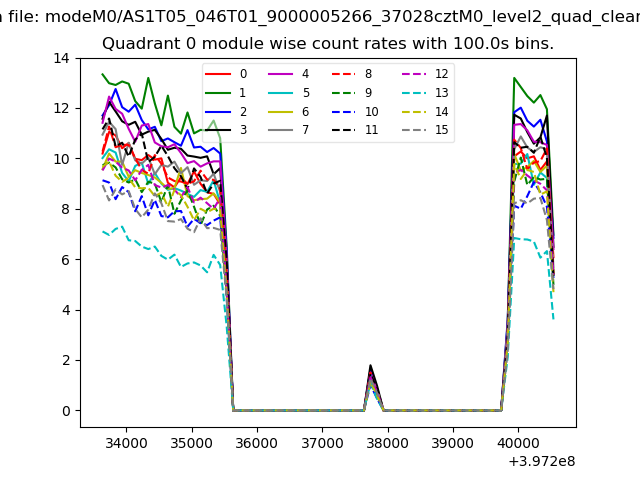 |
 |
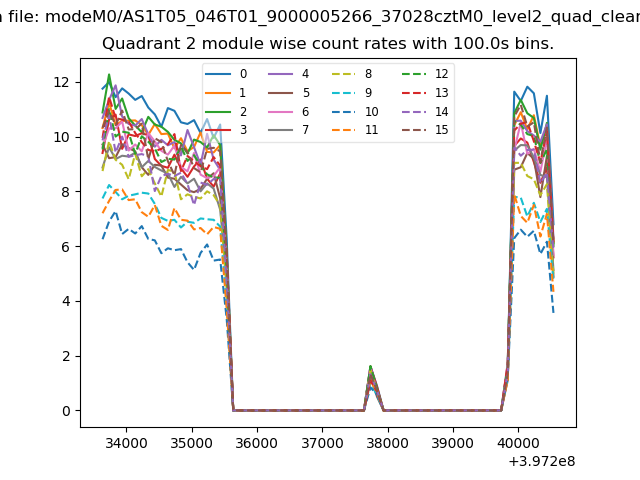
| Module-wise count rates for Quadrant B Data is divided into 100 sec bins |
 |
 |
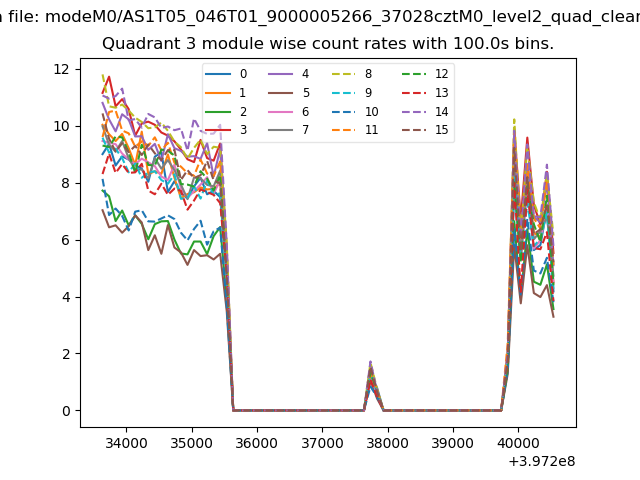
| Module-wise count rates for Quadrant C Data is divided into 100 sec bins |
 |
 |
| Module-wise count rates for Quadrant D Data is divided into 100 sec bins |
 |
 |
| Parameter | Plot |
|---|---|
| CZT HV Monitor | 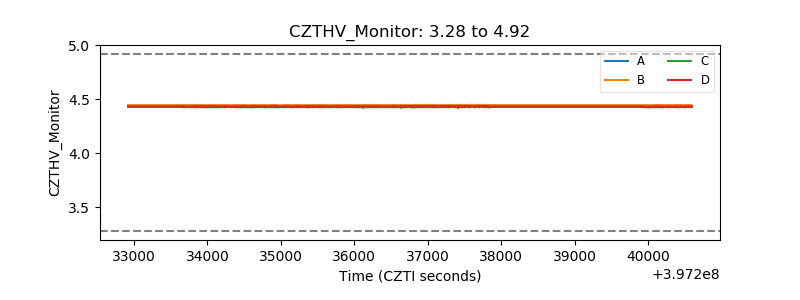 |
| D_VDD | 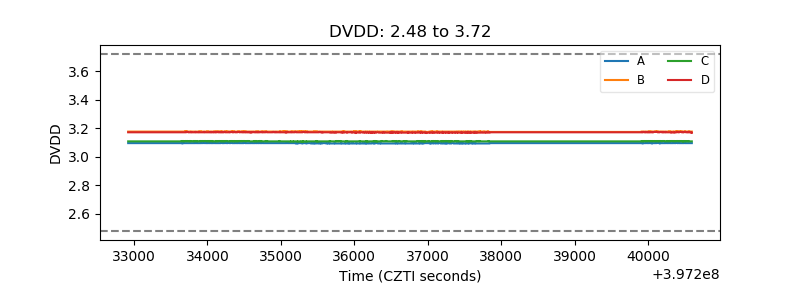 |
| Temperature 1 | 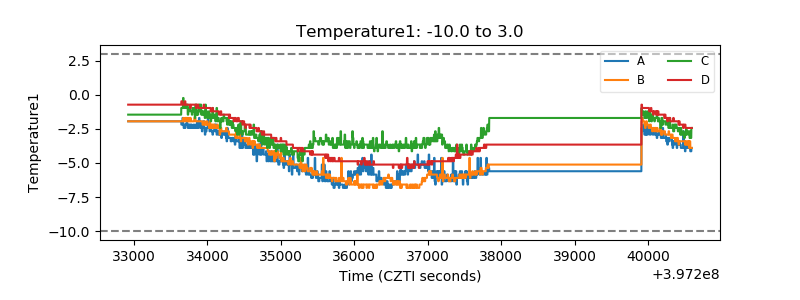 |
| Veto HV Monitor | 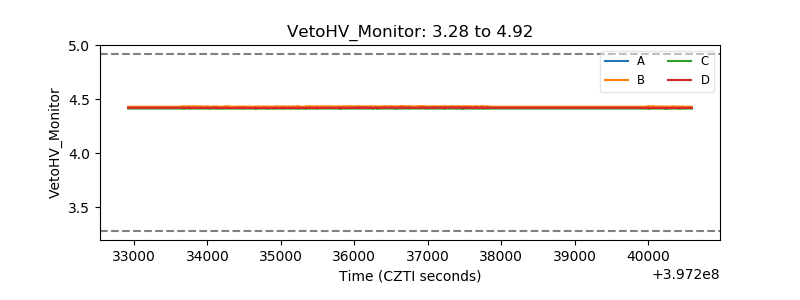 |
| Veto LLD | 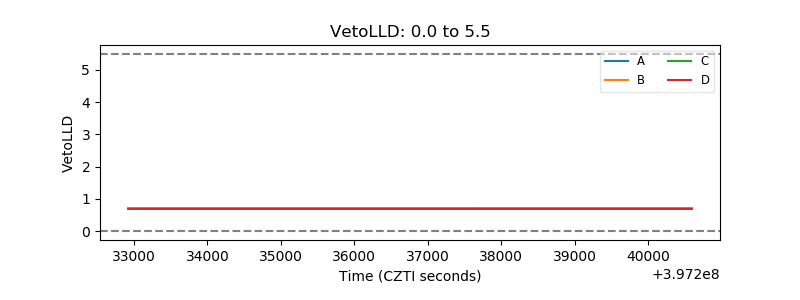 |
| Alpha Counter | 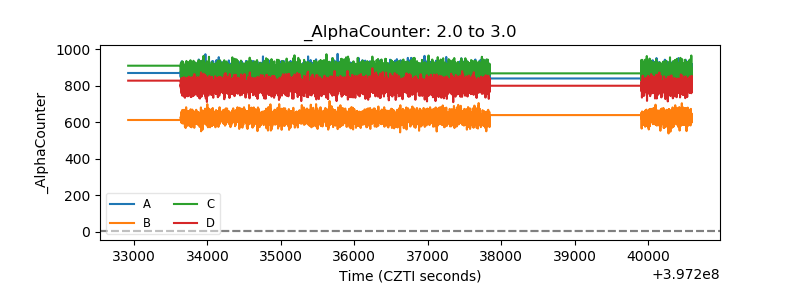 |
| _CPM_Rate | 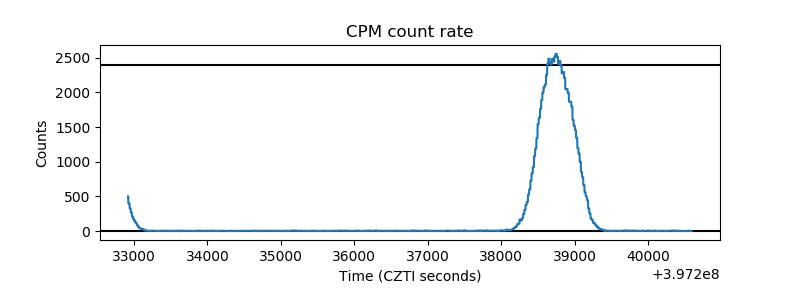 |
| CZT Counter | 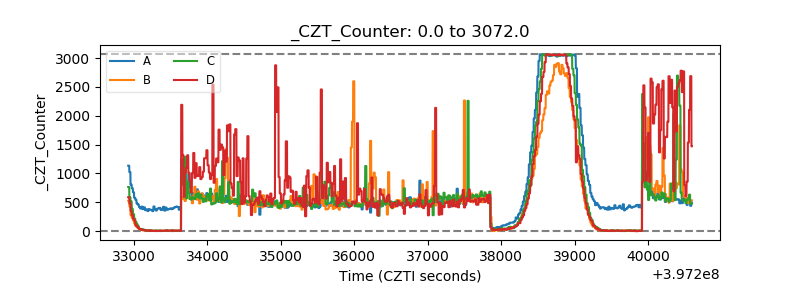 |
| +2.5 Volts monitor | 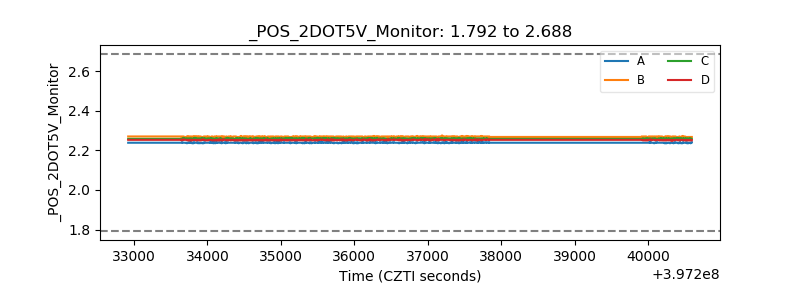 |
| +5 Volts monitor | 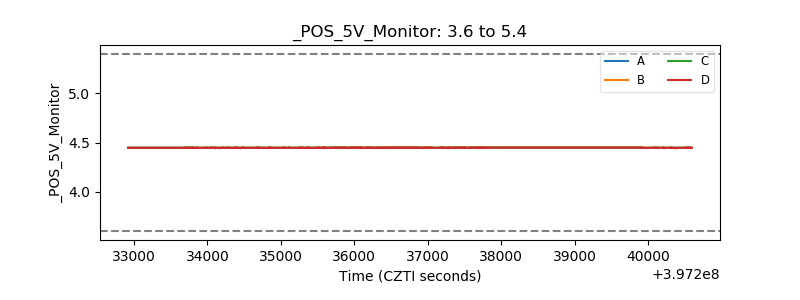 |
| _ROLL_ROT | 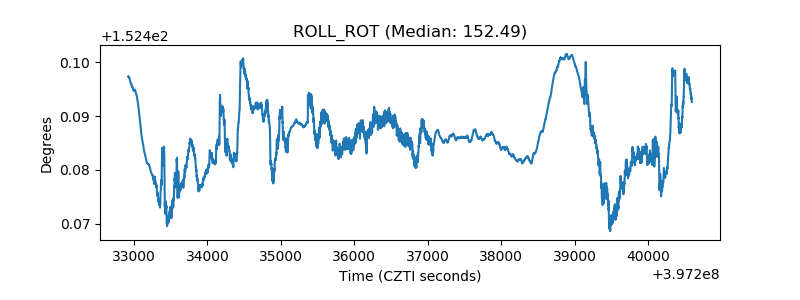 |
| _Roll_DEC | 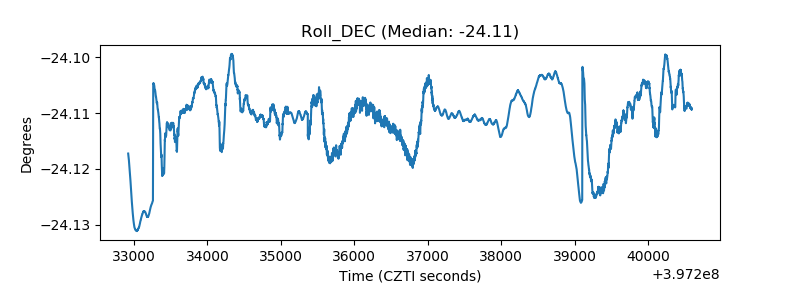 |
| _Roll_RA | 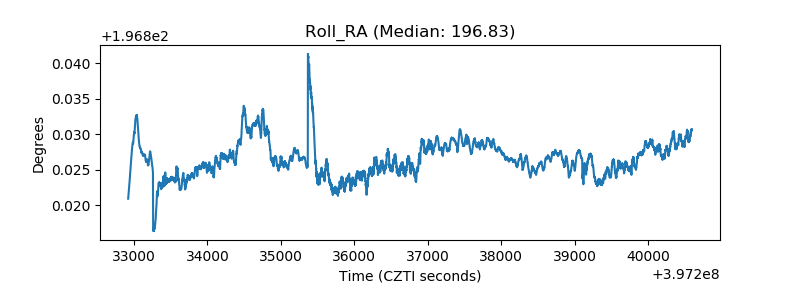 |
| Veto Counter | 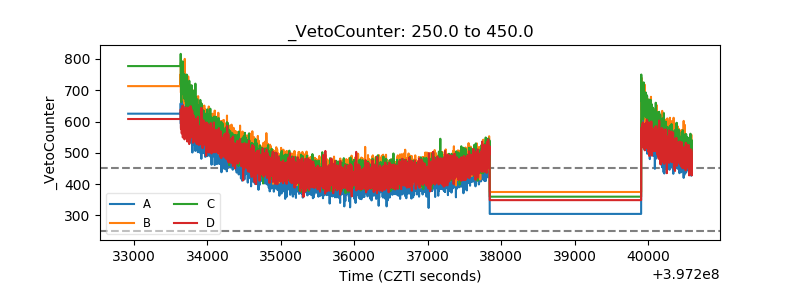 |