| Param | Original file | Final file |
|---|---|---|
| Filename | modeM0/AS1T05_046T01_9000005266_37029cztM0_level2.evt | modeM0/AS1T05_046T01_9000005266_37029cztM0_level2_quad_clean.evt |
| Size (bytes) | 467,945,280 | 58,890,240 |
| Size | 446.3 MB | 56.2 MB |
| Events in quadrant A | 2,539,401 | 382,985 |
| Events in quadrant B | 3,737,875 | 378,649 |
| Events in quadrant C | 3,080,771 | 365,952 |
| Events in quadrant D | 4,484,891 | 314,901 |
| Mode M0 | |||
|---|---|---|---|
| Quadrant | BADHDUFLAG | Total packets | Discarded packets |
| A | 0 | 10450 | 3 |
| B | 0 | 14159 | 2 |
| C | 0 | 12112 | 2 |
| D | 0 | 16464 | 2 |
| Mode SS | |||
|---|---|---|---|
| Quadrant | BADHDUFLAG | Total packets | Discarded packets |
| A | 0 | 100 | 0 |
| B | 0 | 100 | 0 |
| C | 0 | 100 | 0 |
| D | 0 | 100 | 0 |
| Mode M9 | |||
|---|---|---|---|
| Quadrant | BADHDUFLAG | Total packets | Discarded packets |
| A | 0 | 25 | 0 |
| B | 0 | 25 | 0 |
| C | 0 | 25 | 0 |
| D | 0 | 26 | 0 |
| Quadrant | Total seconds | Saturated seconds | Saturation percentage |
|---|---|---|---|
| A | 4844 | 7 | 0.144509% |
| B | 4844 | 199 | 4.108175% |
| C | 4844 | 137 | 2.828241% |
| D | 4844 | 651 | 13.439306% |
Noise dominated data is calculated using 1-second bins in cleaned event files. If a bin has >2000 counts, and if more than 50% of those come from <1% of pixels, then it is considered to be noise-dominated and hence unusable.
| Quadrant | # 1 sec bins | Bins with >0 counts | Bins with >2000 counts | High rate bins dominated by noise | Noise dominated (total time) | Noise dominated (detector-on time) | Marked lightcurve |
|---|---|---|---|---|---|---|---|
| A | 6967 | 4845 | 5 | 5 | 0.07% | 0.10% | 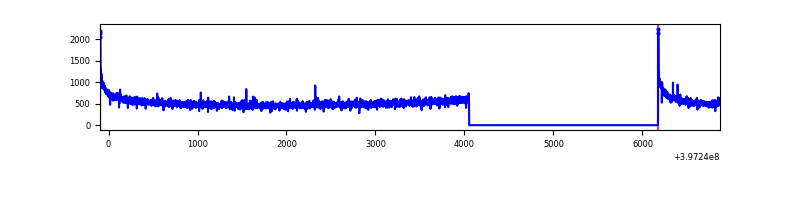 |
| B | 6966 | 4844 | 163 | 163 | 2.34% | 3.36% | 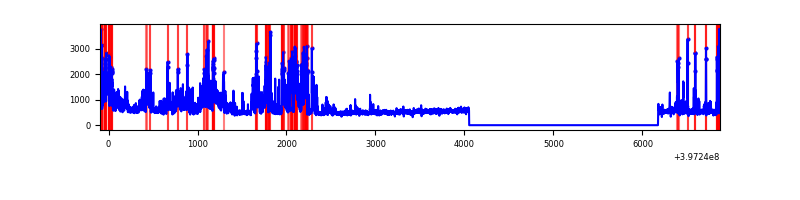 |
| C | 6967 | 4845 | 116 | 116 | 1.66% | 2.39% | 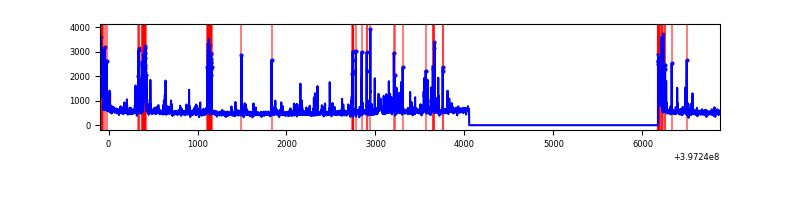 |
| D | 6967 | 4845 | 638 | 638 | 9.16% | 13.17% | 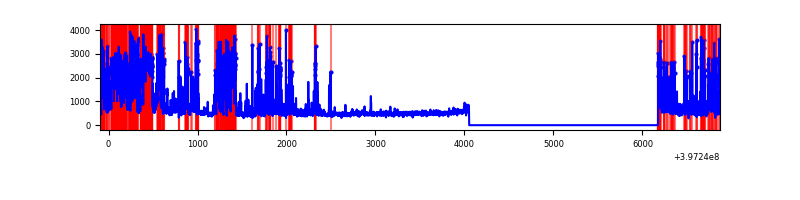 |
Top three noisy pixels from each quadrant. If the there are fewer than three noisy pixels in the level2.evt file, extra rows are filled as -1
| Pixel properties | Quadrant properties | ||||||
|---|---|---|---|---|---|---|---|
| Quadrant | DetID | PixID | Counts | Sigma | Mean | Median | Sigma |
| A | 10 | 83 | 224521 | 1883.19 | 593 | 585 | 118.9 |
| A | 13 | 6 | 16224 | 131.52 | 593 | 585 | 118.9 |
| A | 13 | 254 | 7570 | 58.74 | 593 | 585 | 118.9 |
| B | 5 | 184 | 1085181 | 9687.15 | 583 | 569 | 112.0 |
| B | 5 | 172 | 185290 | 1649.82 | 583 | 569 | 112.0 |
| B | 0 | 213 | 44602 | 393.28 | 583 | 569 | 112.0 |
| C | 14 | 254 | 278277 | 2144.03 | 559 | 564 | 129.5 |
| C | 15 | 214 | 207354 | 1596.48 | 559 | 564 | 129.5 |
| C | 0 | 207 | 185239 | 1425.75 | 559 | 564 | 129.5 |
| D | 13 | 249 | 772185 | 5893.27 | 532 | 518 | 130.9 |
| D | 2 | 250 | 621410 | 4741.79 | 532 | 518 | 130.9 |
| D | 2 | 153 | 210291 | 1602.05 | 532 | 518 | 130.9 |
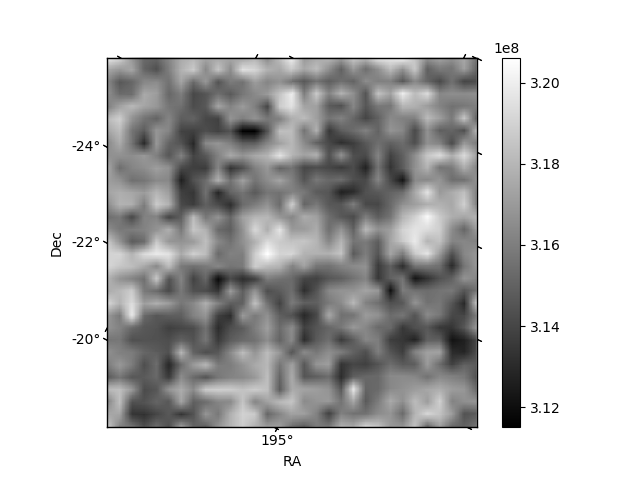
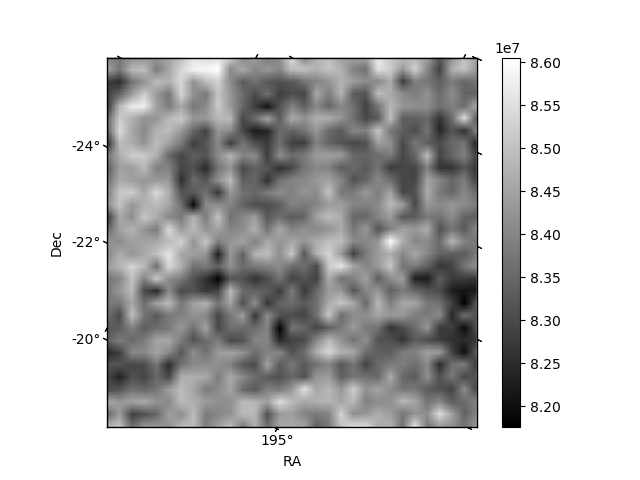
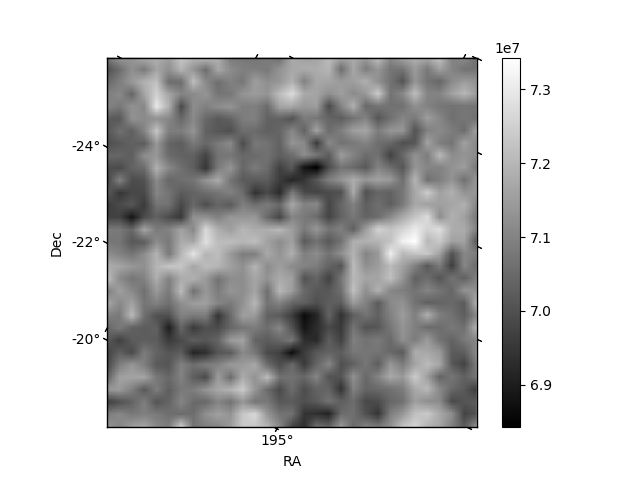
Histogram calculated using DETX and DETY for each event in the final _common_clean file
| Quadrant A | 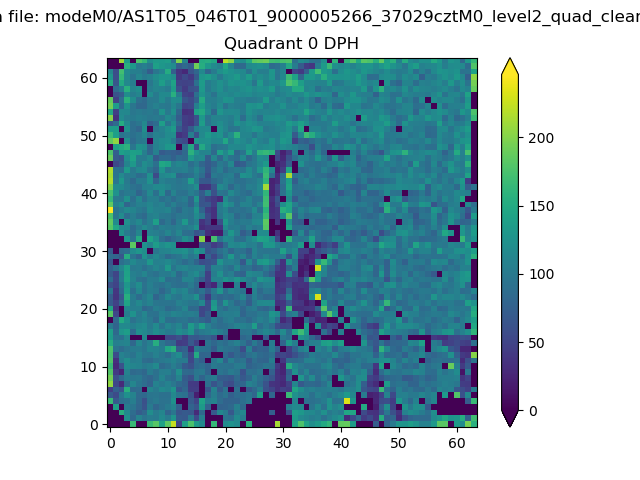 |
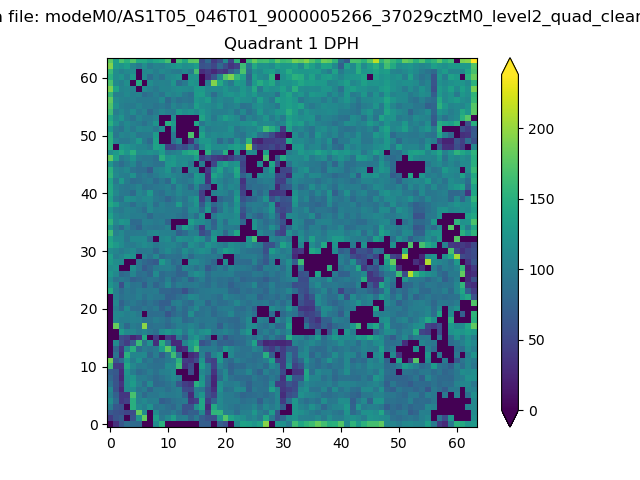 |
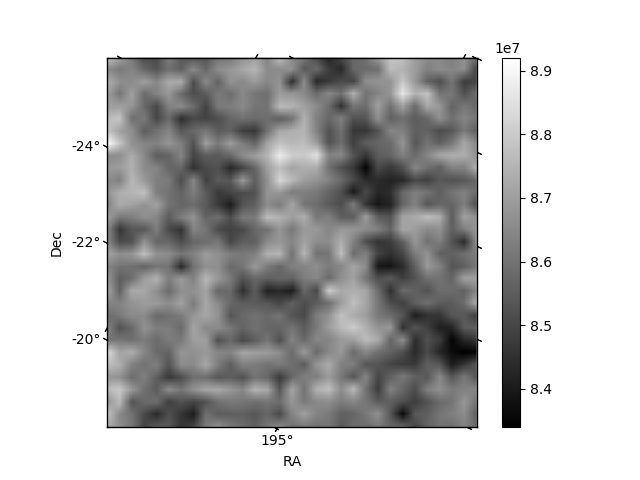
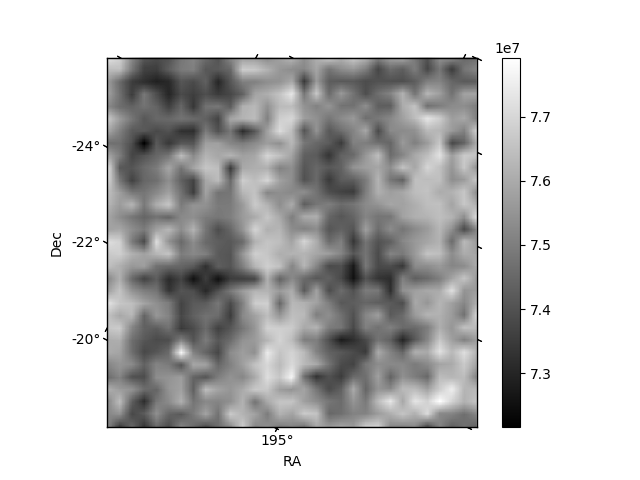
Quadrant B |
|---|---|---|---|
| Quadrant D | 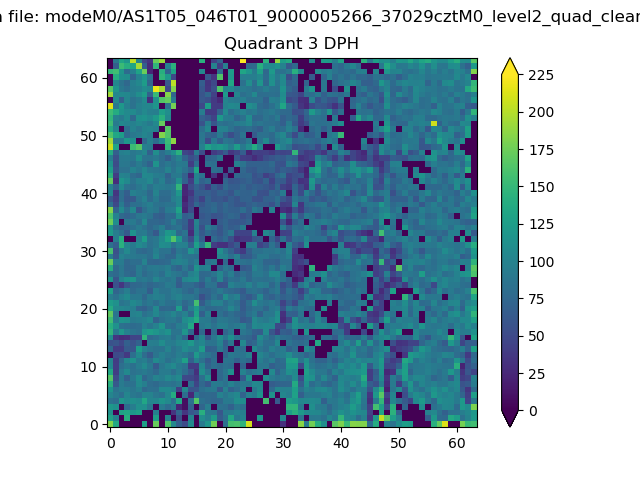 |
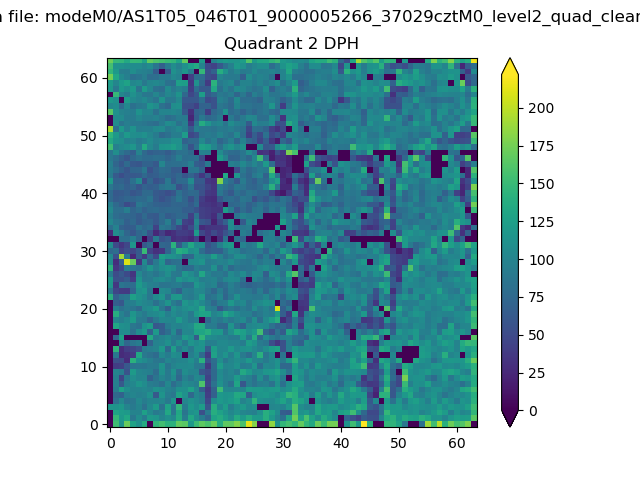 |
Quadrant C |
| Plot type | Count rate plots | Images |
|---|---|---|
| Comparison with Poisson distribution Blue bars denote a histogram of data divided into 1 sec bins. Red curve is a Poisson curve with rate = median count rate of data. |
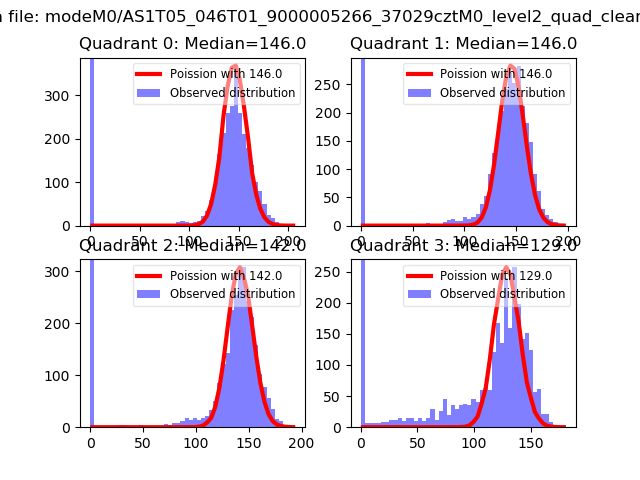 |
 |
| Quadrant-wise count rates Data is divided into 100 sec bins |
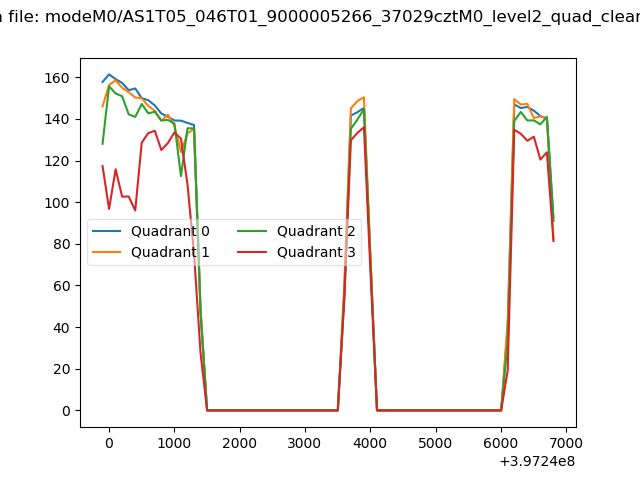 |
|
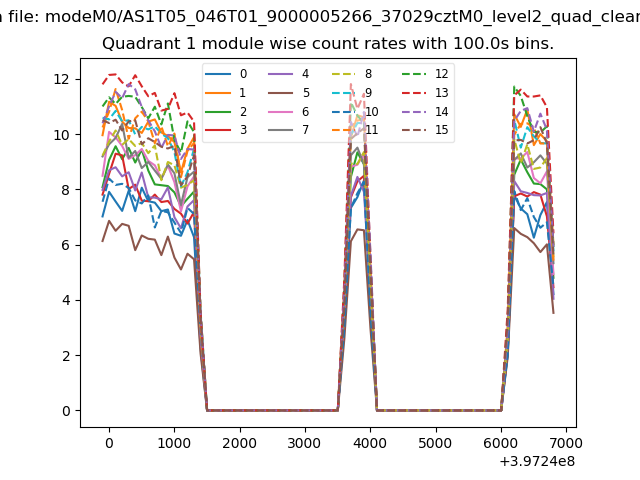
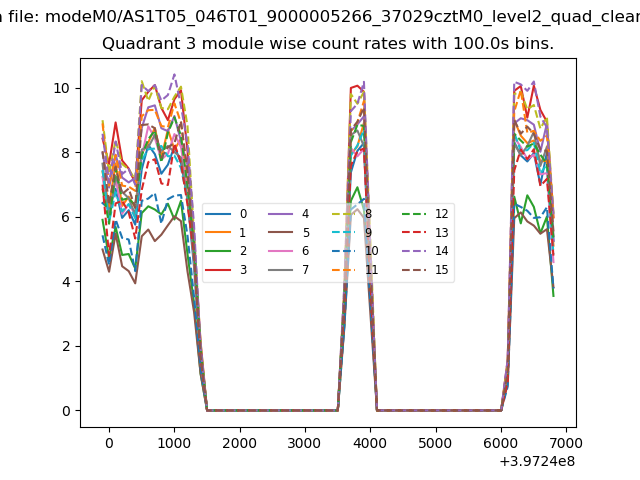
| Module-wise count rates for Quadrant A Data is divided into 100 sec bins |
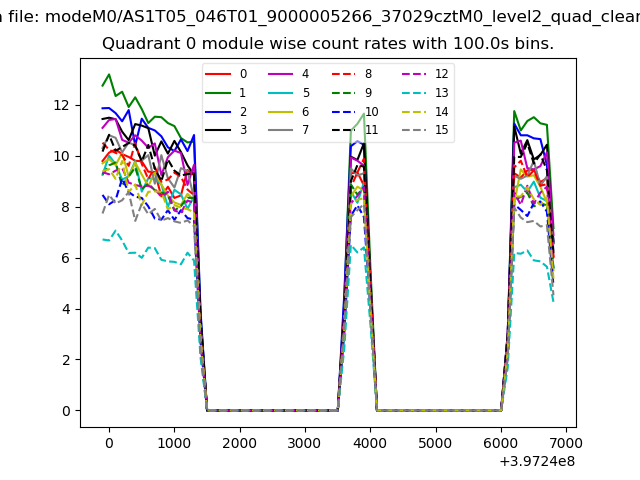 |
 |
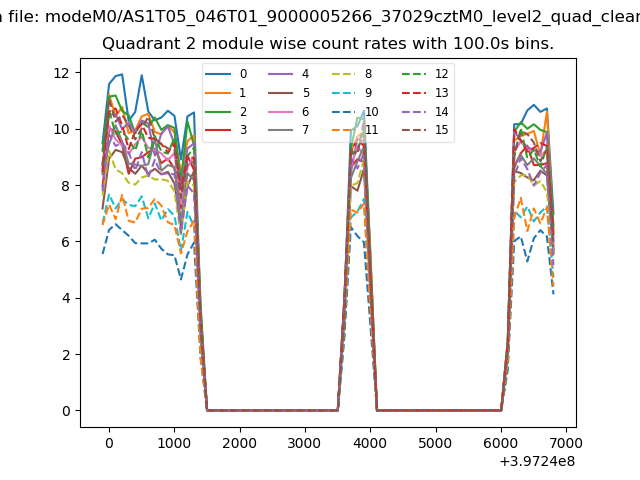
| Module-wise count rates for Quadrant B Data is divided into 100 sec bins |
 |
 |
| Module-wise count rates for Quadrant C Data is divided into 100 sec bins |
 |
 |
| Module-wise count rates for Quadrant D Data is divided into 100 sec bins |
 |
 |
| Parameter | Plot |
|---|---|
| CZT HV Monitor | 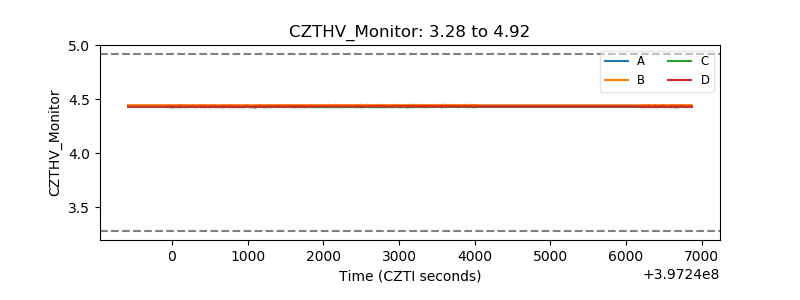 |
| D_VDD | 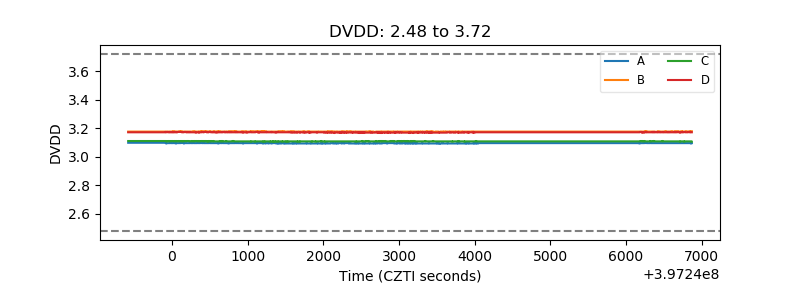 |
| Temperature 1 | 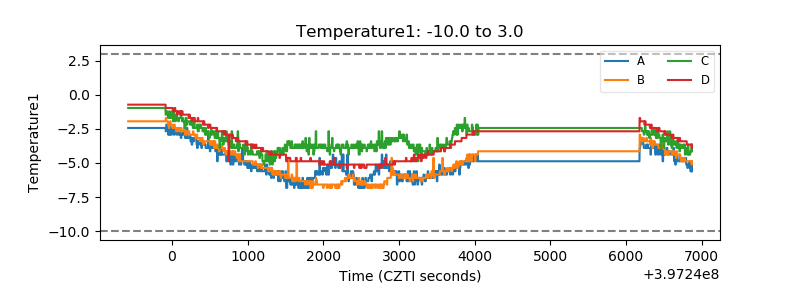 |
| Veto HV Monitor | 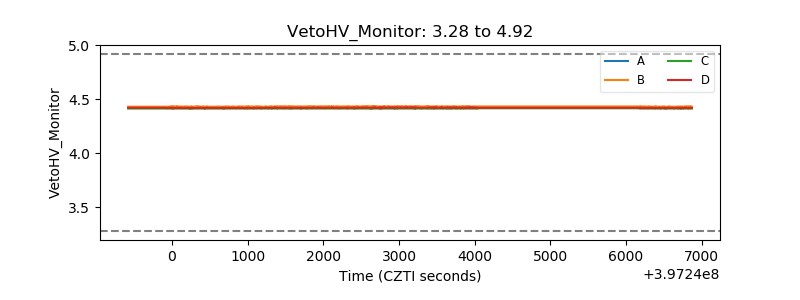 |
| Veto LLD | 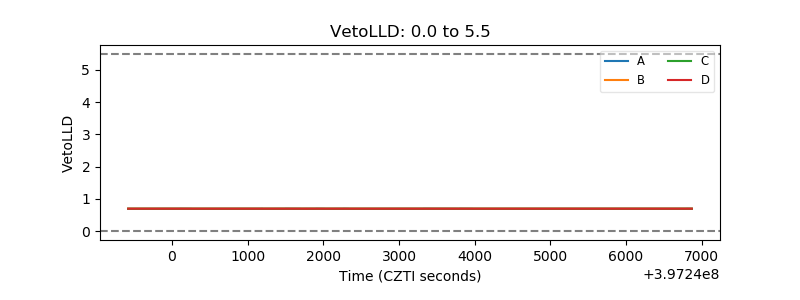 |
| Alpha Counter | 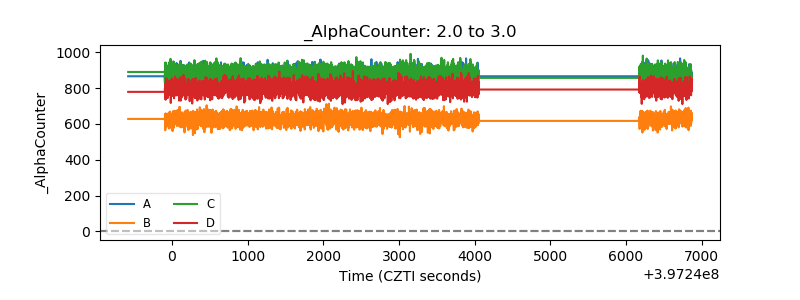 |
| _CPM_Rate | 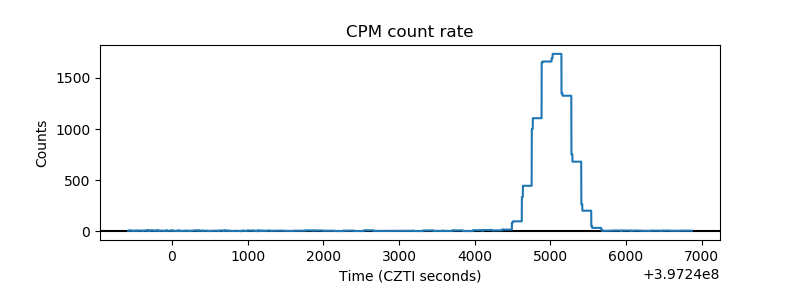 |
| CZT Counter | 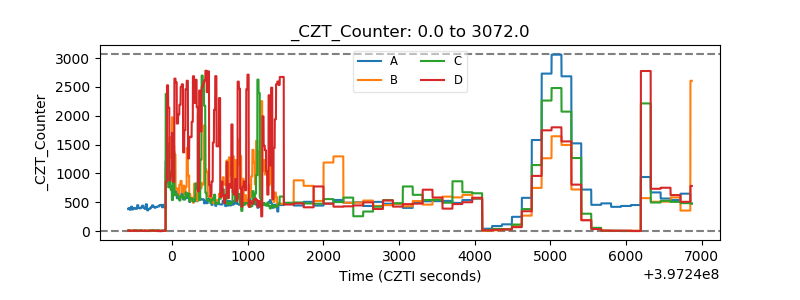 |
| +2.5 Volts monitor | 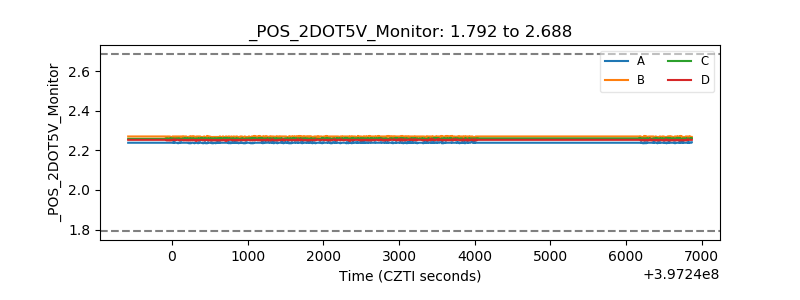 |
| +5 Volts monitor | 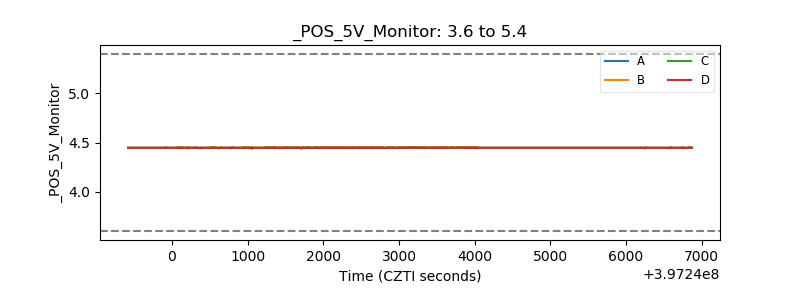 |
| _ROLL_ROT | 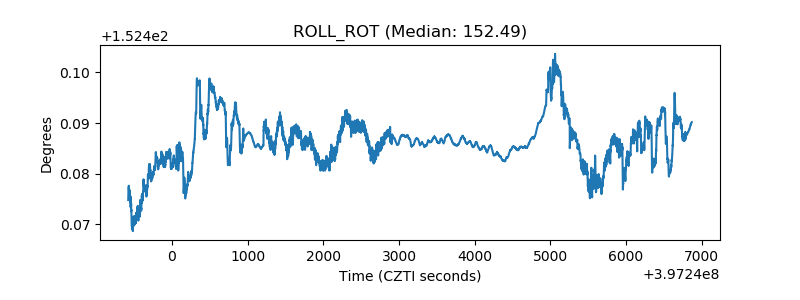 |
| _Roll_DEC | 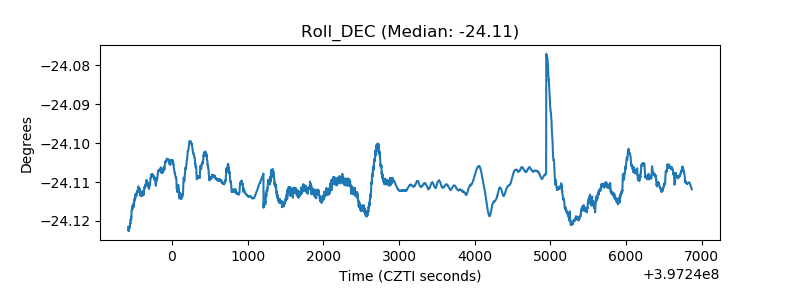 |
| _Roll_RA | 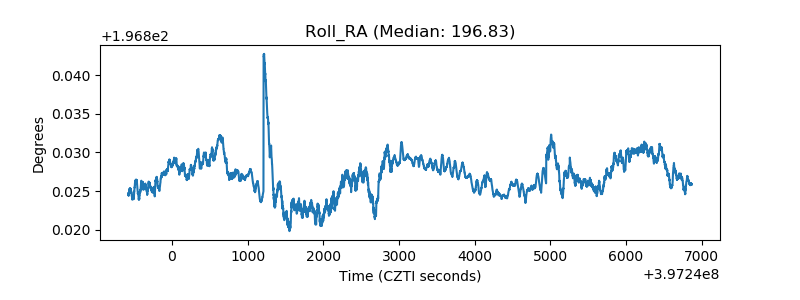 |
| Veto Counter | 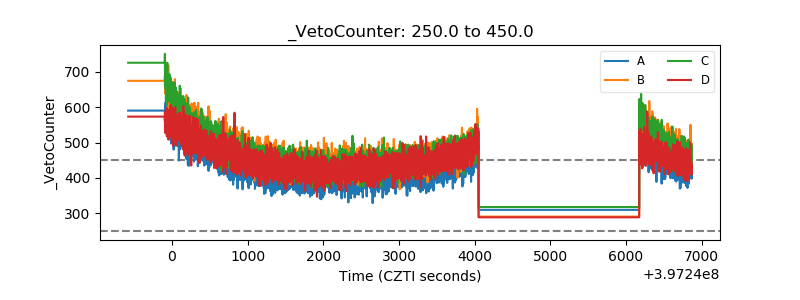 |