| Param | Original file | Final file |
|---|---|---|
| Filename | modeM0/AS1T05_046T01_9000005266_37031cztM0_level2.evt | modeM0/AS1T05_046T01_9000005266_37031cztM0_level2_quad_clean.evt |
| Size (bytes) | 395,300,160 | 51,027,840 |
| Size | 377.0 MB | 48.7 MB |
| Events in quadrant A | 2,529,354 | 306,843 |
| Events in quadrant B | 2,804,574 | 308,006 |
| Events in quadrant C | 3,588,921 | 290,480 |
| Events in quadrant D | 2,708,200 | 288,110 |
| Mode M0 | |||
|---|---|---|---|
| Quadrant | BADHDUFLAG | Total packets | Discarded packets |
| A | 0 | 10737 | 112 |
| B | 0 | 11635 | 146 |
| C | 0 | 14220 | 264 |
| D | 0 | 11593 | 184 |
| Mode SS | |||
|---|---|---|---|
| Quadrant | BADHDUFLAG | Total packets | Discarded packets |
| A | 0 | 103 | 1 |
| B | 0 | 104 | 0 |
| C | 0 | 104 | 0 |
| D | 0 | 104 | 0 |
| Mode M9 | |||
|---|---|---|---|
| Quadrant | BADHDUFLAG | Total packets | Discarded packets |
| A | 0 | 24 | 0 |
| B | 0 | 24 | 0 |
| C | 0 | 23 | 0 |
| D | 0 | 25 | 0 |
| Quadrant | Total seconds | Saturated seconds | Saturation percentage |
|---|---|---|---|
| A | 5016 | 17 | 0.338915% |
| B | 5011 | 39 | 0.778288% |
| C | 5000 | 194 | 3.880000% |
| D | 4995 | 50 | 1.001001% |
Noise dominated data is calculated using 1-second bins in cleaned event files. If a bin has >2000 counts, and if more than 50% of those come from <1% of pixels, then it is considered to be noise-dominated and hence unusable.
| Quadrant | # 1 sec bins | Bins with >0 counts | Bins with >2000 counts | High rate bins dominated by noise | Noise dominated (total time) | Noise dominated (detector-on time) | Marked lightcurve |
|---|---|---|---|---|---|---|---|
| A | 7027 | 5062 | 9 | 9 | 0.13% | 0.18% | 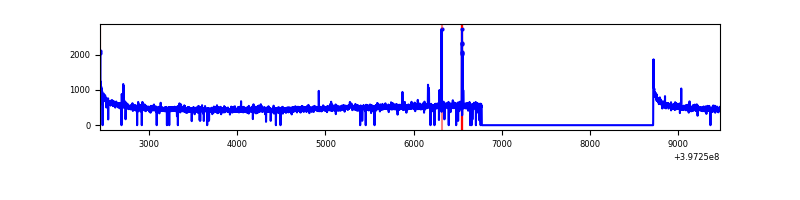 |
| B | 7027 | 5060 | 30 | 30 | 0.43% | 0.59% | 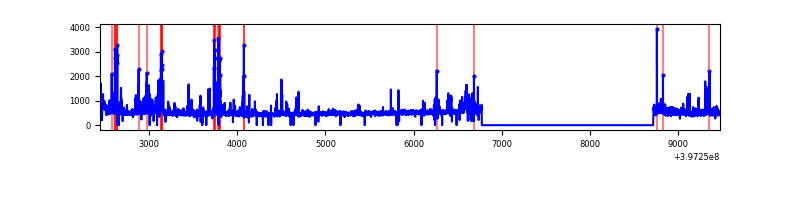 |
| C | 7027 | 5054 | 170 | 170 | 2.42% | 3.36% | 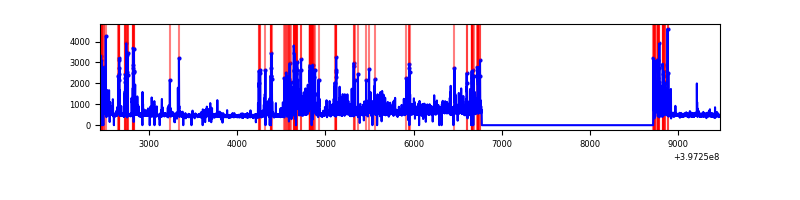 |
| D | 7027 | 5057 | 48 | 48 | 0.68% | 0.95% | 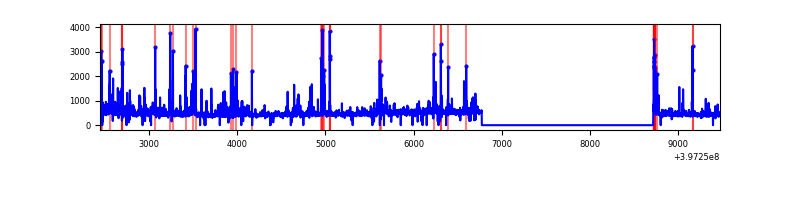 |
Top three noisy pixels from each quadrant. If the there are fewer than three noisy pixels in the level2.evt file, extra rows are filled as -1
| Pixel properties | Quadrant properties | ||||||
|---|---|---|---|---|---|---|---|
| Quadrant | DetID | PixID | Counts | Sigma | Mean | Median | Sigma |
| A | 10 | 83 | 221636 | 1883.83 | 581 | 571 | 117.3 |
| A | 9 | 143 | 20564 | 170.37 | 581 | 571 | 117.3 |
| A | 13 | 6 | 14482 | 118.54 | 581 | 571 | 117.3 |
| B | 5 | 184 | 135751 | 1215.14 | 576 | 561 | 111.3 |
| B | 5 | 172 | 121061 | 1083.1 | 576 | 561 | 111.3 |
| B | 0 | 213 | 103053 | 921.24 | 576 | 561 | 111.3 |
| C | 1 | 23 | 540328 | 4211.33 | 551 | 556 | 128.2 |
| C | 0 | 10 | 404886 | 3154.61 | 551 | 556 | 128.2 |
| C | 15 | 214 | 213402 | 1660.64 | 551 | 556 | 128.2 |
| D | 2 | 250 | 221448 | 1628.03 | 556 | 541 | 135.7 |
| D | 2 | 153 | 165431 | 1215.2 | 556 | 541 | 135.7 |
| D | 2 | 249 | 64722 | 473.0 | 556 | 541 | 135.7 |
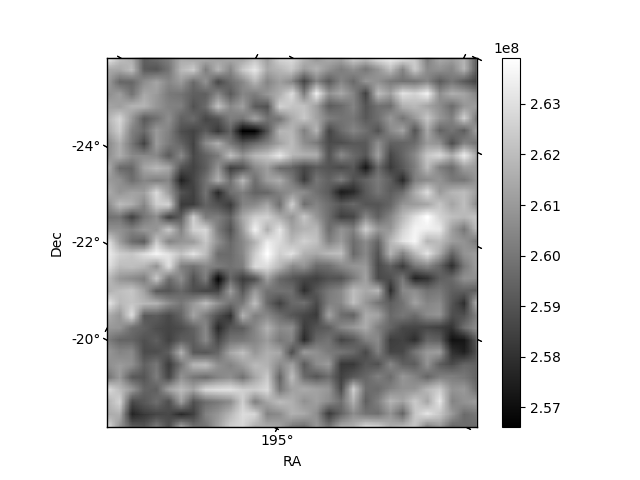
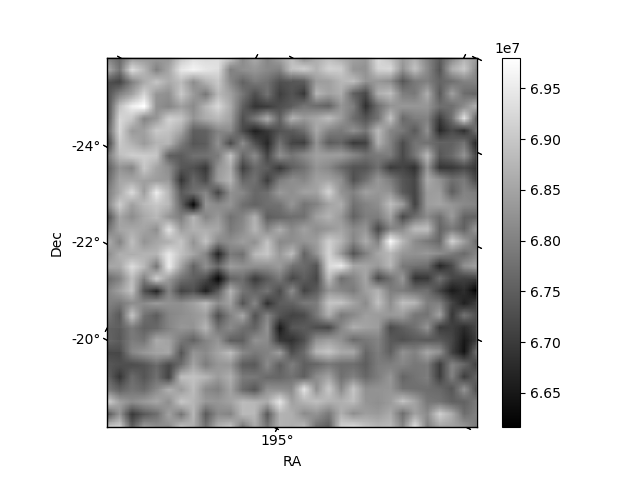
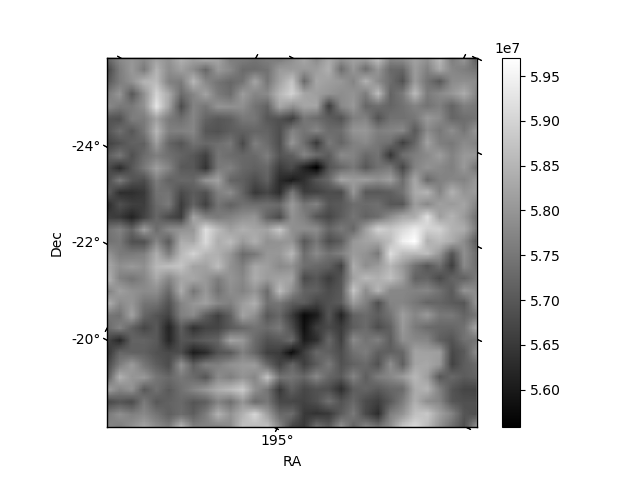
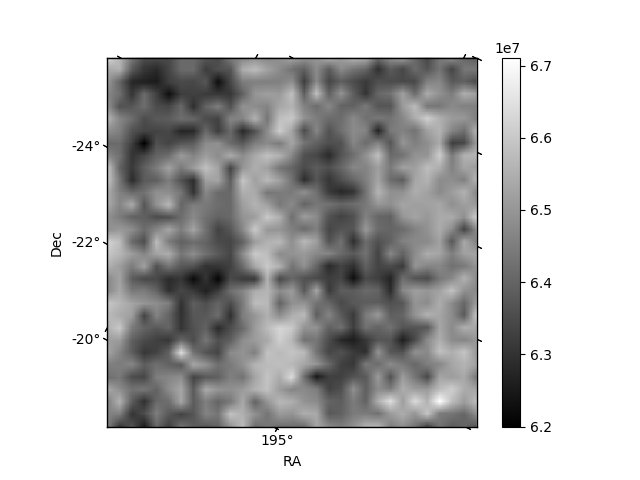
Histogram calculated using DETX and DETY for each event in the final _common_clean file
| Quadrant A | 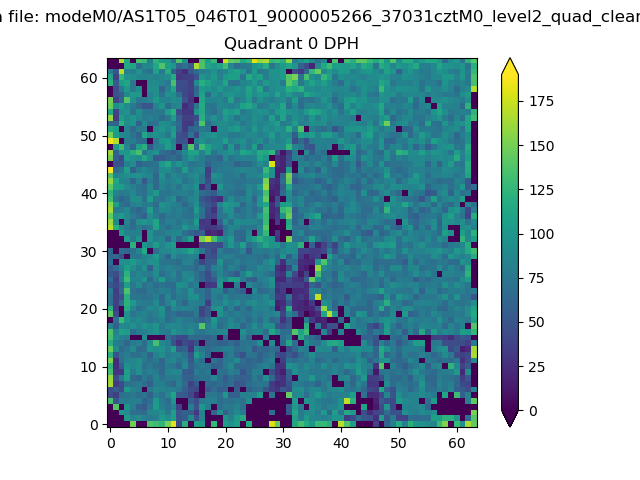 |
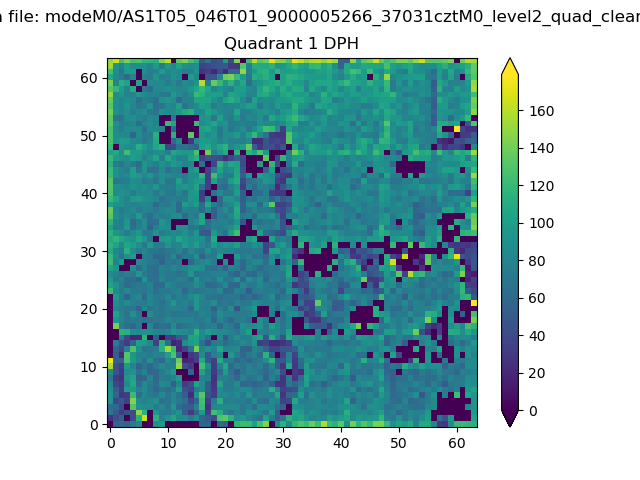 |
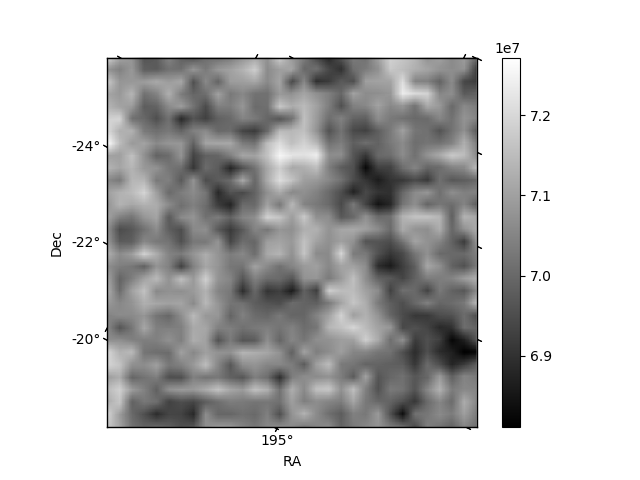
Quadrant B |
|---|---|---|---|
| Quadrant D | 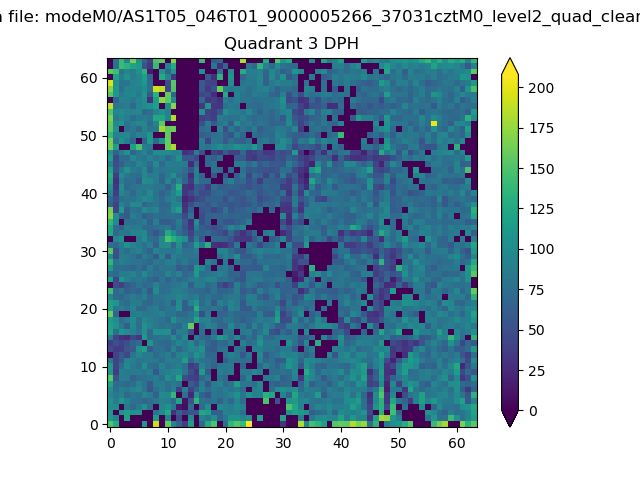 |
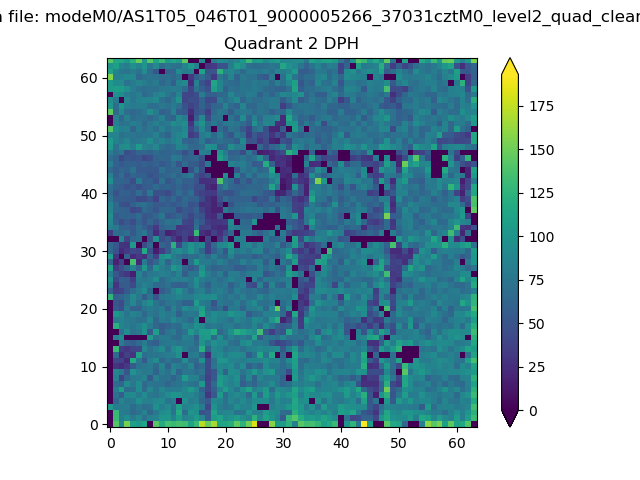 |
Quadrant C |
| Plot type | Count rate plots | Images |
|---|---|---|
| Comparison with Poisson distribution Blue bars denote a histogram of data divided into 1 sec bins. Red curve is a Poisson curve with rate = median count rate of data. |
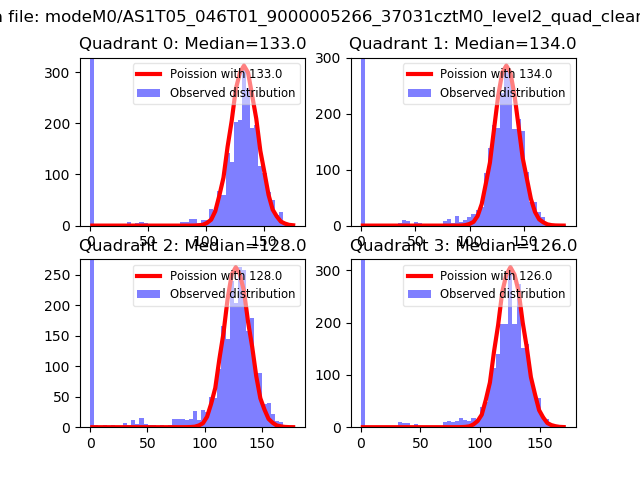 |
 |
| Quadrant-wise count rates Data is divided into 100 sec bins |
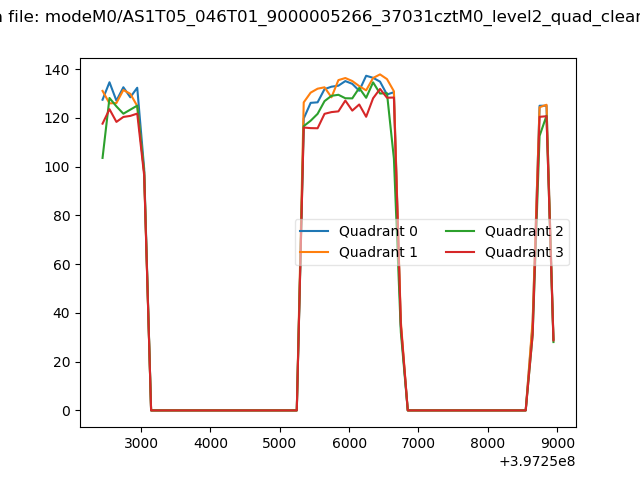 |
|
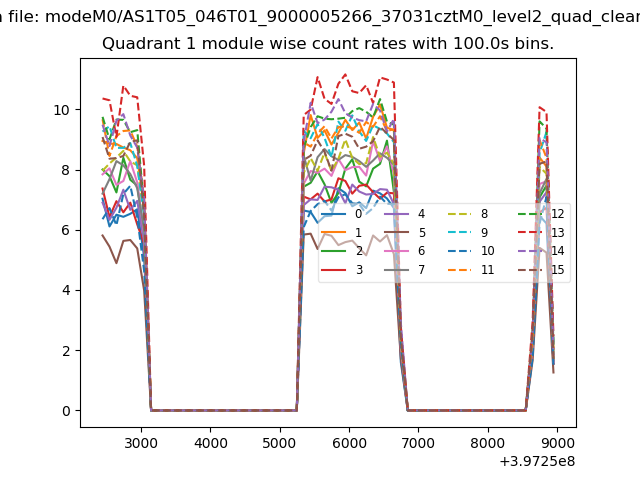
| Module-wise count rates for Quadrant A Data is divided into 100 sec bins |
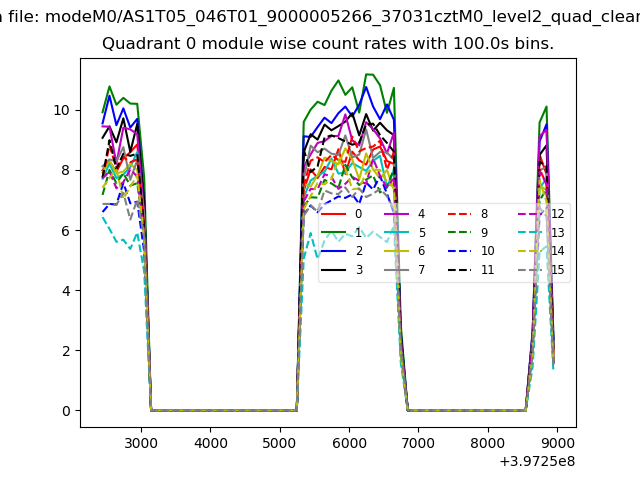 |
 |
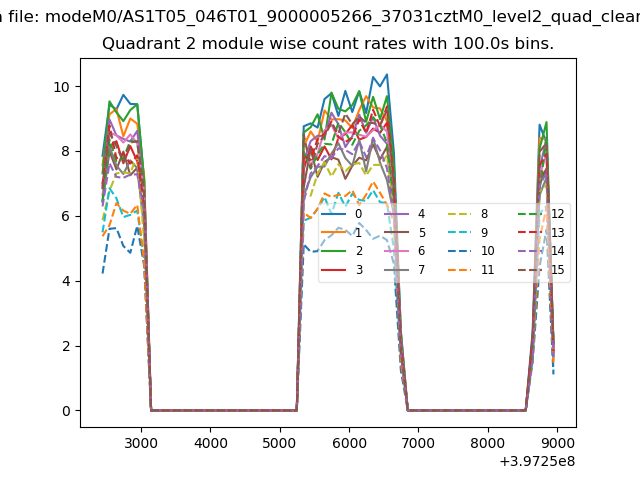
| Module-wise count rates for Quadrant B Data is divided into 100 sec bins |
 |
 |
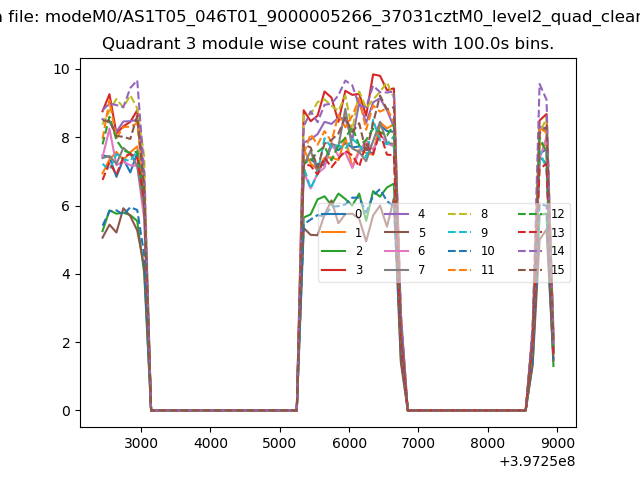
| Module-wise count rates for Quadrant C Data is divided into 100 sec bins |
 |
 |
| Module-wise count rates for Quadrant D Data is divided into 100 sec bins |
 |
 |
| Parameter | Plot |
|---|---|
| CZT HV Monitor | 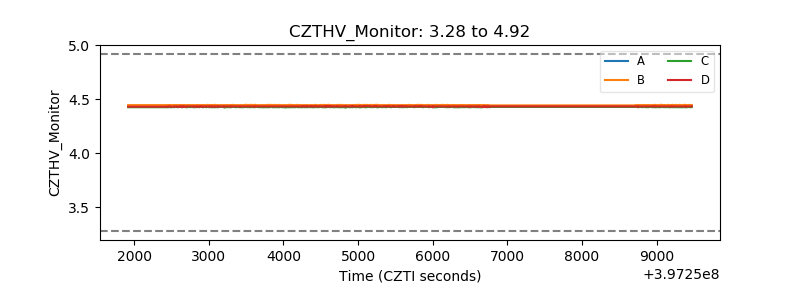 |
| D_VDD | 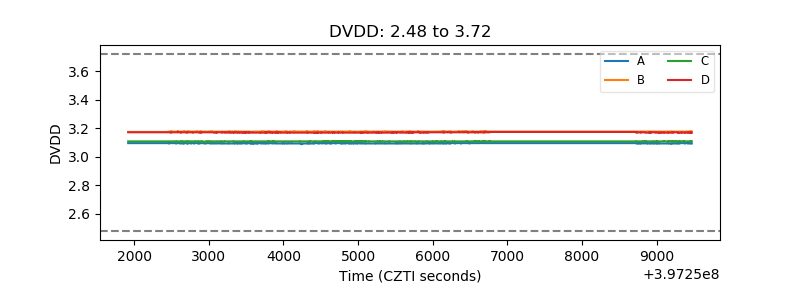 |
| Temperature 1 | 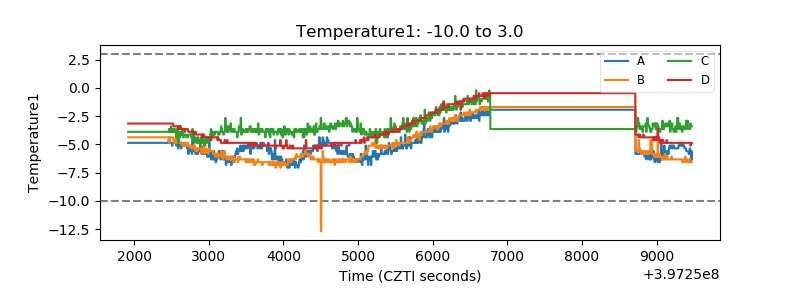 |
| Veto HV Monitor |  |
| Veto LLD | 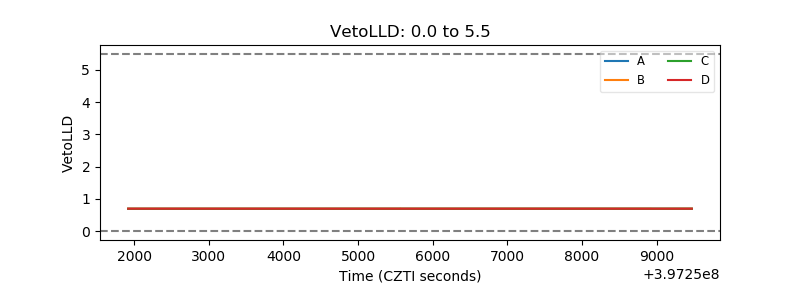 |
| Alpha Counter | 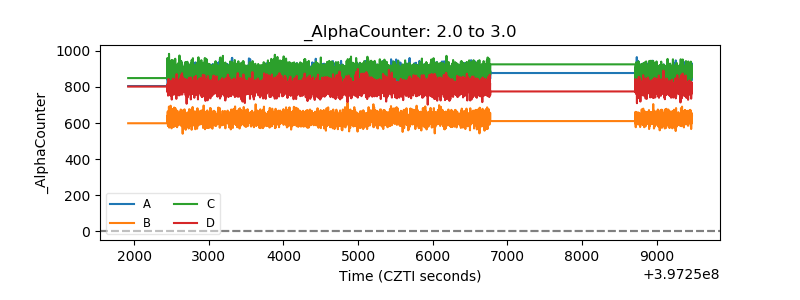 |
| _CPM_Rate | 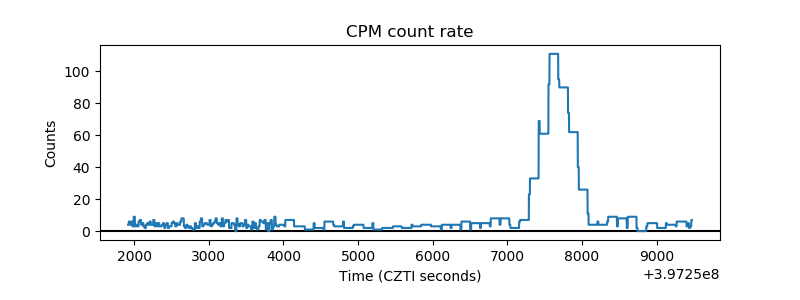 |
| CZT Counter | 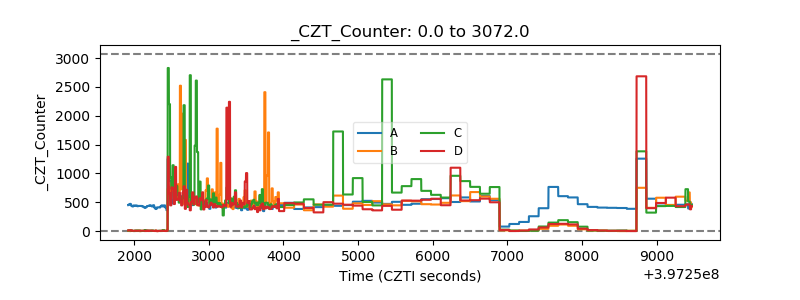 |
| +2.5 Volts monitor | 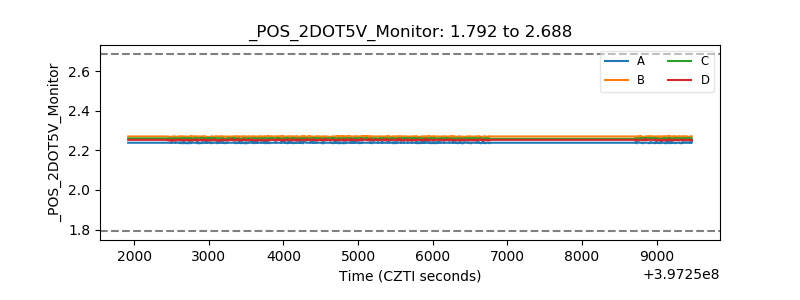 |
| +5 Volts monitor | 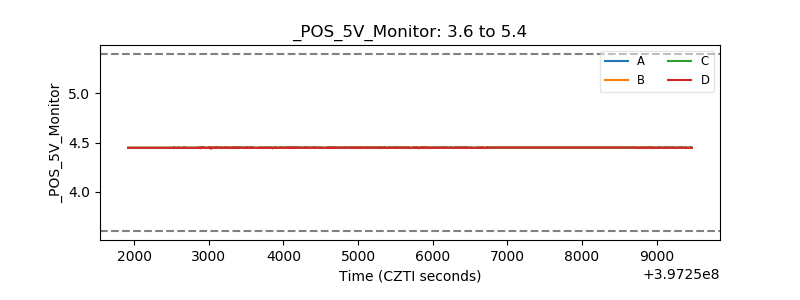 |
| _ROLL_ROT | 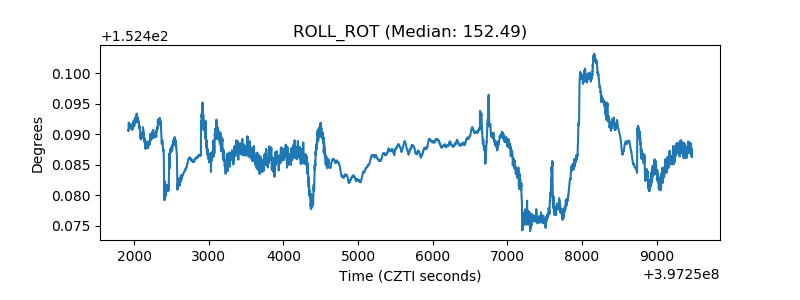 |
| _Roll_DEC | 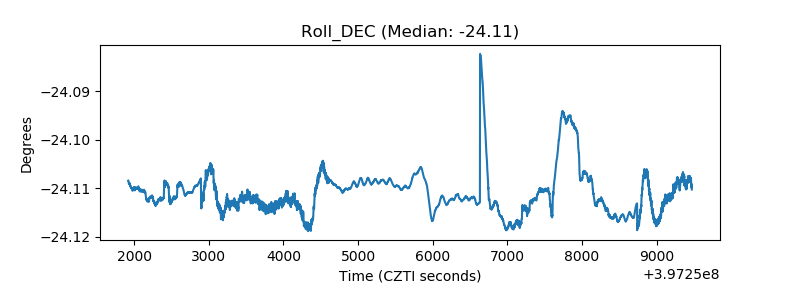 |
| _Roll_RA | 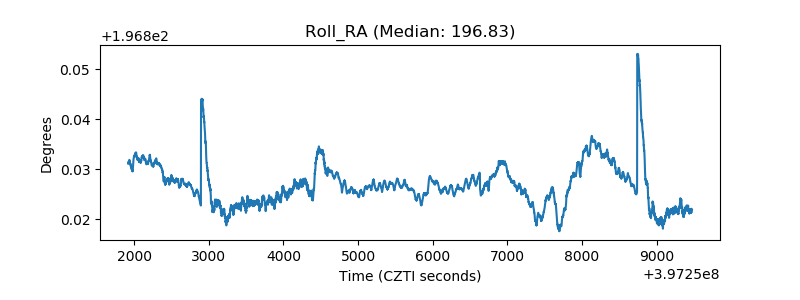 |
| Veto Counter | 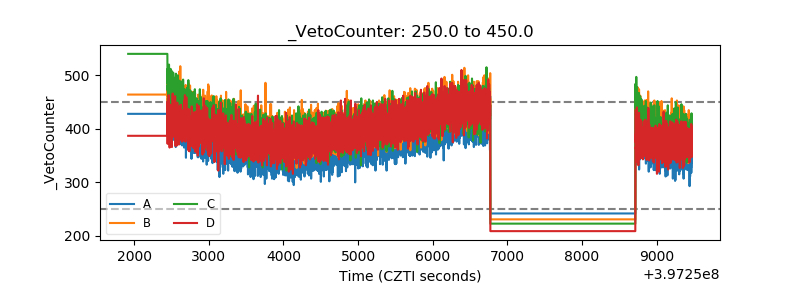 |