| Param | Original file | Final file |
|---|---|---|
| Filename | modeM0/AS1T05_046T01_9000005266_37032cztM0_level2.evt | modeM0/AS1T05_046T01_9000005266_37032cztM0_level2_quad_clean.evt |
| Size (bytes) | 409,815,360 | 53,982,720 |
| Size | 390.8 MB | 51.5 MB |
| Events in quadrant A | 2,757,780 | 320,919 |
| Events in quadrant B | 2,873,544 | 321,238 |
| Events in quadrant C | 3,288,790 | 308,983 |
| Events in quadrant D | 3,120,474 | 301,392 |
| Mode M0 | |||
|---|---|---|---|
| Quadrant | BADHDUFLAG | Total packets | Discarded packets |
| A | 0 | 11516 | 7 |
| B | 0 | 12074 | 24 |
| C | 0 | 13080 | 28 |
| D | 0 | 13063 | 6 |
| Mode SS | |||
|---|---|---|---|
| Quadrant | BADHDUFLAG | Total packets | Discarded packets |
| A | 0 | 112 | 0 |
| B | 0 | 112 | 0 |
| C | 0 | 111 | 0 |
| D | 0 | 112 | 0 |
| Mode M9 | |||
|---|---|---|---|
| Quadrant | BADHDUFLAG | Total packets | Discarded packets |
| A | 0 | 30 | 0 |
| B | 0 | 30 | 0 |
| C | 0 | 30 | 0 |
| D | 0 | 31 | 0 |
| Quadrant | Total seconds | Saturated seconds | Saturation percentage |
|---|---|---|---|
| A | 5455 | 15 | 0.274977% |
| B | 5450 | 60 | 1.100917% |
| C | 5449 | 119 | 2.183887% |
| D | 5455 | 110 | 2.016499% |
Noise dominated data is calculated using 1-second bins in cleaned event files. If a bin has >2000 counts, and if more than 50% of those come from <1% of pixels, then it is considered to be noise-dominated and hence unusable.
| Quadrant | # 1 sec bins | Bins with >0 counts | Bins with >2000 counts | High rate bins dominated by noise | Noise dominated (total time) | Noise dominated (detector-on time) | Marked lightcurve |
|---|---|---|---|---|---|---|---|
| A | 7041 | 5458 | 9 | 9 | 0.13% | 0.16% | 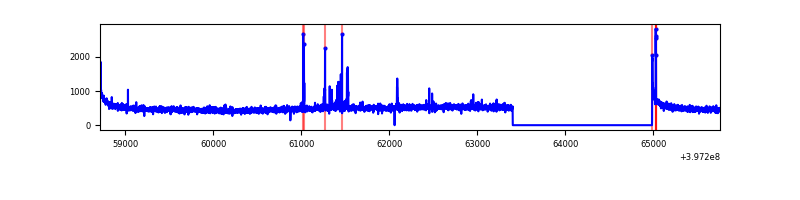 |
| B | 7041 | 5456 | 32 | 32 | 0.45% | 0.59% | 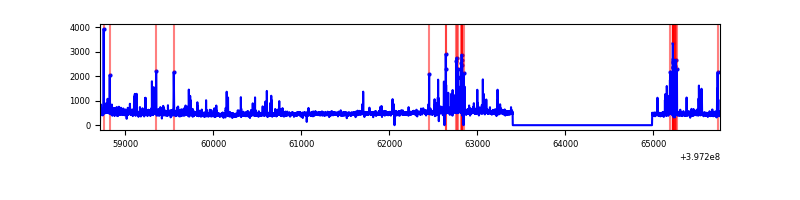 |
| C | 7041 | 5455 | 104 | 104 | 1.48% | 1.91% | 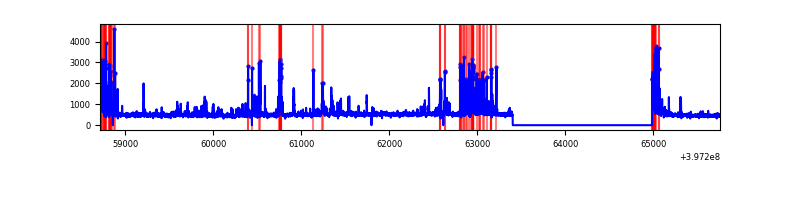 |
| D | 7041 | 5458 | 90 | 90 | 1.28% | 1.65% | 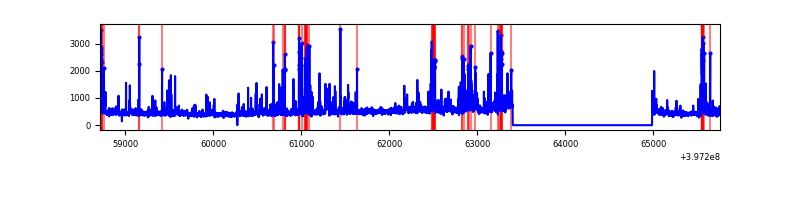 |
Top three noisy pixels from each quadrant. If the there are fewer than three noisy pixels in the level2.evt file, extra rows are filled as -1
| Pixel properties | Quadrant properties | ||||||
|---|---|---|---|---|---|---|---|
| Quadrant | DetID | PixID | Counts | Sigma | Mean | Median | Sigma |
| A | 10 | 83 | 236439 | 1848.65 | 629 | 617 | 127.6 |
| A | 9 | 143 | 55271 | 428.44 | 629 | 617 | 127.6 |
| A | 13 | 6 | 19118 | 145.03 | 629 | 617 | 127.6 |
| B | 5 | 172 | 175261 | 1466.47 | 619 | 602 | 119.1 |
| B | 0 | 213 | 73079 | 608.53 | 619 | 602 | 119.1 |
| B | 5 | 184 | 60912 | 506.37 | 619 | 602 | 119.1 |
| C | 14 | 254 | 326501 | 2337.13 | 600 | 604 | 139.4 |
| C | 15 | 214 | 234199 | 1675.2 | 600 | 604 | 139.4 |
| C | 0 | 10 | 234163 | 1674.94 | 600 | 604 | 139.4 |
| D | 2 | 250 | 229380 | 1534.05 | 604 | 584 | 149.1 |
| D | 2 | 153 | 202271 | 1352.29 | 604 | 584 | 149.1 |
| D | 12 | 235 | 136019 | 908.08 | 604 | 584 | 149.1 |
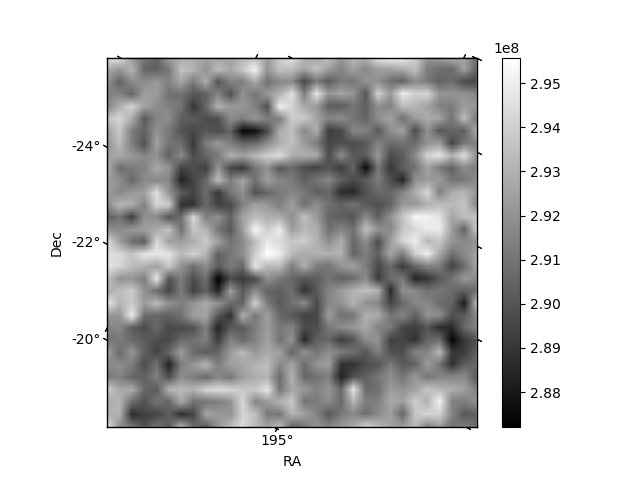
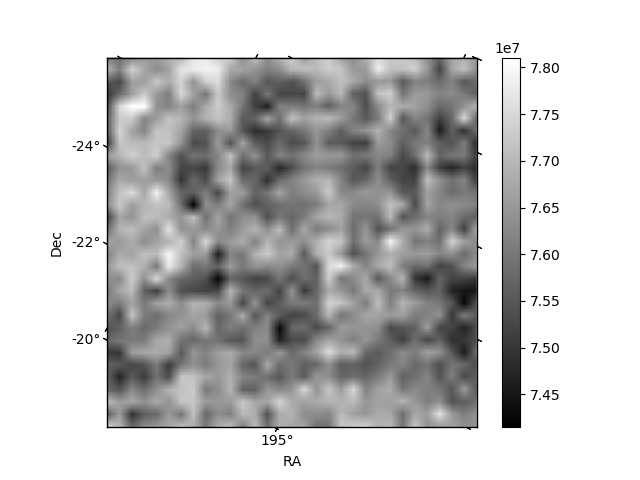
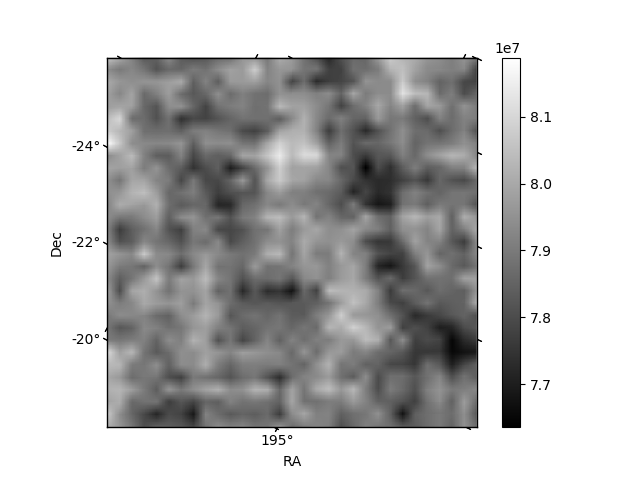
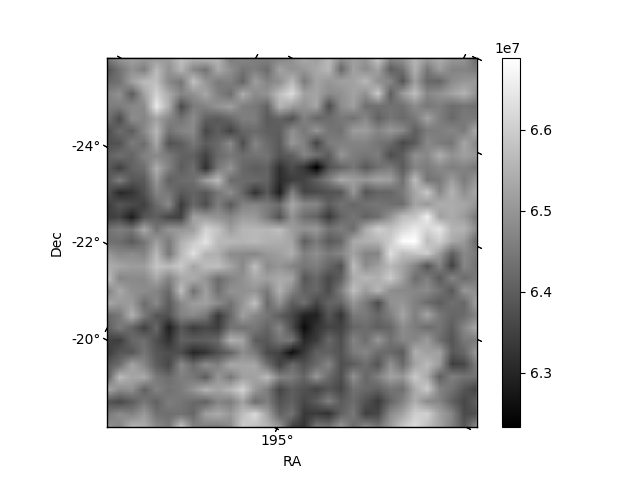
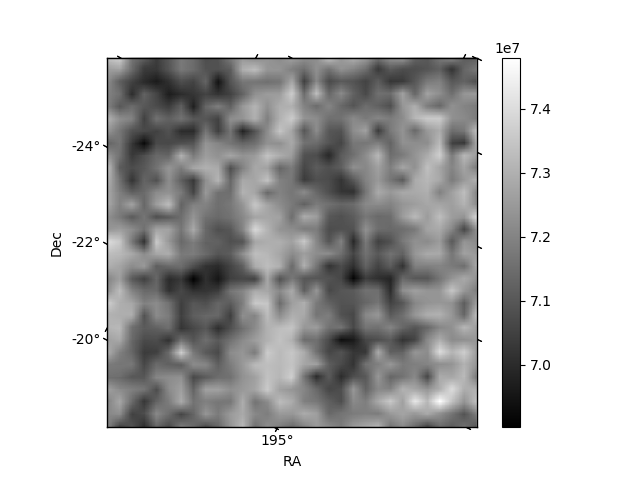
Histogram calculated using DETX and DETY for each event in the final _common_clean file
| Quadrant A | 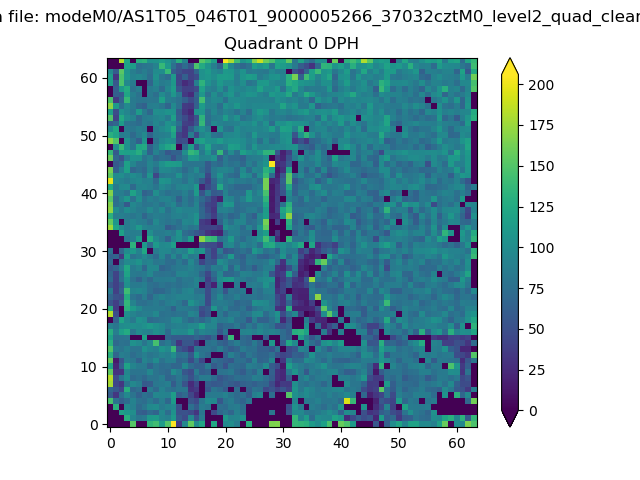 |
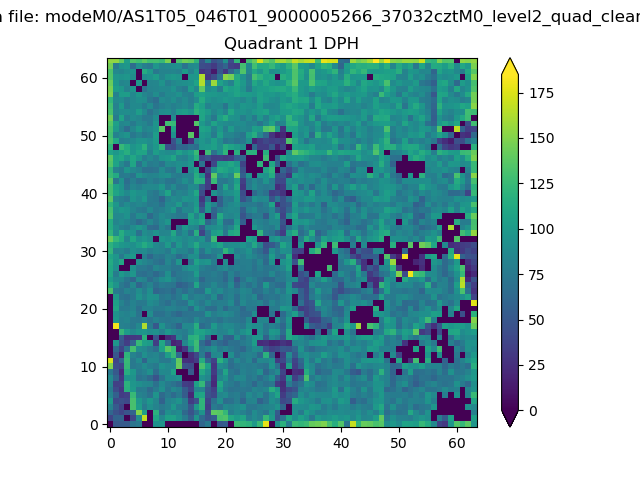 |
Quadrant B |
|---|---|---|---|
| Quadrant D | 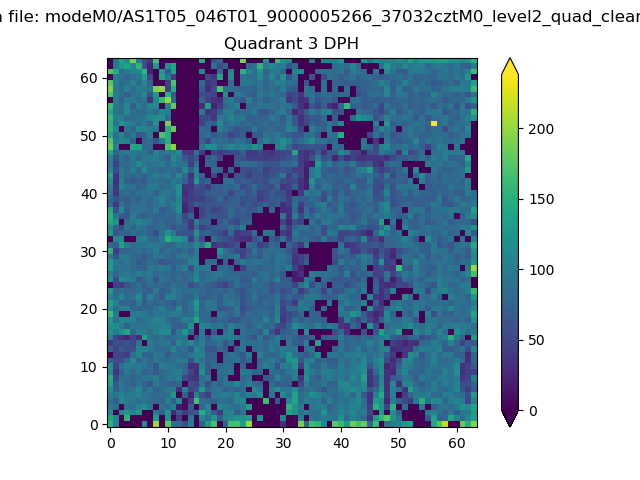 |
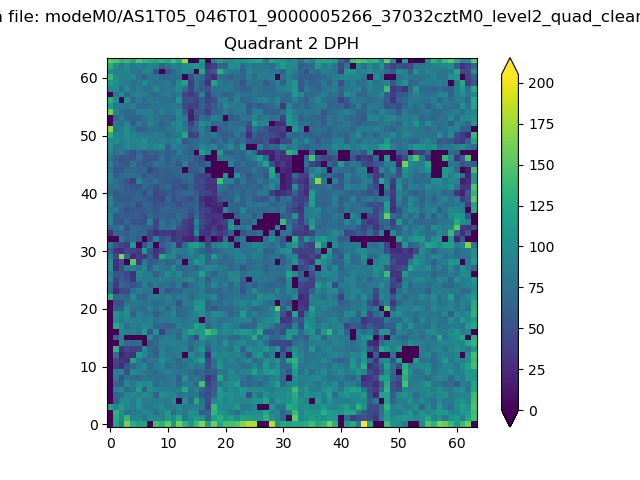 |
Quadrant C |
| Plot type | Count rate plots | Images |
|---|---|---|
| Comparison with Poisson distribution Blue bars denote a histogram of data divided into 1 sec bins. Red curve is a Poisson curve with rate = median count rate of data. |
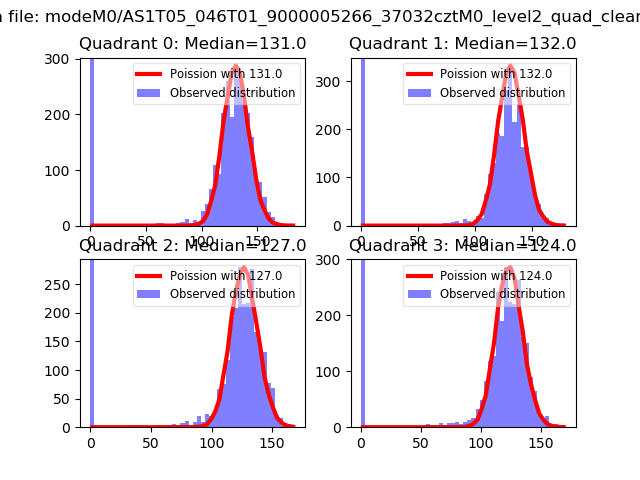 |
 |
| Quadrant-wise count rates Data is divided into 100 sec bins |
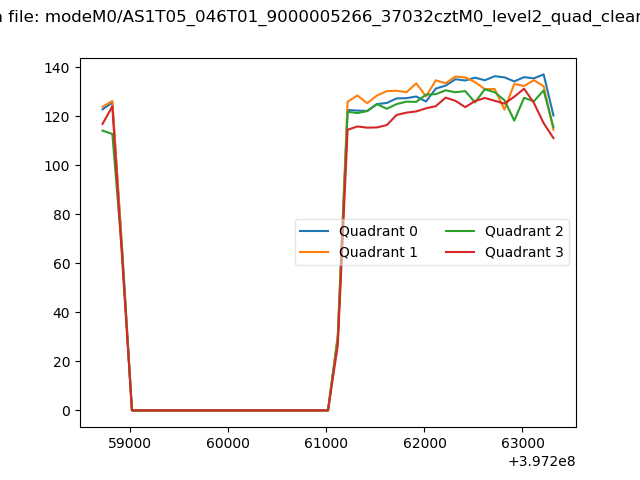 |
|
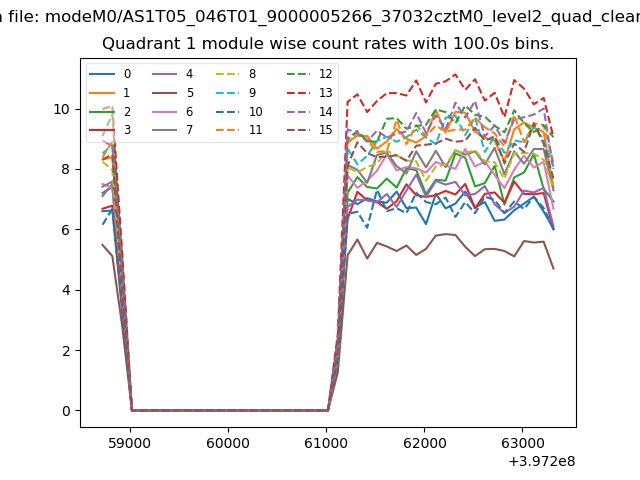
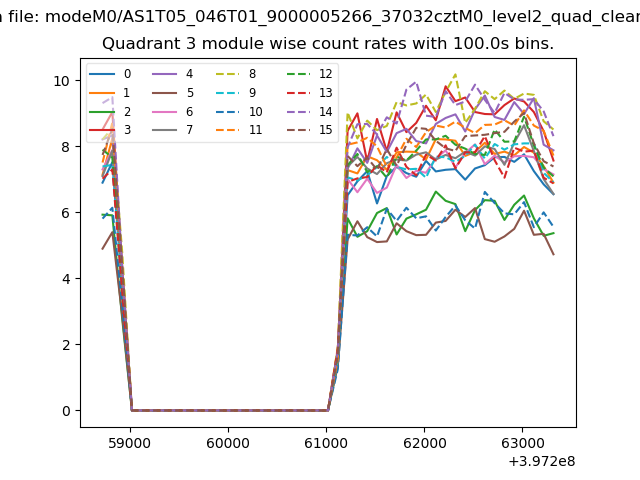
| Module-wise count rates for Quadrant A Data is divided into 100 sec bins |
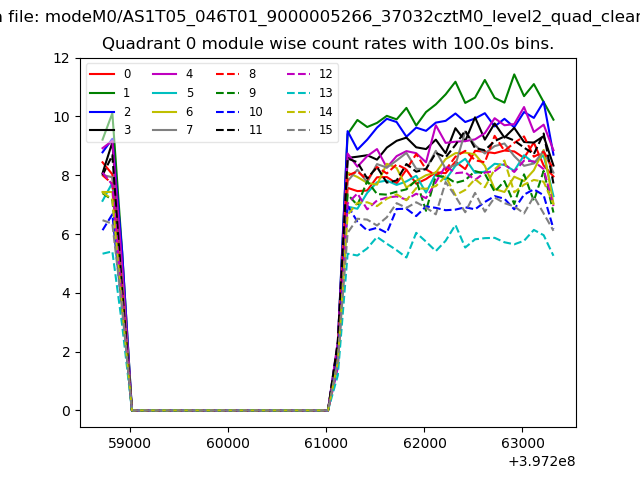 |
 |
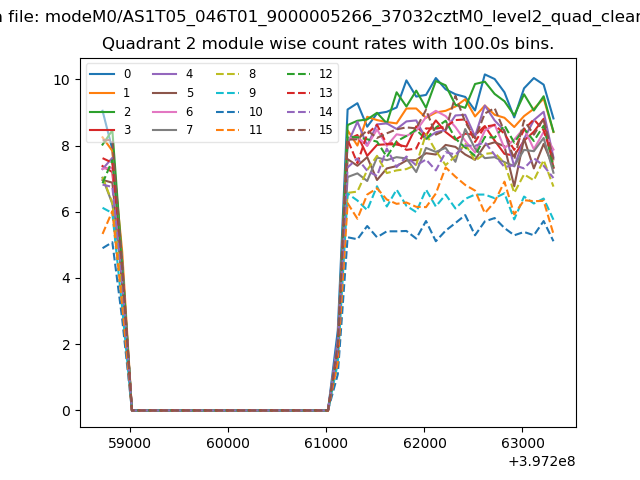
| Module-wise count rates for Quadrant B Data is divided into 100 sec bins |
 |
 |
| Module-wise count rates for Quadrant C Data is divided into 100 sec bins |
 |
 |
| Module-wise count rates for Quadrant D Data is divided into 100 sec bins |
 |
 |
| Parameter | Plot |
|---|---|
| CZT HV Monitor | 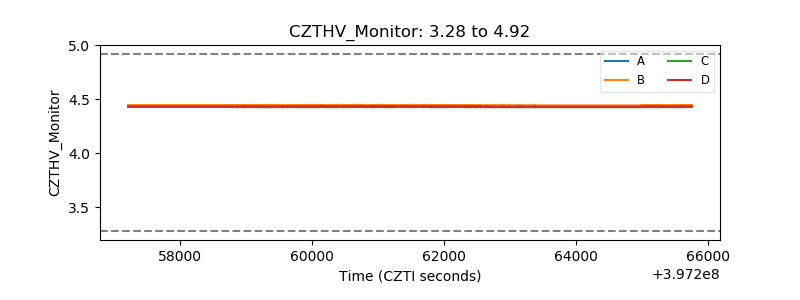 |
| D_VDD | 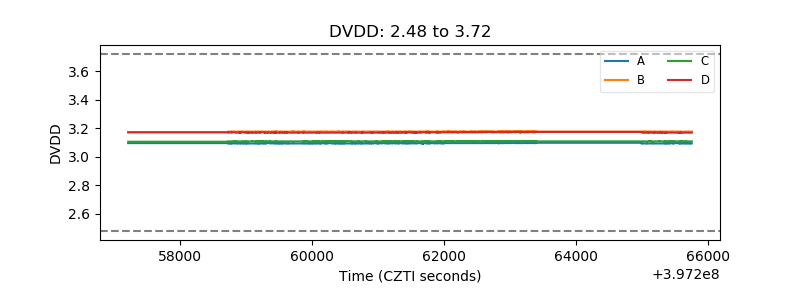 |
| Temperature 1 | 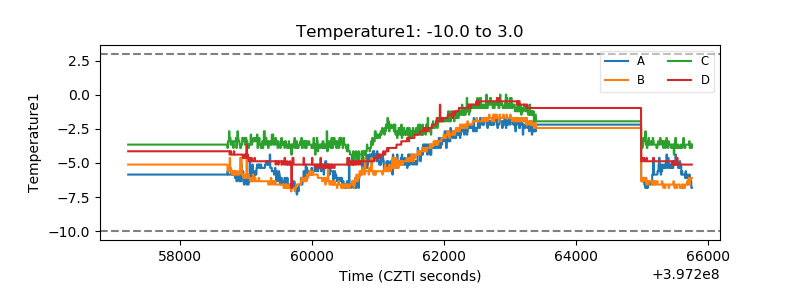 |
| Veto HV Monitor | 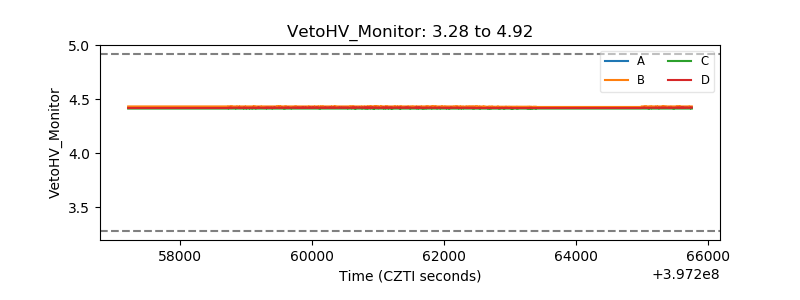 |
| Veto LLD | 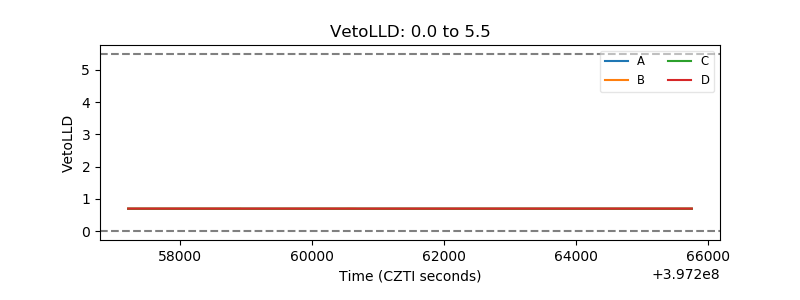 |
| Alpha Counter | 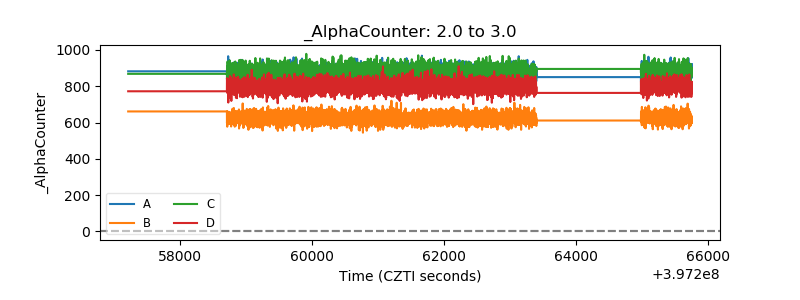 |
| _CPM_Rate | 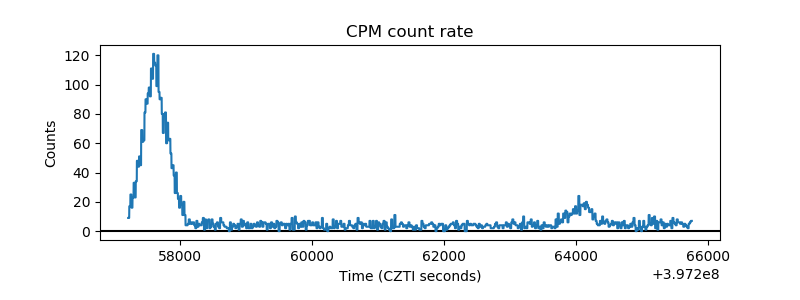 |
| CZT Counter | 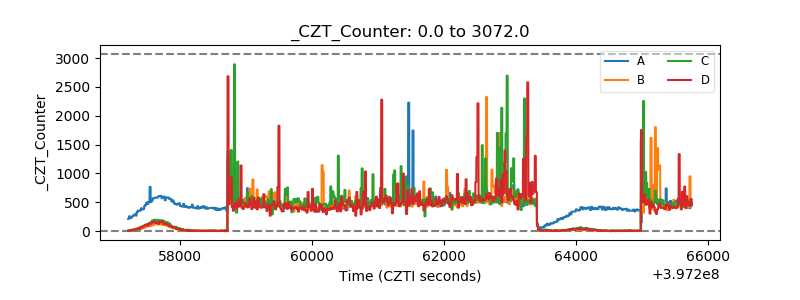 |
| +2.5 Volts monitor | 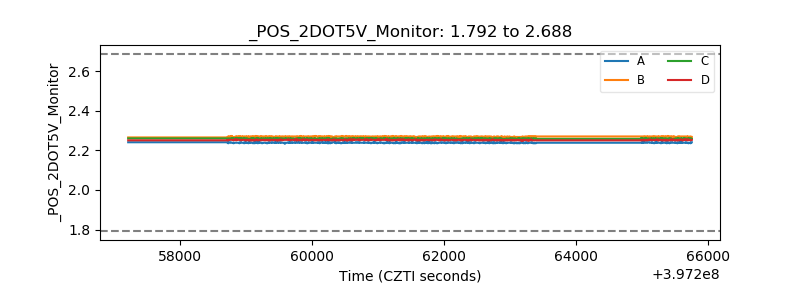 |
| +5 Volts monitor | 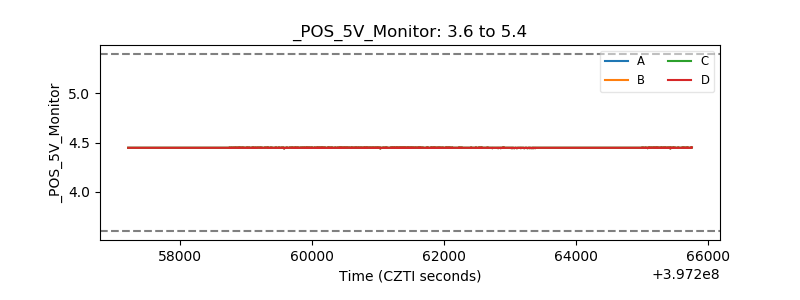 |
| _ROLL_ROT | 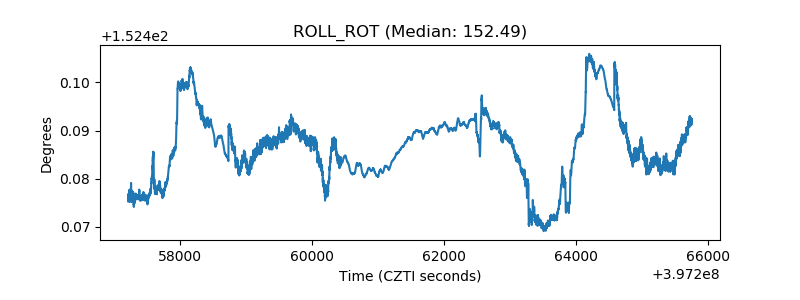 |
| _Roll_DEC | 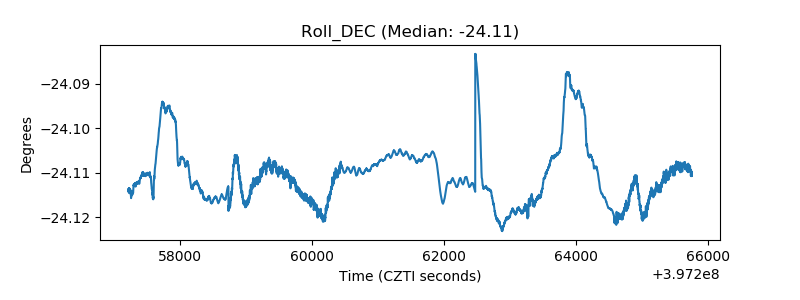 |
| _Roll_RA | 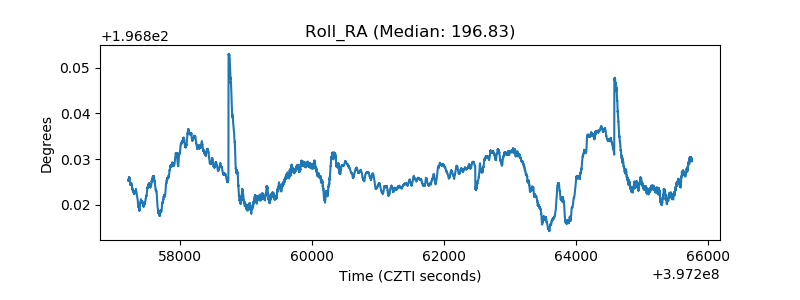 |
| Veto Counter | 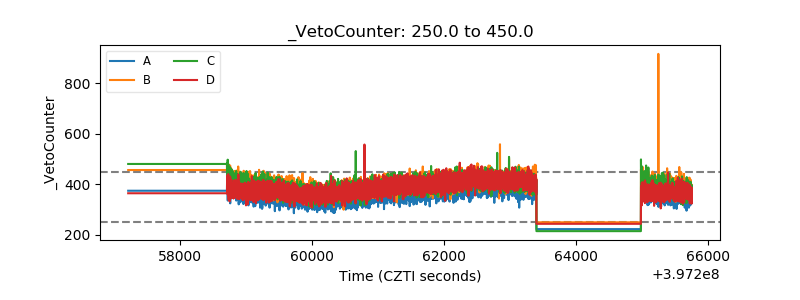 |