| Param | Original file | Final file |
|---|---|---|
| Filename | modeM0/AS1T05_046T01_9000005266_37033cztM0_level2.evt | modeM0/AS1T05_046T01_9000005266_37033cztM0_level2_quad_clean.evt |
| Size (bytes) | 430,724,160 | 60,416,640 |
| Size | 410.8 MB | 57.6 MB |
| Events in quadrant A | 2,816,775 | 367,324 |
| Events in quadrant B | 3,396,451 | 356,580 |
| Events in quadrant C | 3,202,397 | 357,044 |
| Events in quadrant D | 3,238,367 | 346,436 |
| Mode M0 | |||
|---|---|---|---|
| Quadrant | BADHDUFLAG | Total packets | Discarded packets |
| A | 0 | 11859 | 3 |
| B | 0 | 13829 | 2 |
| C | 0 | 12972 | 2 |
| D | 0 | 13500 | 2 |
| Mode SS | |||
|---|---|---|---|
| Quadrant | BADHDUFLAG | Total packets | Discarded packets |
| A | 0 | 116 | 0 |
| B | 0 | 116 | 0 |
| C | 0 | 116 | 0 |
| D | 0 | 116 | 0 |
| Mode M9 | |||
|---|---|---|---|
| Quadrant | BADHDUFLAG | Total packets | Discarded packets |
| A | 0 | 28 | 0 |
| B | 0 | 28 | 0 |
| C | 0 | 28 | 0 |
| D | 0 | 29 | 0 |
| Quadrant | Total seconds | Saturated seconds | Saturation percentage |
|---|---|---|---|
| A | 5748 | 8 | 0.139179% |
| B | 5748 | 219 | 3.810021% |
| C | 5748 | 65 | 1.130828% |
| D | 5748 | 65 | 1.130828% |
Noise dominated data is calculated using 1-second bins in cleaned event files. If a bin has >2000 counts, and if more than 50% of those come from <1% of pixels, then it is considered to be noise-dominated and hence unusable.
| Quadrant | # 1 sec bins | Bins with >0 counts | Bins with >2000 counts | High rate bins dominated by noise | Noise dominated (total time) | Noise dominated (detector-on time) | Marked lightcurve |
|---|---|---|---|---|---|---|---|
| A | 7121 | 5749 | 5 | 5 | 0.07% | 0.09% | 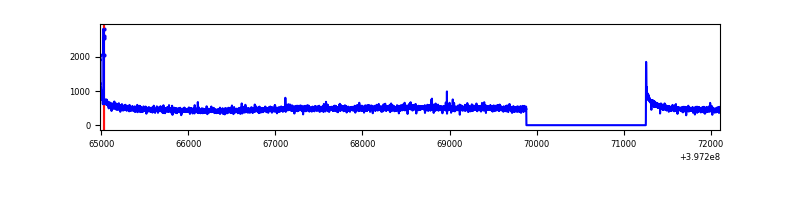 |
| B | 7121 | 5749 | 148 | 148 | 2.08% | 2.57% | 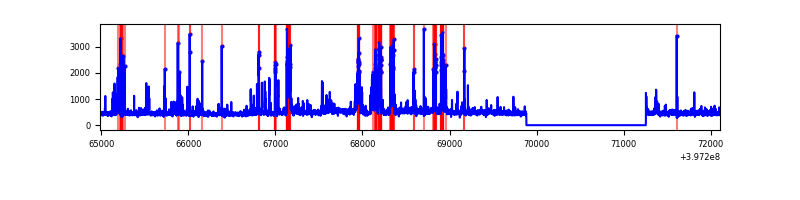 |
| C | 7121 | 5749 | 43 | 43 | 0.60% | 0.75% | 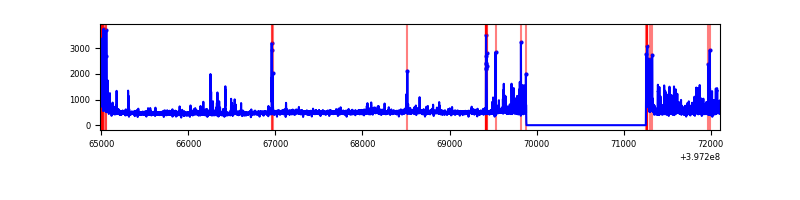 |
| D | 7121 | 5749 | 59 | 59 | 0.83% | 1.03% | 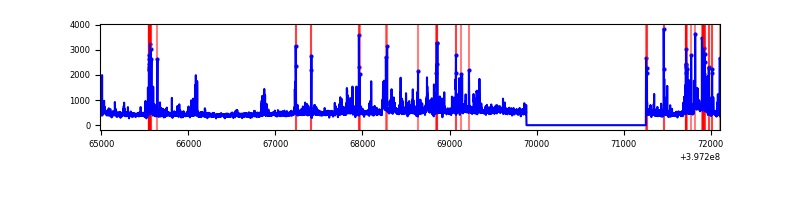 |
Top three noisy pixels from each quadrant. If the there are fewer than three noisy pixels in the level2.evt file, extra rows are filled as -1
| Pixel properties | Quadrant properties | ||||||
|---|---|---|---|---|---|---|---|
| Quadrant | DetID | PixID | Counts | Sigma | Mean | Median | Sigma |
| A | 10 | 83 | 249400 | 1853.1 | 659 | 644 | 134.2 |
| A | 13 | 254 | 9518 | 66.11 | 659 | 644 | 134.2 |
| A | 7 | 0 | 8245 | 56.62 | 659 | 644 | 134.2 |
| B | 5 | 172 | 390910 | 3158.96 | 643 | 627 | 123.5 |
| B | 5 | 184 | 372013 | 3006.01 | 643 | 627 | 123.5 |
| B | 4 | 81 | 23908 | 188.44 | 643 | 627 | 123.5 |
| C | 0 | 10 | 319806 | 2153.34 | 633 | 637 | 148.2 |
| C | 15 | 214 | 246423 | 1658.25 | 633 | 637 | 148.2 |
| C | 14 | 254 | 96371 | 645.89 | 633 | 637 | 148.2 |
| D | 2 | 250 | 199804 | 1282.83 | 636 | 620 | 155.3 |
| D | 12 | 235 | 160850 | 1031.95 | 636 | 620 | 155.3 |
| D | 2 | 249 | 117040 | 749.79 | 636 | 620 | 155.3 |
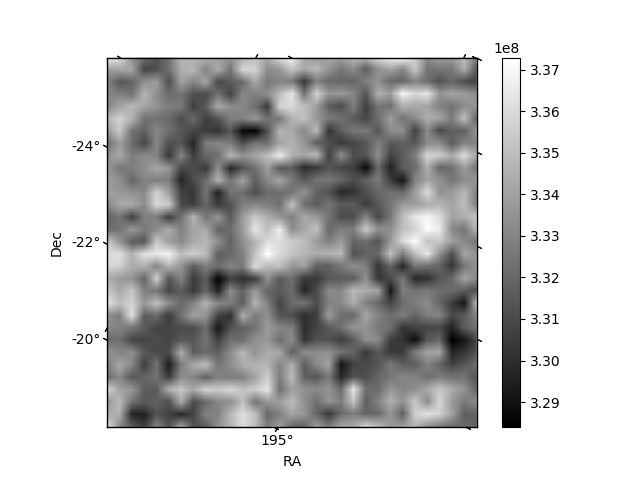
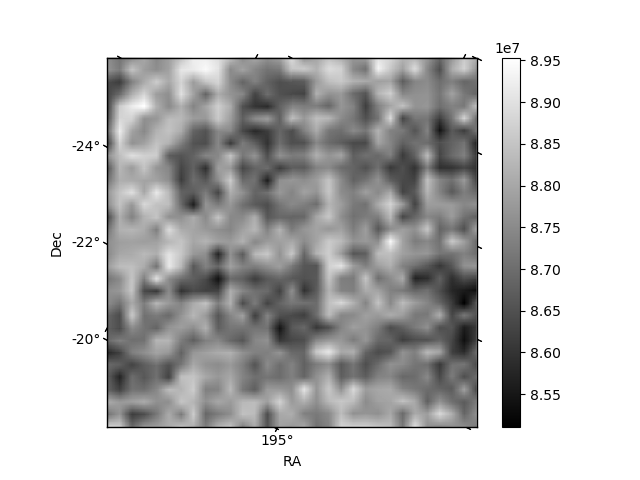
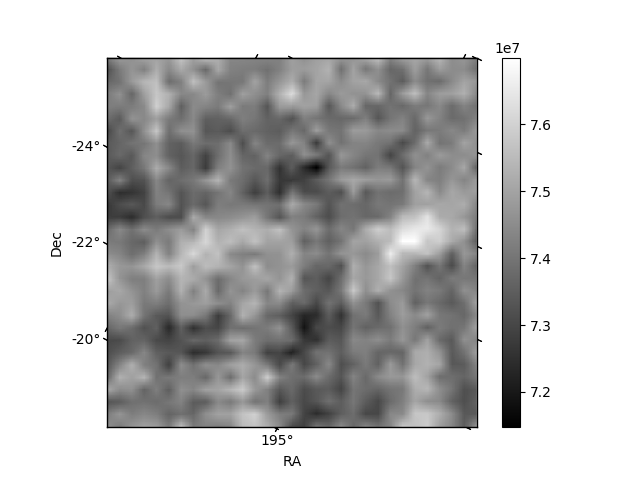
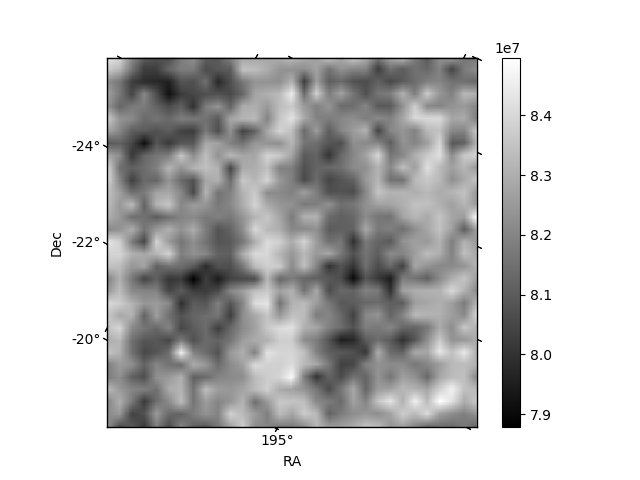
Histogram calculated using DETX and DETY for each event in the final _common_clean file
| Quadrant A | 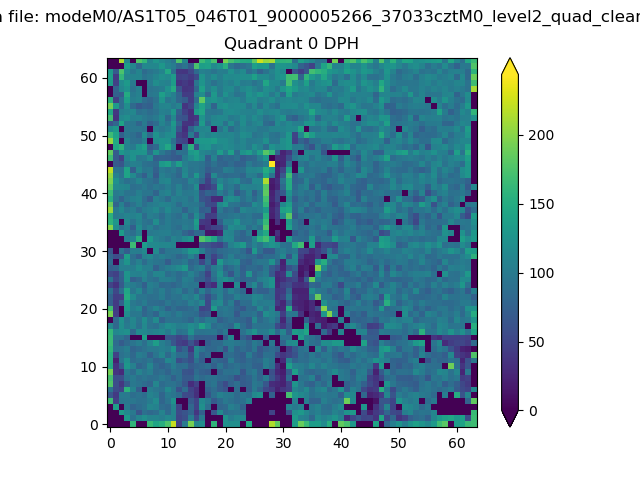 |
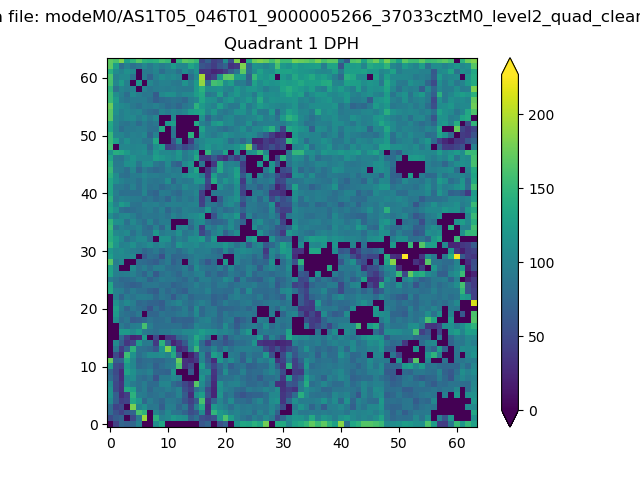 |
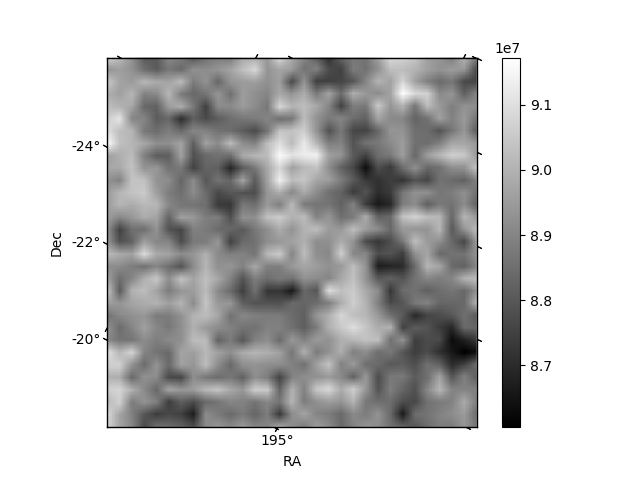
Quadrant B |
|---|---|---|---|
| Quadrant D | 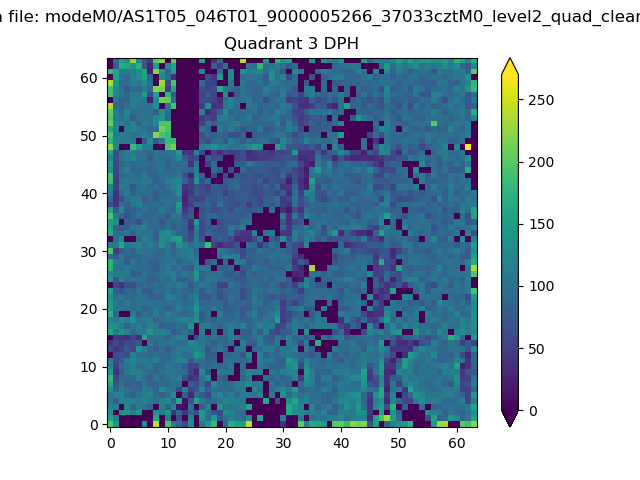 |
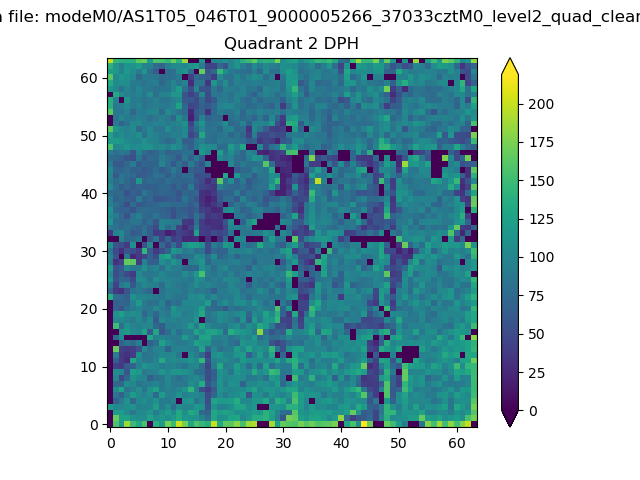 |
Quadrant C |
| Plot type | Count rate plots | Images |
|---|---|---|
| Comparison with Poisson distribution Blue bars denote a histogram of data divided into 1 sec bins. Red curve is a Poisson curve with rate = median count rate of data. |
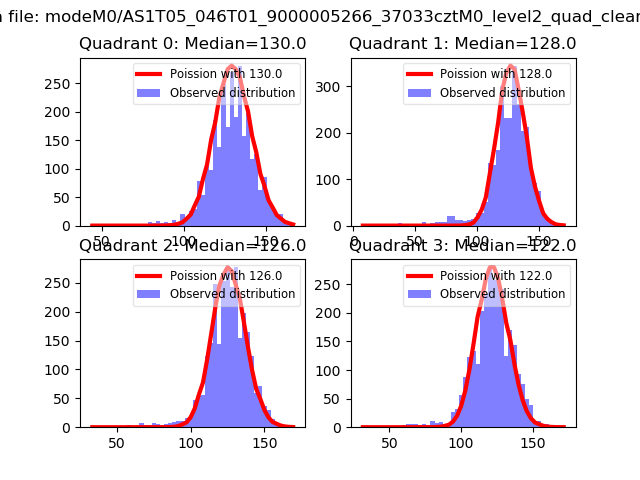 |
 |
| Quadrant-wise count rates Data is divided into 100 sec bins |
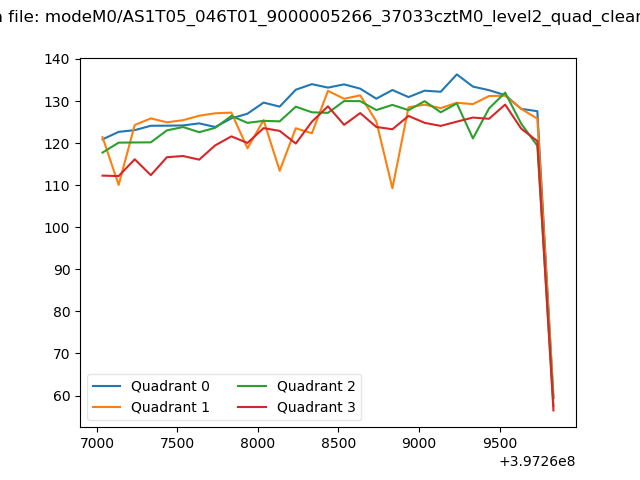 |
|
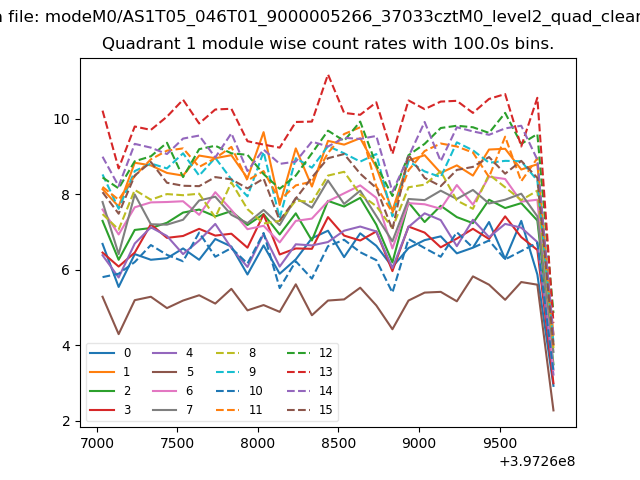
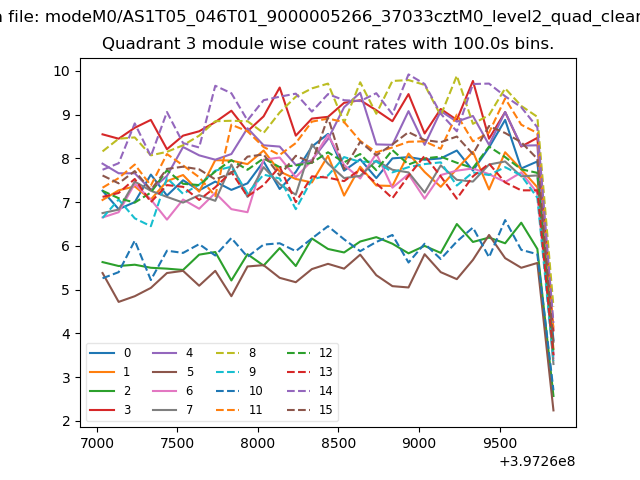
| Module-wise count rates for Quadrant A Data is divided into 100 sec bins |
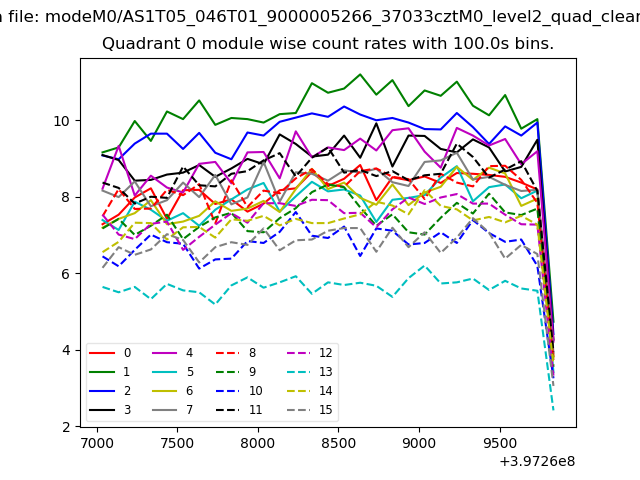 |
 |
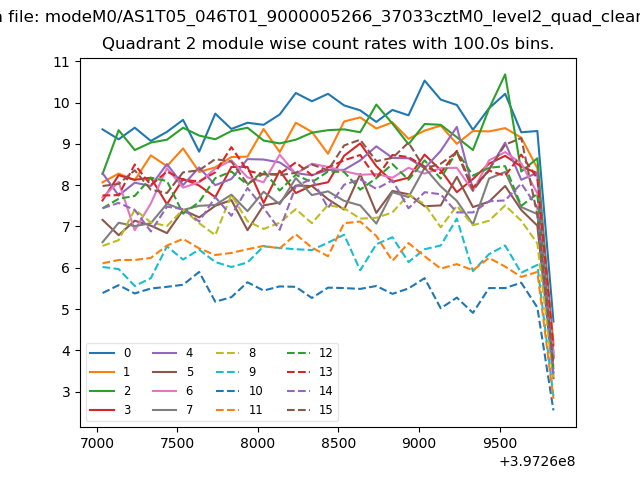
| Module-wise count rates for Quadrant B Data is divided into 100 sec bins |
 |
 |
| Module-wise count rates for Quadrant C Data is divided into 100 sec bins |
 |
 |
| Module-wise count rates for Quadrant D Data is divided into 100 sec bins |
 |
 |
| Parameter | Plot |
|---|---|
| CZT HV Monitor | 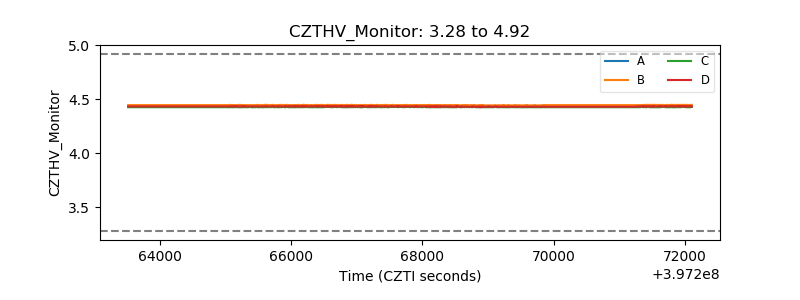 |
| D_VDD | 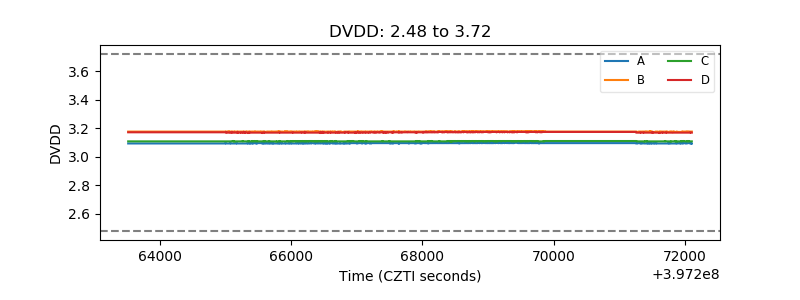 |
| Temperature 1 | 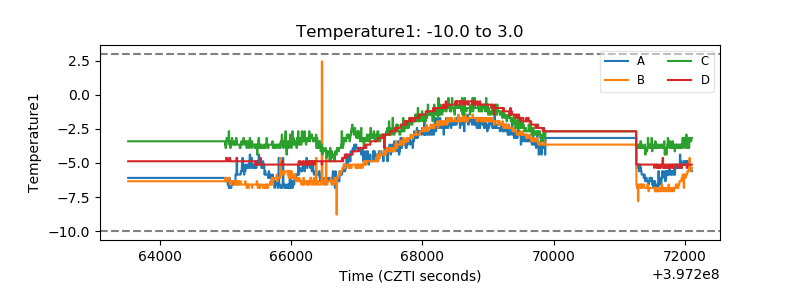 |
| Veto HV Monitor | 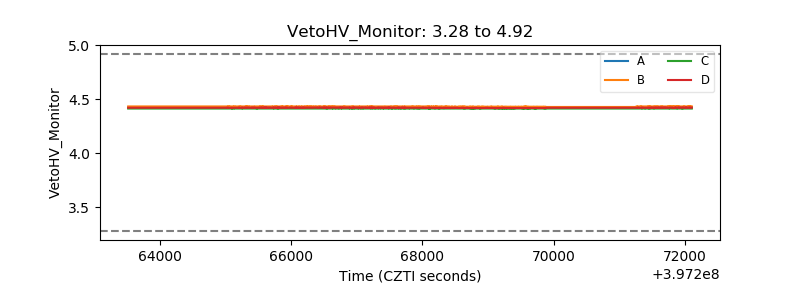 |
| Veto LLD | 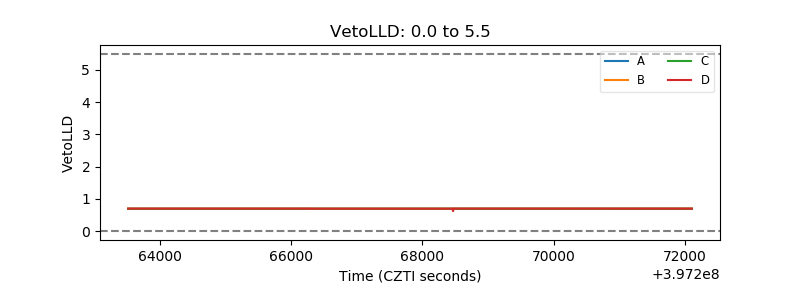 |
| Alpha Counter | 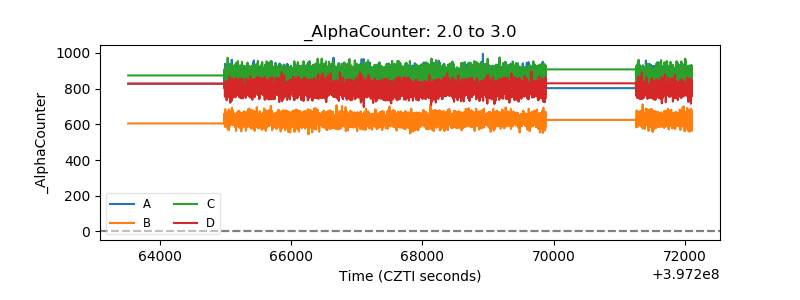 |
| _CPM_Rate | 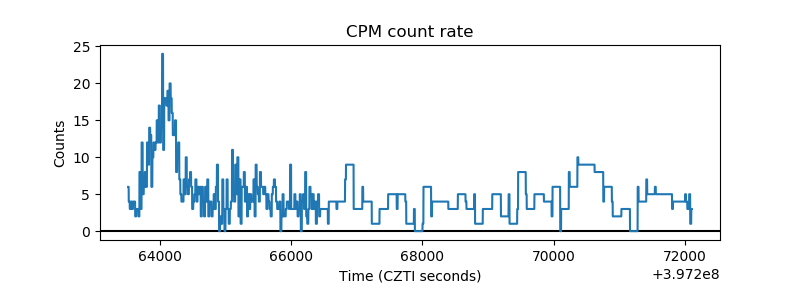 |
| CZT Counter | 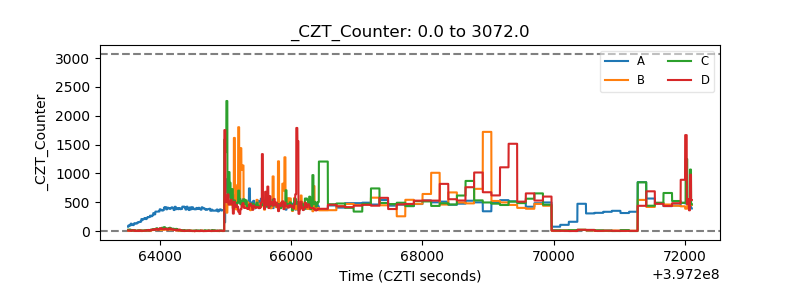 |
| +2.5 Volts monitor | 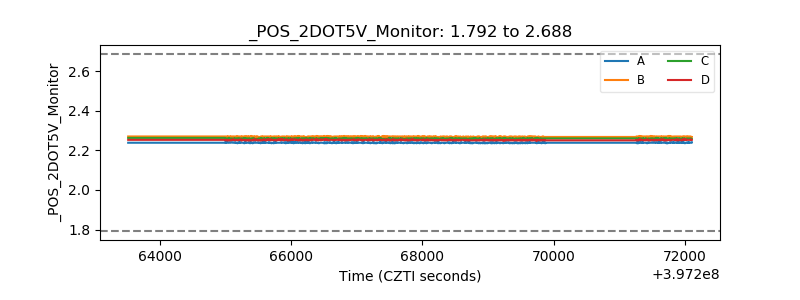 |
| +5 Volts monitor | 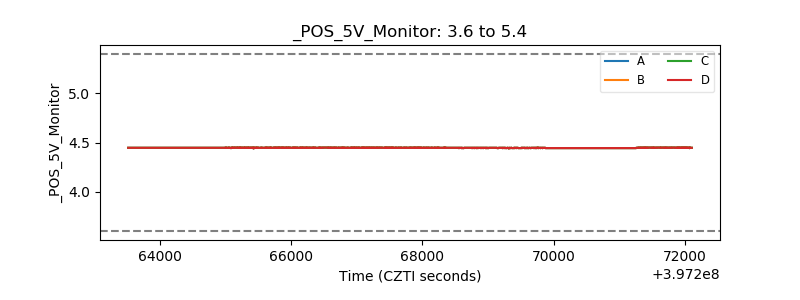 |
| _ROLL_ROT | 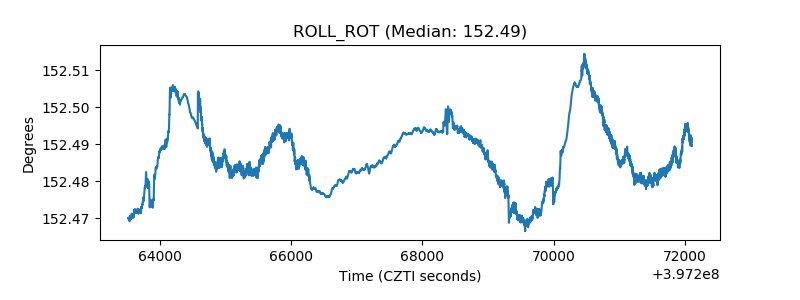 |
| _Roll_DEC | 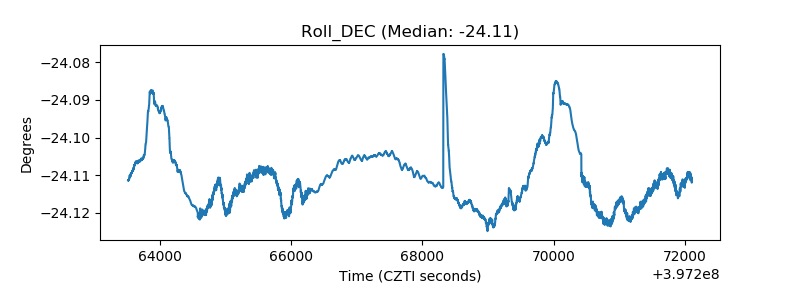 |
| _Roll_RA | 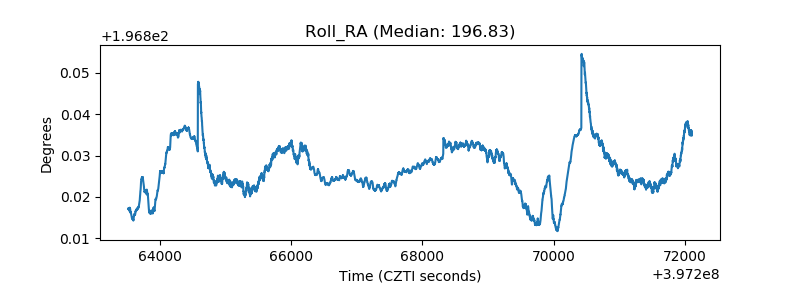 |
| Veto Counter | 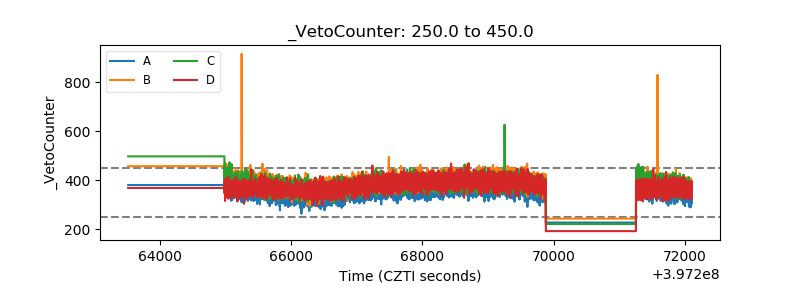 |