| Param | Original file | Final file |
|---|---|---|
| Filename | modeM0/AS1T05_046T01_9000005266_37034cztM0_level2.evt | modeM0/AS1T05_046T01_9000005266_37034cztM0_level2_quad_clean.evt |
| Size (bytes) | 1,086,684,480 | 164,485,440 |
| Size | 1.0 GB | 156.9 MB |
| Events in quadrant A | 6,921,162 | 1,028,796 |
| Events in quadrant B | 7,231,915 | 1,031,987 |
| Events in quadrant C | 9,250,064 | 992,888 |
| Events in quadrant D | 8,560,271 | 959,562 |
| Mode M0 | |||
|---|---|---|---|
| Quadrant | BADHDUFLAG | Total packets | Discarded packets |
| A | 0 | 29133 | 3 |
| B | 0 | 30481 | 3 |
| C | 0 | 36380 | 3 |
| D | 0 | 34967 | 3 |
| Mode SS | |||
|---|---|---|---|
| Quadrant | BADHDUFLAG | Total packets | Discarded packets |
| A | 0 | 284 | 0 |
| B | 0 | 284 | 0 |
| C | 0 | 284 | 0 |
| D | 0 | 284 | 0 |
| Mode M9 | |||
|---|---|---|---|
| Quadrant | BADHDUFLAG | Total packets | Discarded packets |
| A | 0 | 39 | 0 |
| B | 0 | 39 | 0 |
| C | 0 | 39 | 0 |
| D | 0 | 40 | 0 |
| Quadrant | Total seconds | Saturated seconds | Saturation percentage |
|---|---|---|---|
| A | 14032 | 31 | 0.220924% |
| B | 14032 | 77 | 0.548746% |
| C | 14031 | 307 | 2.188012% |
| D | 14031 | 279 | 1.988454% |
Noise dominated data is calculated using 1-second bins in cleaned event files. If a bin has >2000 counts, and if more than 50% of those come from <1% of pixels, then it is considered to be noise-dominated and hence unusable.
| Quadrant | # 1 sec bins | Bins with >0 counts | Bins with >2000 counts | High rate bins dominated by noise | Noise dominated (total time) | Noise dominated (detector-on time) | Marked lightcurve |
|---|---|---|---|---|---|---|---|
| A | 23767 | 14035 | 14 | 14 | 0.06% | 0.10% | 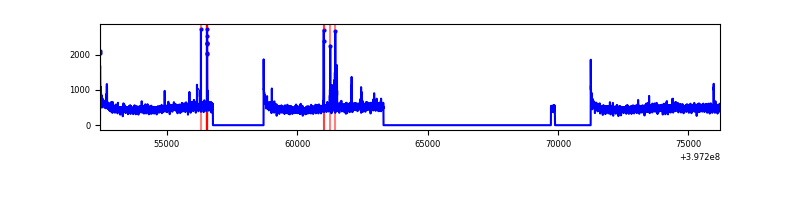 |
| B | 23767 | 14035 | 51 | 51 | 0.21% | 0.36% | 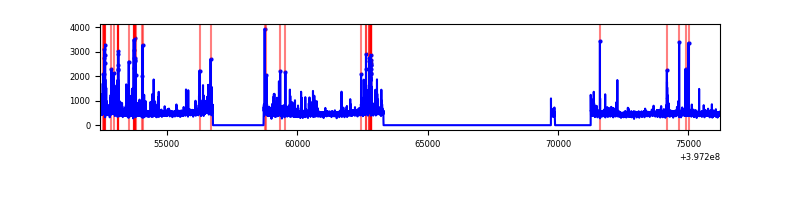 |
| C | 23767 | 14034 | 274 | 274 | 1.15% | 1.95% | 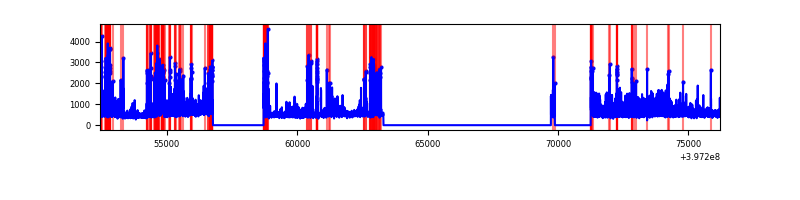 |
| D | 23767 | 14034 | 257 | 257 | 1.08% | 1.83% | 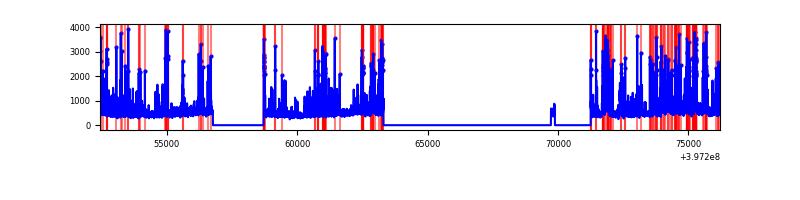 |
Top three noisy pixels from each quadrant. If the there are fewer than three noisy pixels in the level2.evt file, extra rows are filled as -1
| Pixel properties | Quadrant properties | ||||||
|---|---|---|---|---|---|---|---|
| Quadrant | DetID | PixID | Counts | Sigma | Mean | Median | Sigma |
| A | 10 | 83 | 488555 | 1498.51 | 1626 | 1593 | 325.0 |
| A | 9 | 143 | 79407 | 239.45 | 1626 | 1593 | 325.0 |
| A | 13 | 6 | 35026 | 102.88 | 1626 | 1593 | 325.0 |
| B | 5 | 184 | 231368 | 751.63 | 1608 | 1565 | 305.7 |
| B | 5 | 172 | 201964 | 655.46 | 1608 | 1565 | 305.7 |
| B | 0 | 213 | 138129 | 446.67 | 1608 | 1565 | 305.7 |
| C | 0 | 10 | 1055620 | 2944.08 | 1554 | 1565 | 358.0 |
| C | 1 | 23 | 613056 | 1707.96 | 1554 | 1565 | 358.0 |
| C | 15 | 214 | 589646 | 1642.57 | 1554 | 1565 | 358.0 |
| D | 2 | 250 | 725964 | 1909.31 | 1563 | 1522 | 379.4 |
| D | 2 | 249 | 483013 | 1269.0 | 1563 | 1522 | 379.4 |
| D | 13 | 249 | 449259 | 1180.04 | 1563 | 1522 | 379.4 |
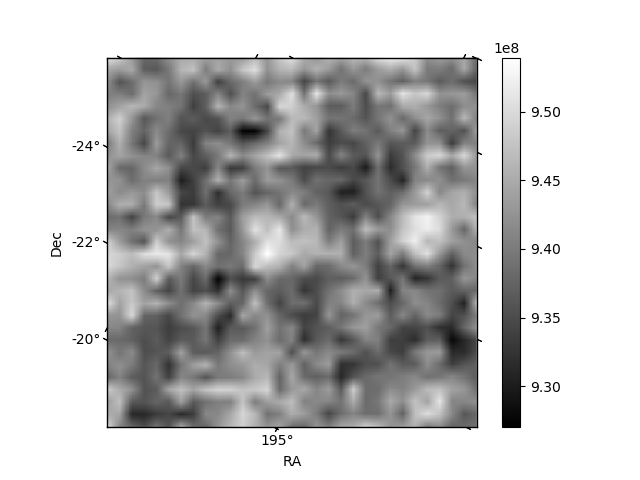
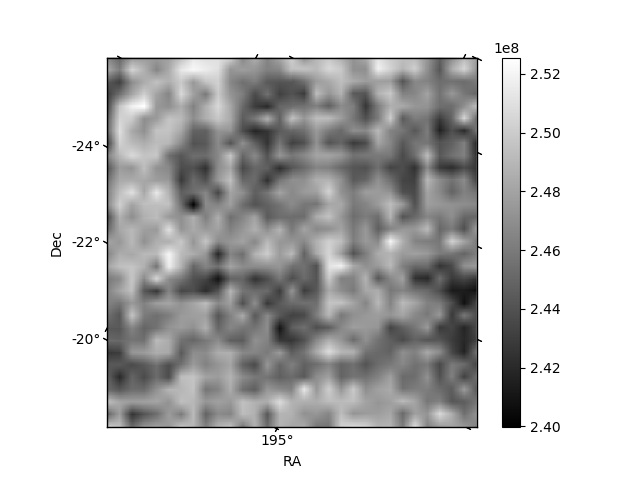
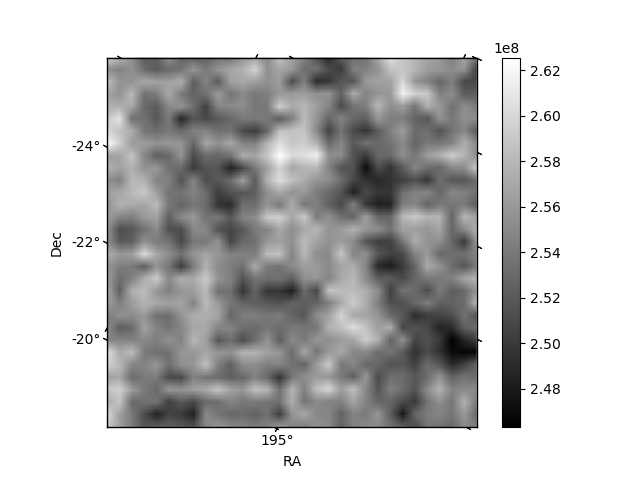
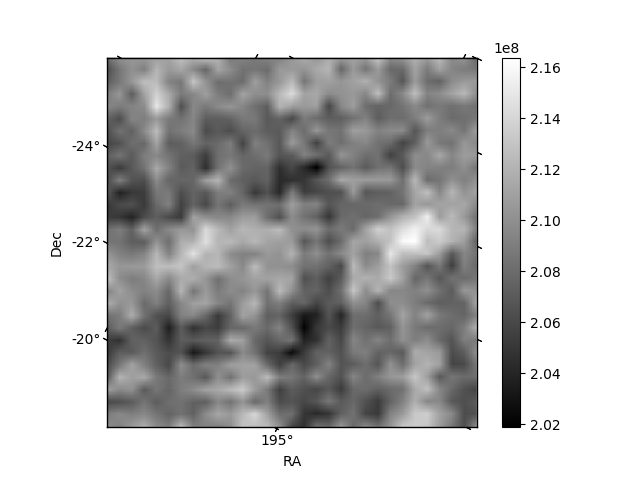
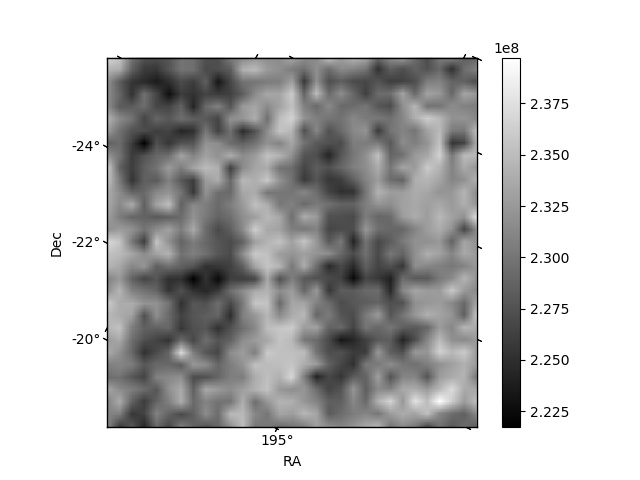
Histogram calculated using DETX and DETY for each event in the final _common_clean file
| Quadrant A | 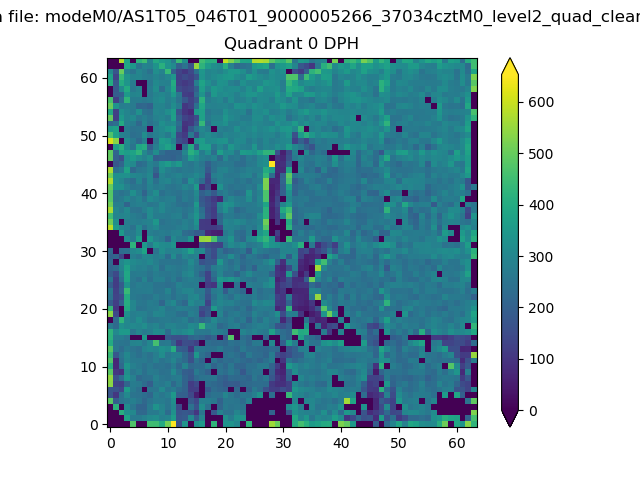 |
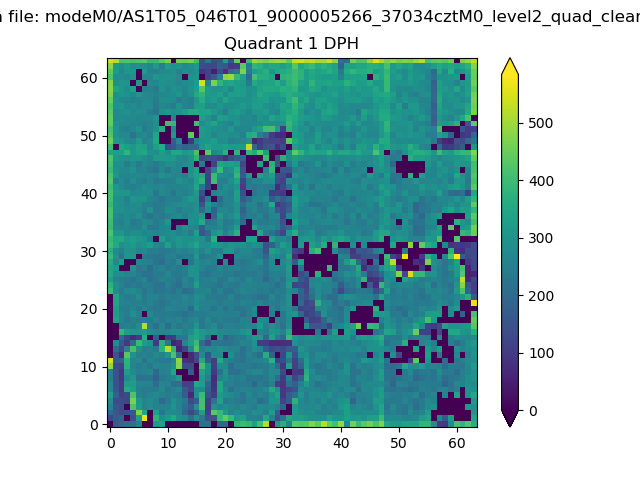 |
Quadrant B |
|---|---|---|---|
| Quadrant D | 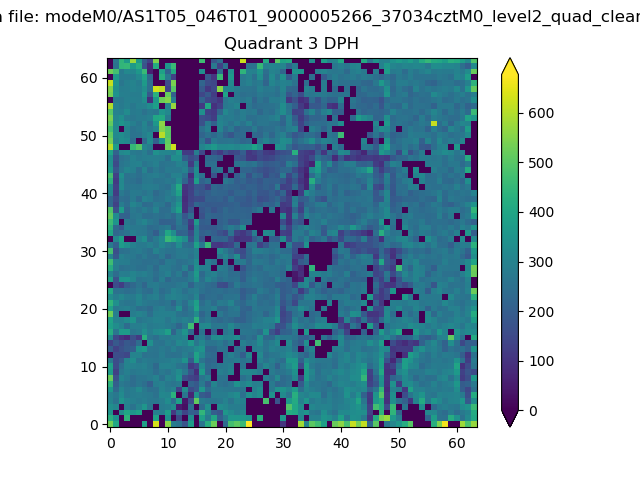 |
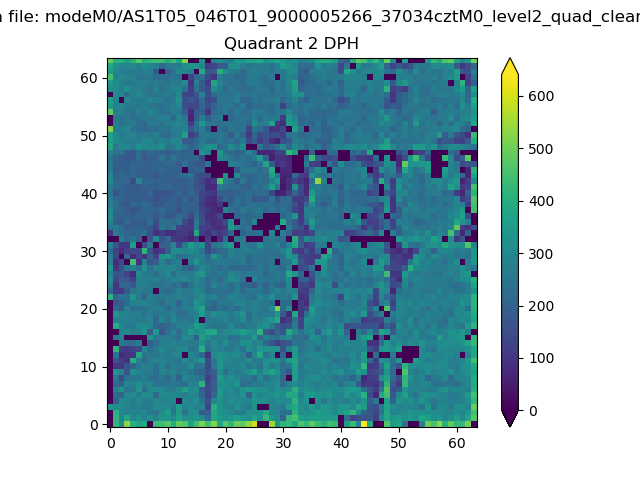 |
Quadrant C |
| Plot type | Count rate plots | Images |
|---|---|---|
| Comparison with Poisson distribution Blue bars denote a histogram of data divided into 1 sec bins. Red curve is a Poisson curve with rate = median count rate of data. |
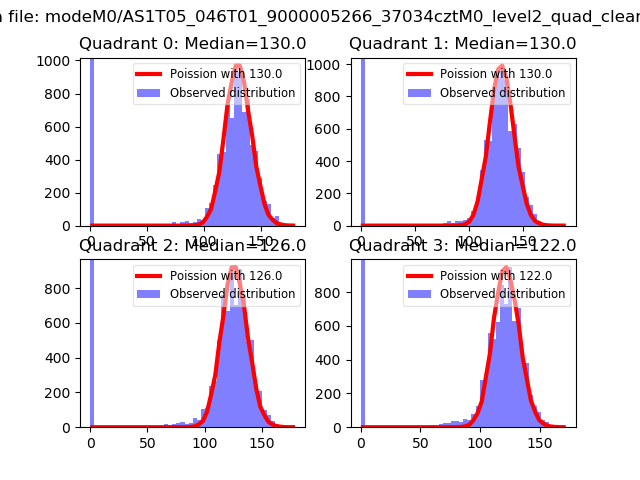 |
 |
| Quadrant-wise count rates Data is divided into 100 sec bins |
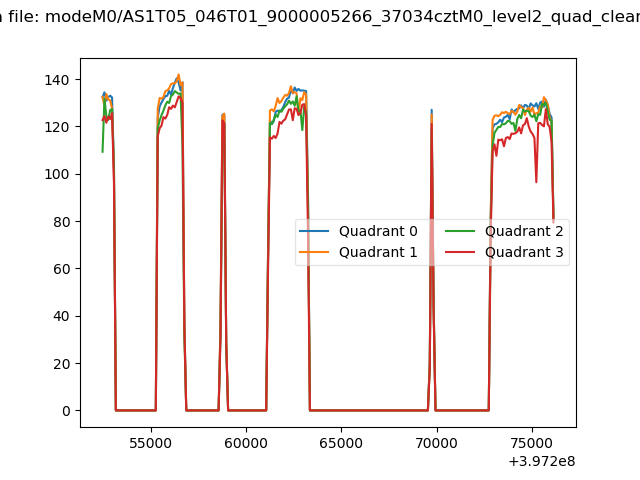 |
|
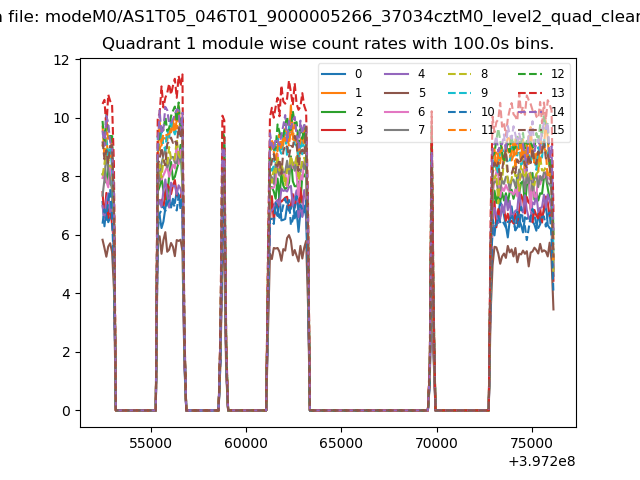
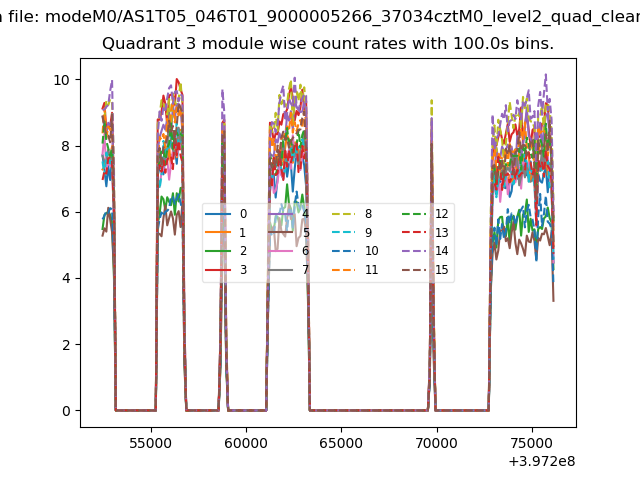
| Module-wise count rates for Quadrant A Data is divided into 100 sec bins |
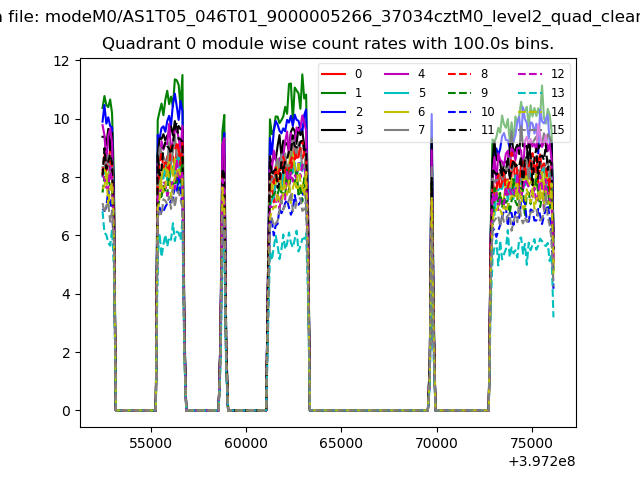 |
 |
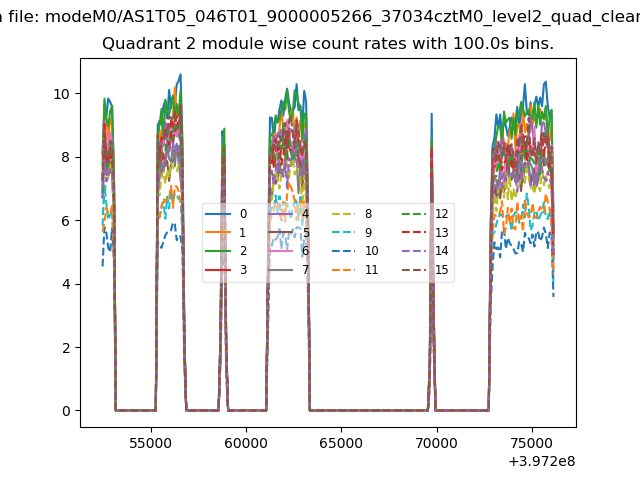
| Module-wise count rates for Quadrant B Data is divided into 100 sec bins |
 |
 |
| Module-wise count rates for Quadrant C Data is divided into 100 sec bins |
 |
 |
| Module-wise count rates for Quadrant D Data is divided into 100 sec bins |
 |
 |
| Parameter | Plot |
|---|---|
| CZT HV Monitor | 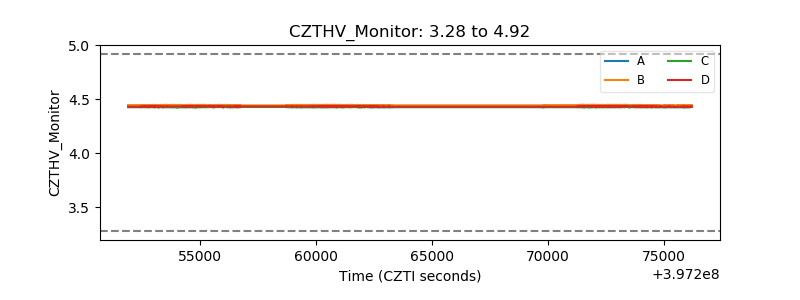 |
| D_VDD | 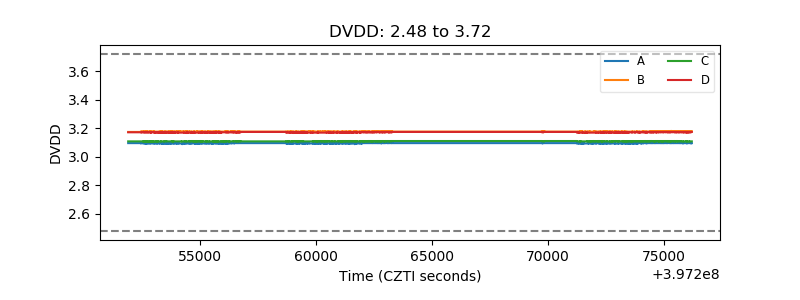 |
| Temperature 1 | 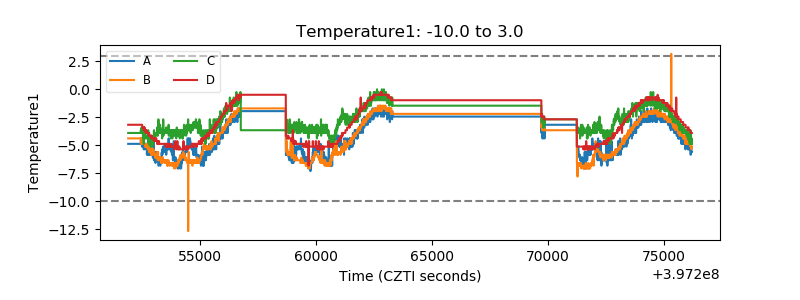 |
| Veto HV Monitor | 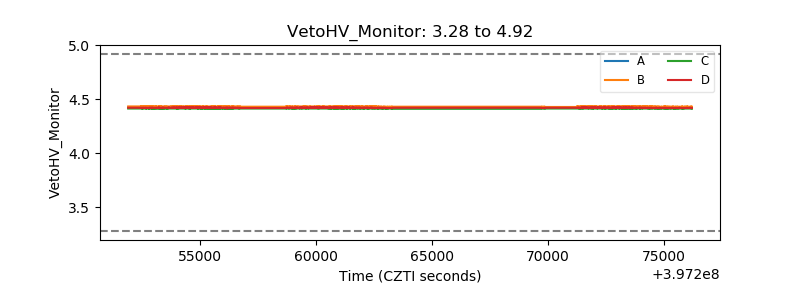 |
| Veto LLD | 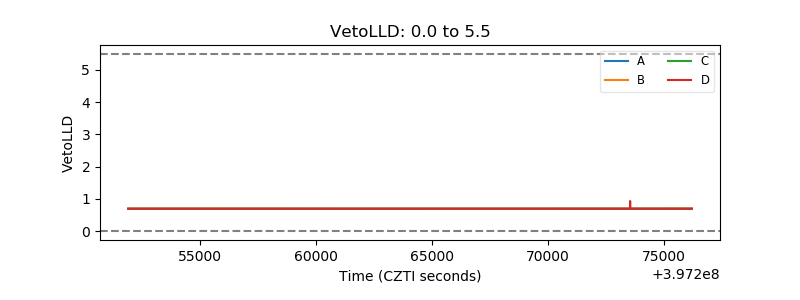 |
| Alpha Counter | 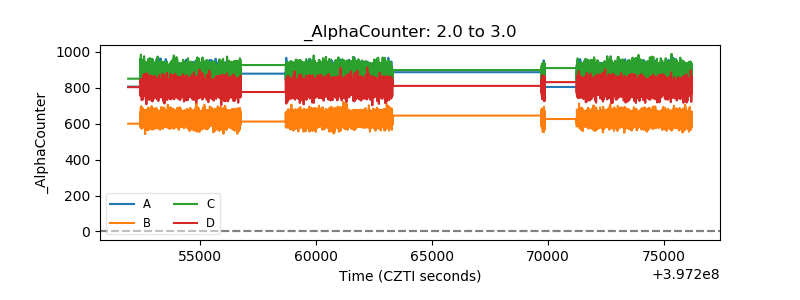 |
| _CPM_Rate | 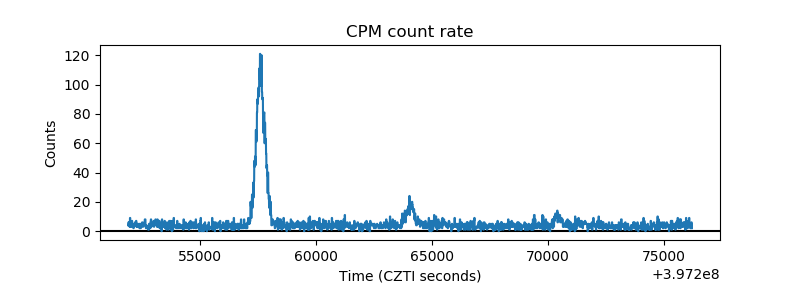 |
| CZT Counter | 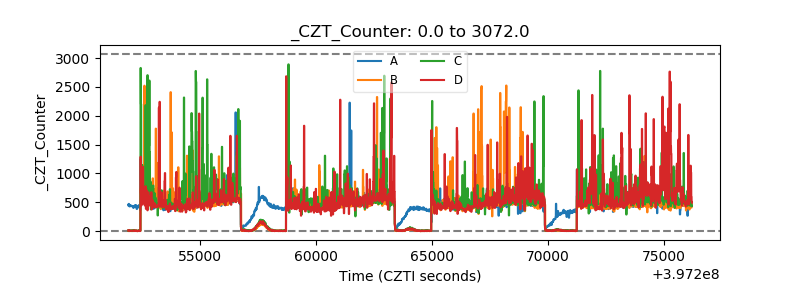 |
| +2.5 Volts monitor | 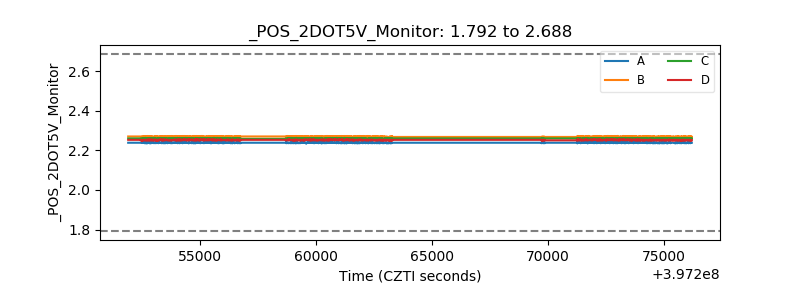 |
| +5 Volts monitor | 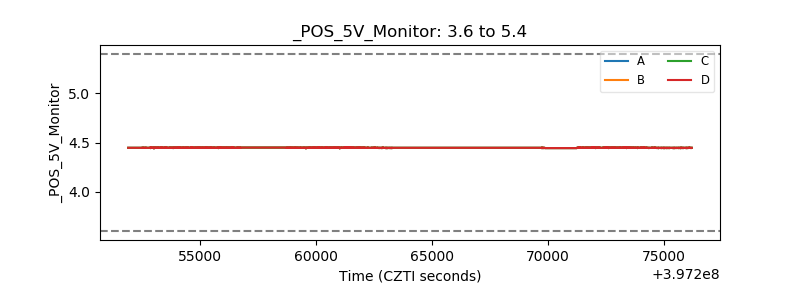 |
| _ROLL_ROT | 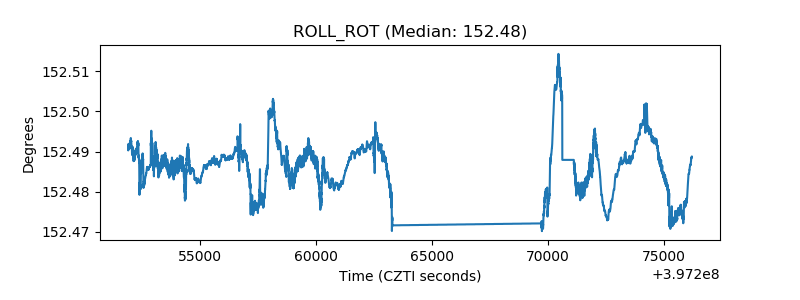 |
| _Roll_DEC | 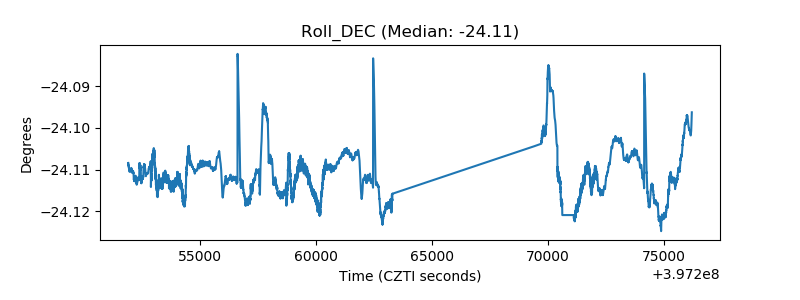 |
| _Roll_RA | 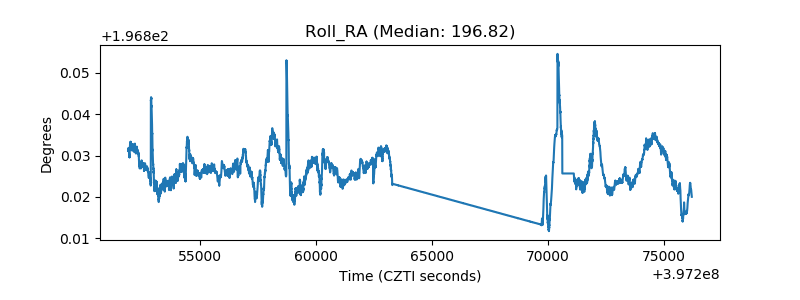 |
| Veto Counter | 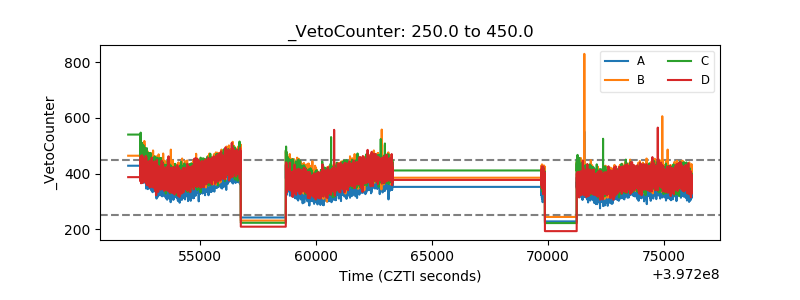 |