| Param | Original file | Final file |
|---|---|---|
| Filename | modeM0/AS1A11_046T02_9000005274_37048cztM0_level2.evt | modeM0/AS1A11_046T02_9000005274_37048cztM0_level2_quad_clean.evt |
| Size (bytes) | 498,058,560 | 58,406,400 |
| Size | 475.0 MB | 55.7 MB |
| Events in quadrant A | 2,542,585 | 360,799 |
| Events in quadrant B | 2,990,114 | 363,401 |
| Events in quadrant C | 2,976,685 | 360,952 |
| Events in quadrant D | 6,220,292 | 317,262 |
| Mode M9 | |||
|---|---|---|---|
| Quadrant | BADHDUFLAG | Total packets | Discarded packets |
| A | 0 | 13 | 0 |
| B | 0 | 13 | 0 |
| C | 0 | 13 | 0 |
| D | 0 | 13 | 0 |
| Mode SS | |||
|---|---|---|---|
| Quadrant | BADHDUFLAG | Total packets | Discarded packets |
| A | 0 | 108 | 0 |
| B | 0 | 108 | 0 |
| C | 0 | 108 | 0 |
| D | 0 | 108 | 0 |
| Mode M0 | |||
|---|---|---|---|
| Quadrant | BADHDUFLAG | Total packets | Discarded packets |
| A | 0 | 11054 | 2 |
| B | 0 | 12599 | 1 |
| C | 0 | 12259 | 1 |
| D | 0 | 22119 | 1 |
| Quadrant | Total seconds | Saturated seconds | Saturation percentage |
|---|---|---|---|
| A | 5214 | 7 | 0.134254% |
| B | 5214 | 152 | 2.915228% |
| C | 5214 | 42 | 0.805524% |
| D | 5214 | 1142 | 21.902570% |
Noise dominated data is calculated using 1-second bins in cleaned event files. If a bin has >2000 counts, and if more than 50% of those come from <1% of pixels, then it is considered to be noise-dominated and hence unusable.
| Quadrant | # 1 sec bins | Bins with >0 counts | Bins with >2000 counts | High rate bins dominated by noise | Noise dominated (total time) | Noise dominated (detector-on time) | Marked lightcurve |
|---|---|---|---|---|---|---|---|
| A | 6525 | 5215 | 0 | 0 | 0.00% | 0.00% | 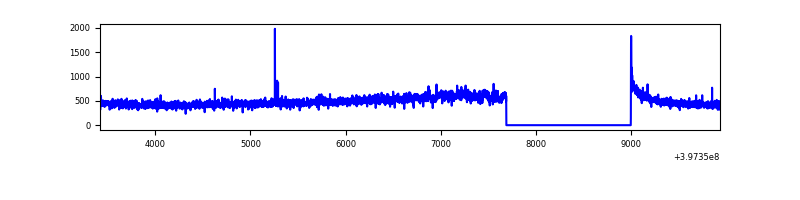 |
| B | 6525 | 5215 | 94 | 94 | 1.44% | 1.80% | 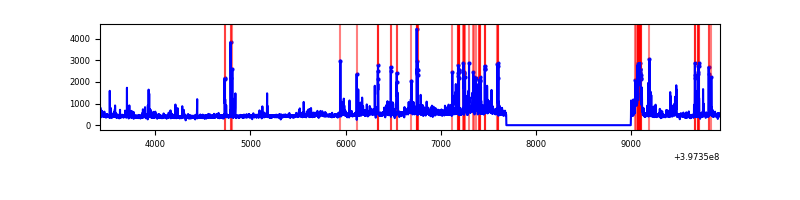 |
| C | 6525 | 5215 | 32 | 32 | 0.49% | 0.61% | 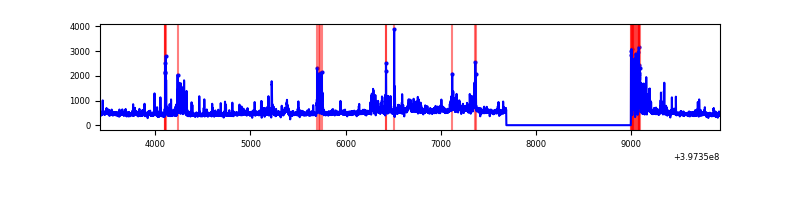 |
| D | 6525 | 5215 | 987 | 987 | 15.13% | 18.93% | 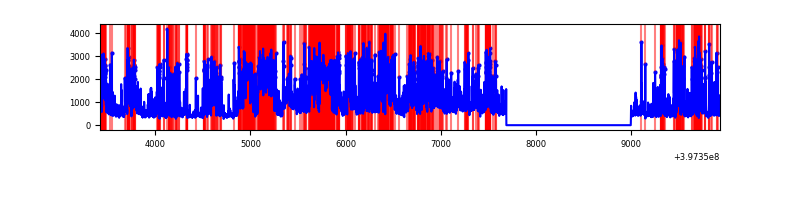 |
Top three noisy pixels from each quadrant. If the there are fewer than three noisy pixels in the level2.evt file, extra rows are filled as -1
| Pixel properties | Quadrant properties | ||||||
|---|---|---|---|---|---|---|---|
| Quadrant | DetID | PixID | Counts | Sigma | Mean | Median | Sigma |
| A | 10 | 83 | 192051 | 1603.33 | 586 | 574 | 119.4 |
| A | 11 | 254 | 66590 | 552.78 | 586 | 574 | 119.4 |
| A | 13 | 6 | 7966 | 61.9 | 586 | 574 | 119.4 |
| B | 5 | 172 | 318014 | 2856.74 | 577 | 561 | 111.1 |
| B | 0 | 229 | 148083 | 1327.54 | 577 | 561 | 111.1 |
| B | 5 | 184 | 97561 | 872.9 | 577 | 561 | 111.1 |
| C | 14 | 254 | 310736 | 2346.07 | 568 | 570 | 132.2 |
| C | 15 | 214 | 215689 | 1627.14 | 568 | 570 | 132.2 |
| C | 0 | 10 | 143344 | 1079.93 | 568 | 570 | 132.2 |
| D | 12 | 17 | 3044236 | 24098.71 | 516 | 501 | 126.3 |
| D | 1 | 52 | 613683 | 4854.86 | 516 | 501 | 126.3 |
| D | 2 | 250 | 189188 | 1493.93 | 516 | 501 | 126.3 |
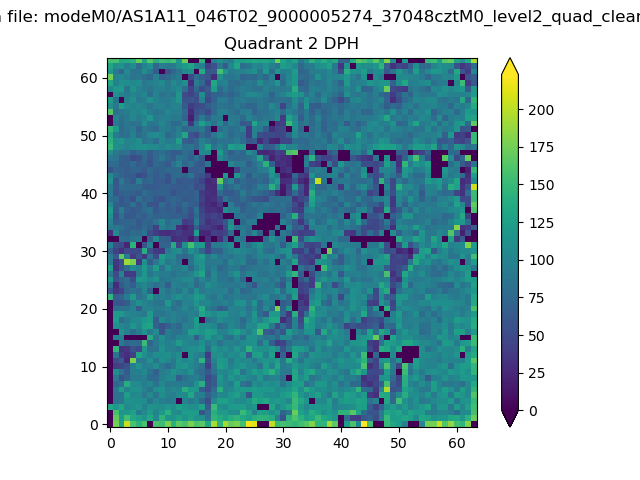
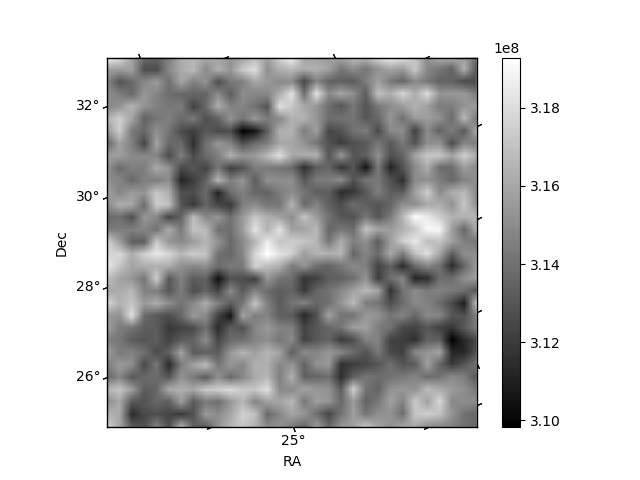
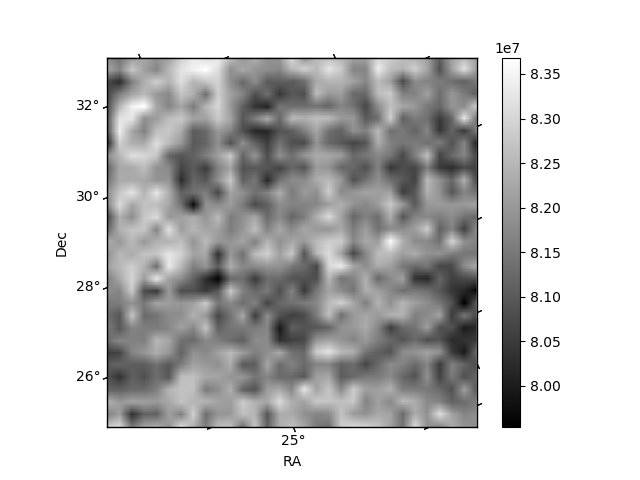
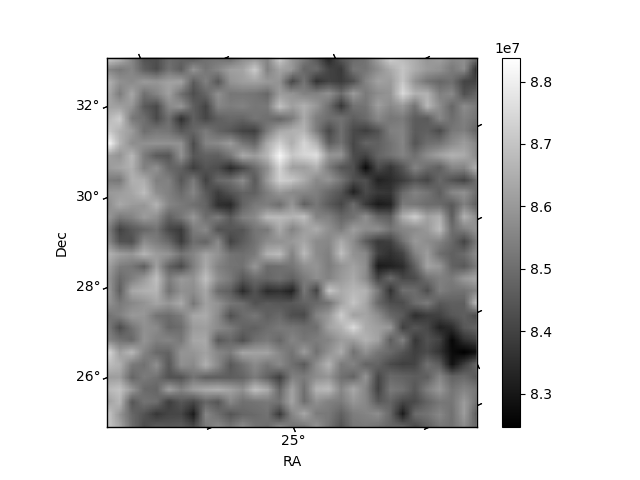
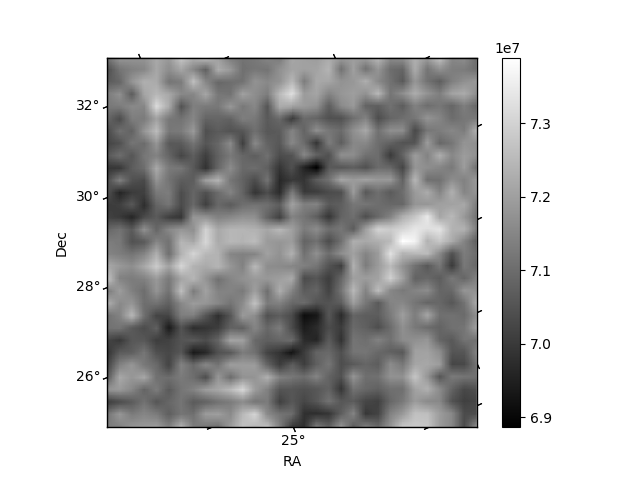
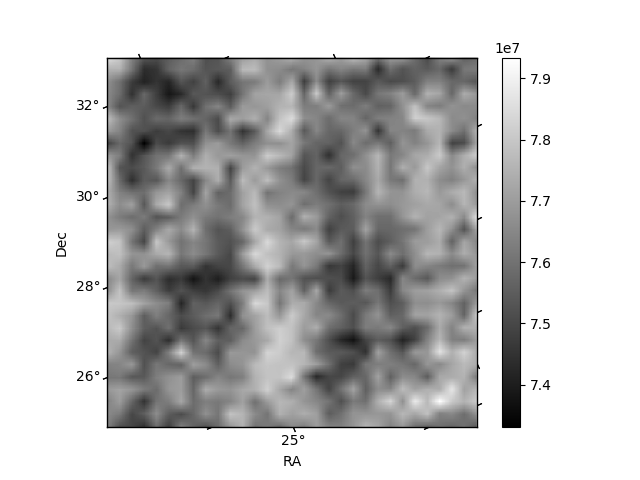
Histogram calculated using DETX and DETY for each event in the final _common_clean file
| Quadrant A | 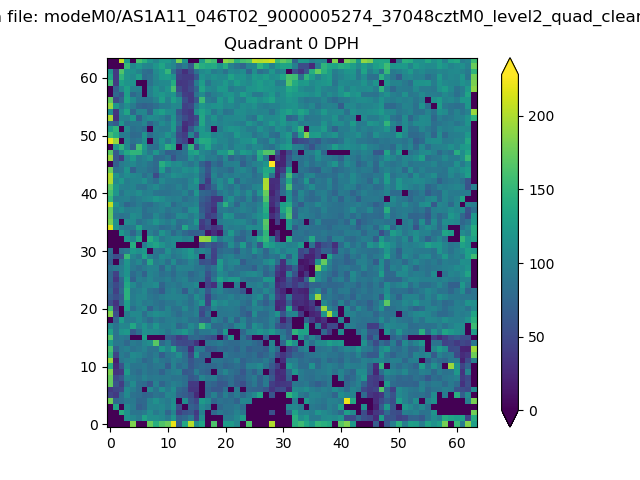 |
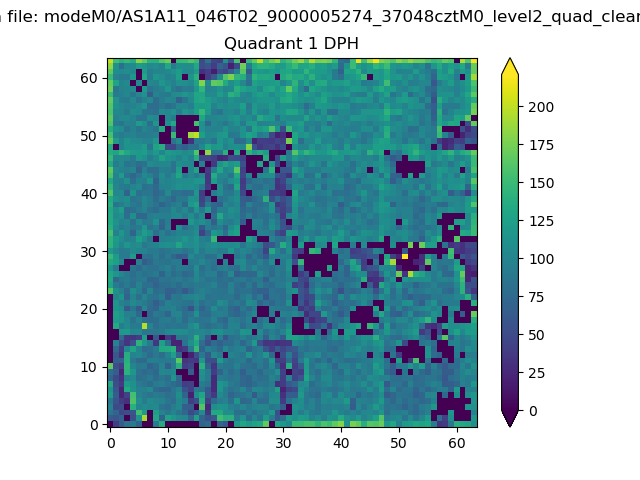 |
Quadrant B |
|---|---|---|---|
| Quadrant D | 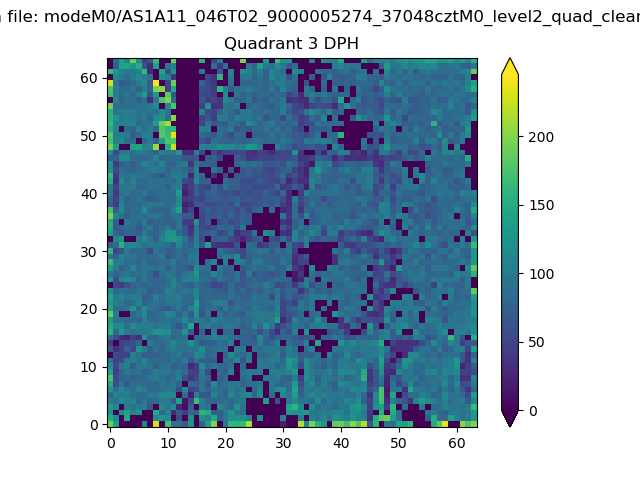 |
 |
Quadrant C |
| Plot type | Count rate plots | Images |
|---|---|---|
| Comparison with Poisson distribution Blue bars denote a histogram of data divided into 1 sec bins. Red curve is a Poisson curve with rate = median count rate of data. |
 |
 |
| Quadrant-wise count rates Data is divided into 100 sec bins |
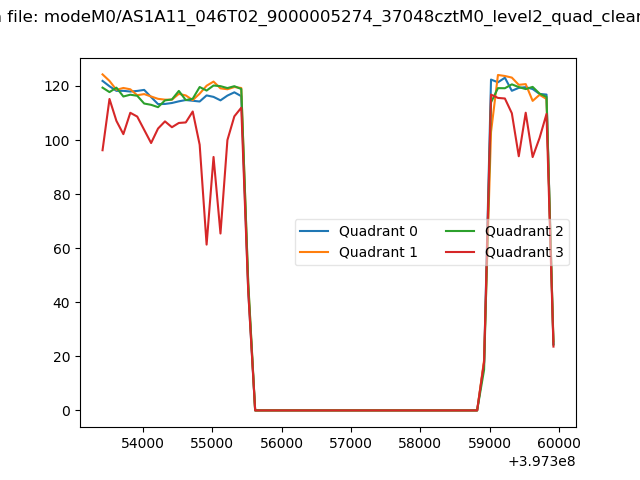 |
|
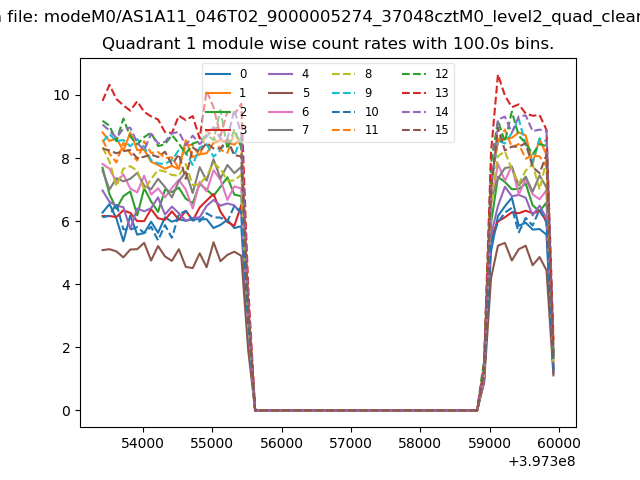
| Module-wise count rates for Quadrant A Data is divided into 100 sec bins |
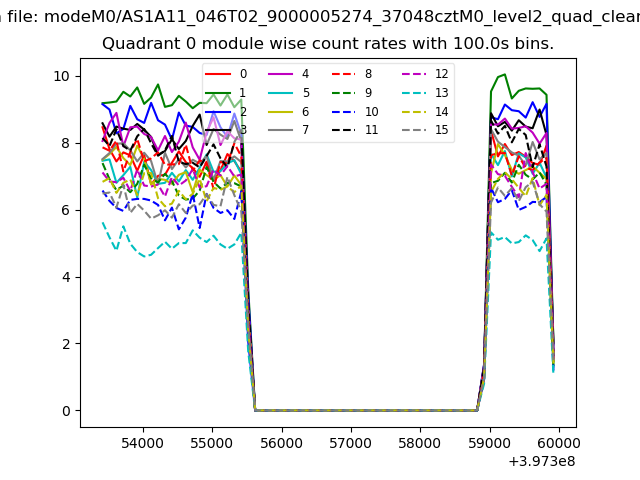 |
 |
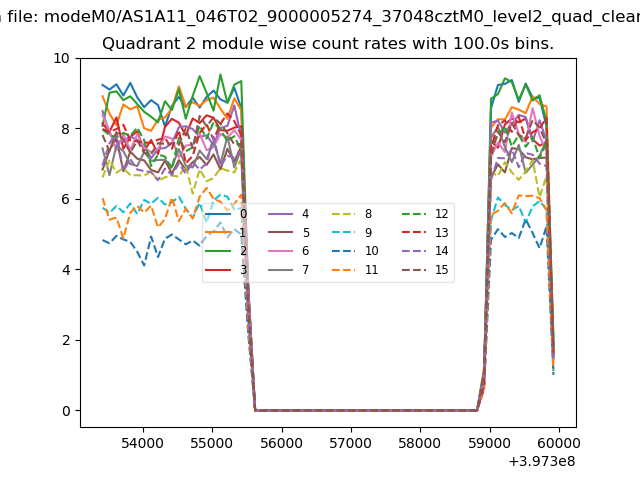
| Module-wise count rates for Quadrant B Data is divided into 100 sec bins |
 |
 |
| Module-wise count rates for Quadrant C Data is divided into 100 sec bins |
 |
 |
| Module-wise count rates for Quadrant D Data is divided into 100 sec bins |
 |
 |
| Parameter | Plot |
|---|---|
| CZT HV Monitor | 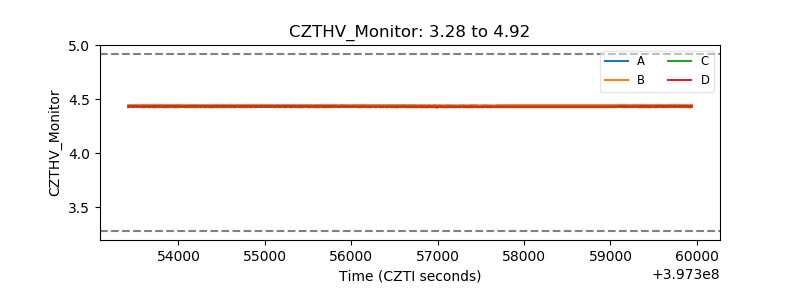 |
| D_VDD | 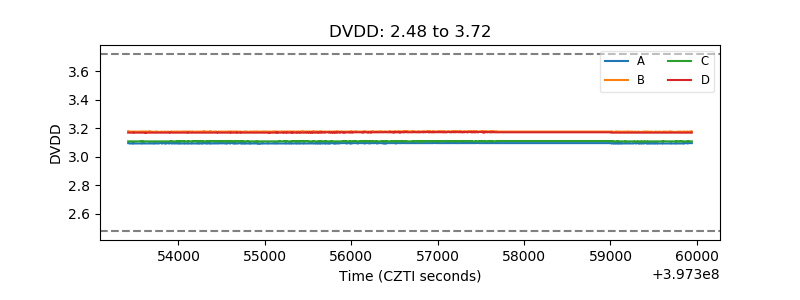 |
| Temperature 1 |  |
| Veto HV Monitor | 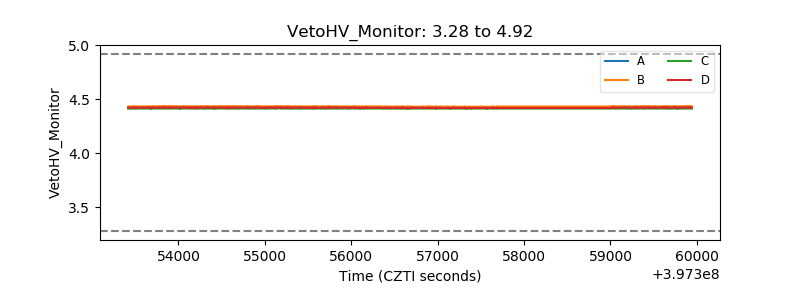 |
| Veto LLD | 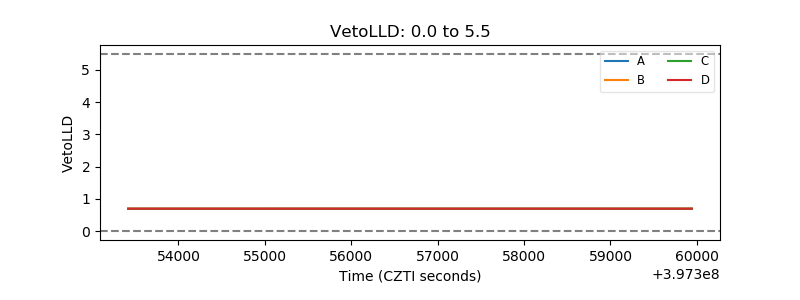 |
| Alpha Counter |  |
| _CPM_Rate | 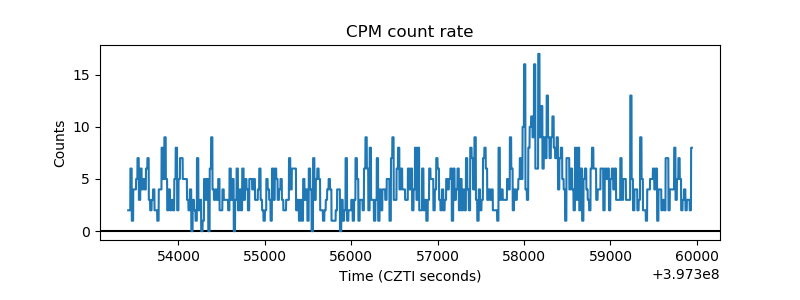 |
| CZT Counter | 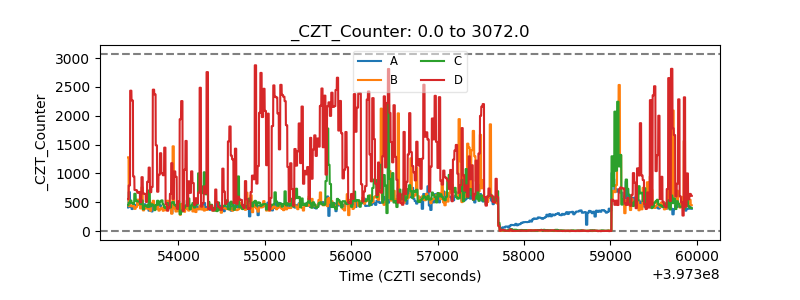 |
| +2.5 Volts monitor | 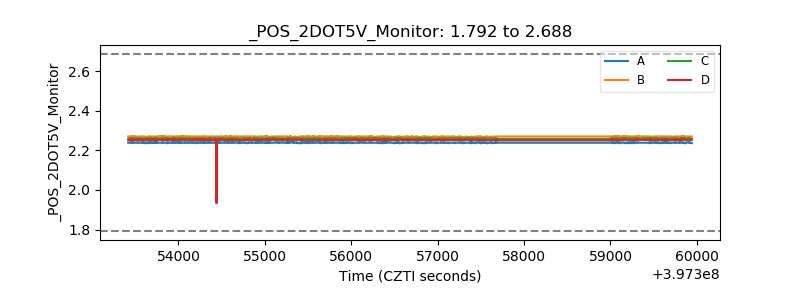 |
| +5 Volts monitor |  |
| _ROLL_ROT | 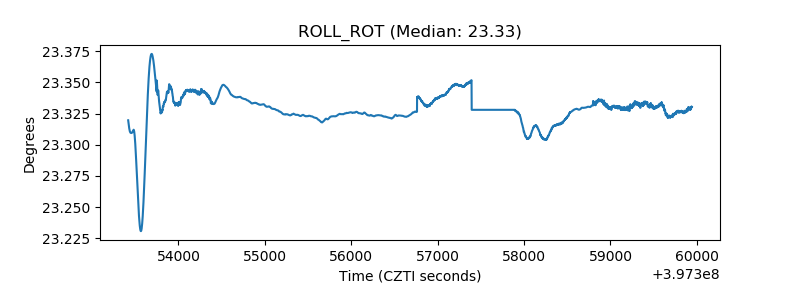 |
| _Roll_DEC | 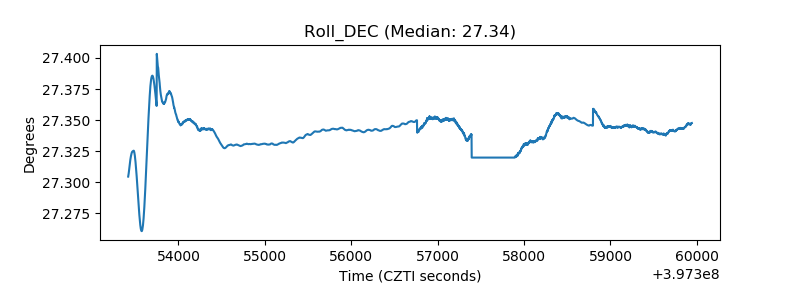 |
| _Roll_RA | 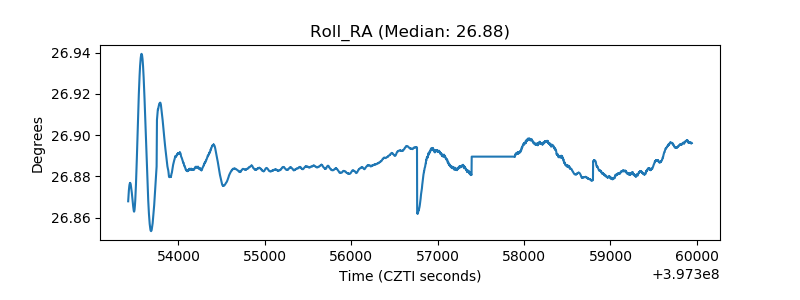 |
| Veto Counter | 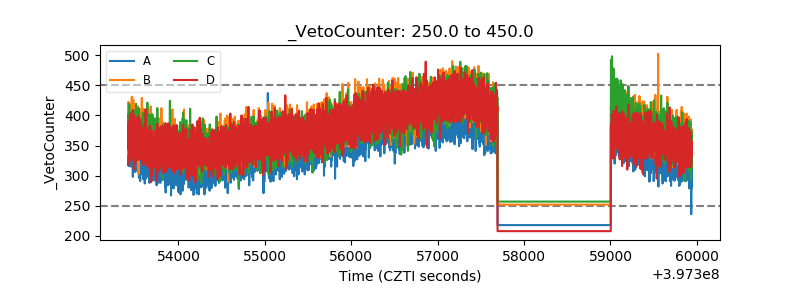 |