| Param | Original file | Final file |
|---|---|---|
| Filename | modeM0/AS1A11_046T02_9000005274_37051cztM0_level2.evt | modeM0/AS1A11_046T02_9000005274_37051cztM0_level2_quad_clean.evt |
| Size (bytes) | 1,468,077,120 | 161,452,800 |
| Size | 1.4 GB | 154.0 MB |
| Events in quadrant A | 7,843,157 | 986,335 |
| Events in quadrant B | 9,624,861 | 988,519 |
| Events in quadrant C | 9,915,803 | 971,346 |
| Events in quadrant D | 16,037,474 | 877,840 |
| Mode M9 | |||
|---|---|---|---|
| Quadrant | BADHDUFLAG | Total packets | Discarded packets |
| A | 0 | 54 | 0 |
| B | 0 | 54 | 0 |
| C | 0 | 54 | 0 |
| D | 0 | 54 | 0 |
| Mode SS | |||
|---|---|---|---|
| Quadrant | BADHDUFLAG | Total packets | Discarded packets |
| A | 0 | 318 | 0 |
| B | 0 | 318 | 0 |
| C | 0 | 318 | 0 |
| D | 0 | 318 | 0 |
| Mode M0 | |||
|---|---|---|---|
| Quadrant | BADHDUFLAG | Total packets | Discarded packets |
| A | 0 | 33133 | 5 |
| B | 0 | 38851 | 4 |
| C | 0 | 39469 | 4 |
| D | 0 | 58643 | 4 |
| Quadrant | Total seconds | Saturated seconds | Saturation percentage |
|---|---|---|---|
| A | 15428 | 25 | 0.162043% |
| B | 15428 | 617 | 3.999222% |
| C | 15428 | 337 | 2.184340% |
| D | 15428 | 2626 | 17.021001% |
Noise dominated data is calculated using 1-second bins in cleaned event files. If a bin has >2000 counts, and if more than 50% of those come from <1% of pixels, then it is considered to be noise-dominated and hence unusable.
| Quadrant | # 1 sec bins | Bins with >0 counts | Bins with >2000 counts | High rate bins dominated by noise | Noise dominated (total time) | Noise dominated (detector-on time) | Marked lightcurve |
|---|---|---|---|---|---|---|---|
| A | 20919 | 15432 | 3 | 3 | 0.01% | 0.02% | 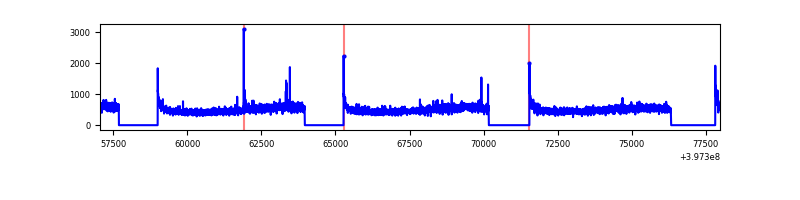 |
| B | 20919 | 15432 | 415 | 415 | 1.98% | 2.69% | 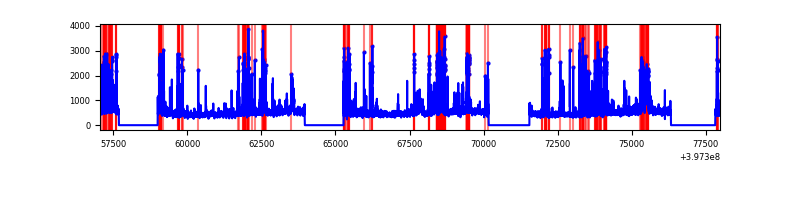 |
| C | 20919 | 15432 | 284 | 284 | 1.36% | 1.84% | 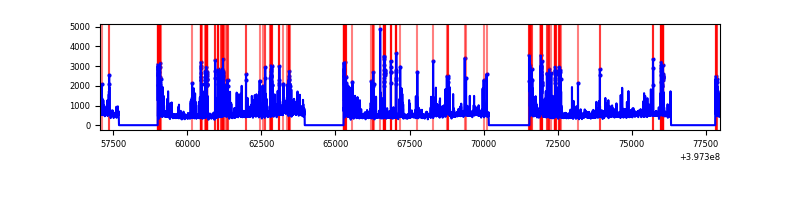 |
| D | 20919 | 15432 | 2100 | 2100 | 10.04% | 13.61% | 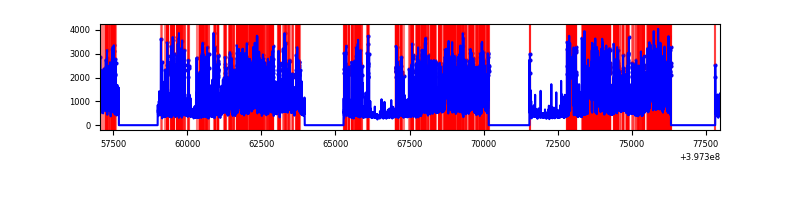 |
Top three noisy pixels from each quadrant. If the there are fewer than three noisy pixels in the level2.evt file, extra rows are filled as -1
| Pixel properties | Quadrant properties | ||||||
|---|---|---|---|---|---|---|---|
| Quadrant | DetID | PixID | Counts | Sigma | Mean | Median | Sigma |
| A | 10 | 83 | 623157 | 1740.73 | 1780 | 1742 | 357.0 |
| A | 11 | 254 | 267293 | 743.87 | 1780 | 1742 | 357.0 |
| A | 9 | 143 | 31078 | 82.18 | 1780 | 1742 | 357.0 |
| B | 5 | 172 | 1165480 | 3509.44 | 1743 | 1693 | 331.6 |
| B | 5 | 184 | 783585 | 2357.82 | 1743 | 1693 | 331.6 |
| B | 0 | 229 | 306869 | 920.27 | 1743 | 1693 | 331.6 |
| C | 14 | 254 | 1186884 | 2985.93 | 1711 | 1721 | 396.9 |
| C | 15 | 214 | 647791 | 1627.72 | 1711 | 1721 | 396.9 |
| C | 0 | 207 | 582847 | 1464.1 | 1711 | 1721 | 396.9 |
| D | 12 | 17 | 5148693 | 13273.82 | 1596 | 1555 | 387.8 |
| D | 1 | 52 | 1689444 | 4352.85 | 1596 | 1555 | 387.8 |
| D | 13 | 171 | 720397 | 1853.8 | 1596 | 1555 | 387.8 |
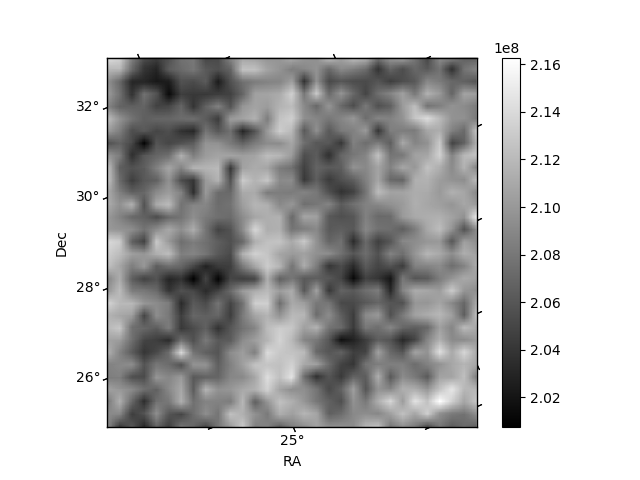
Histogram calculated using DETX and DETY for each event in the final _common_clean file
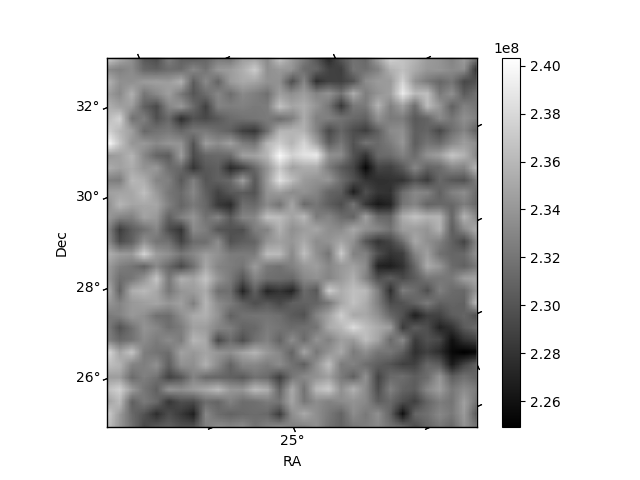
| Quadrant A | 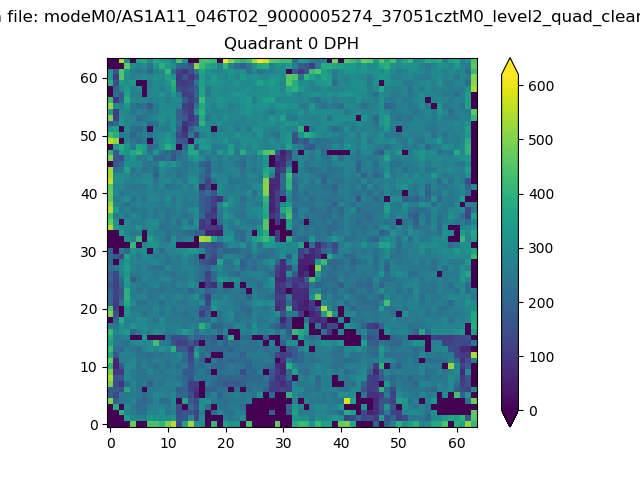 |
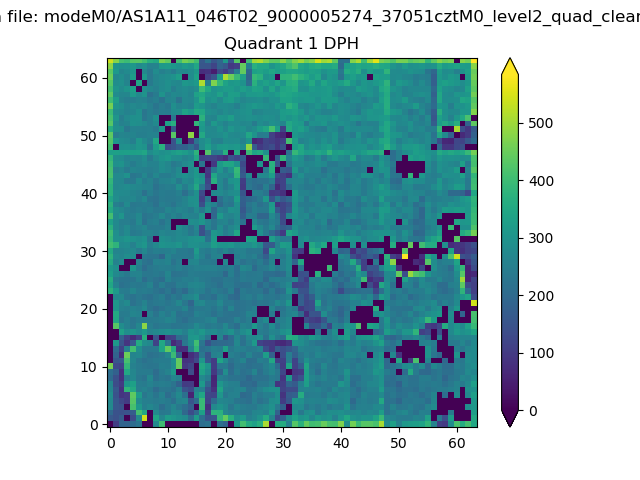 |
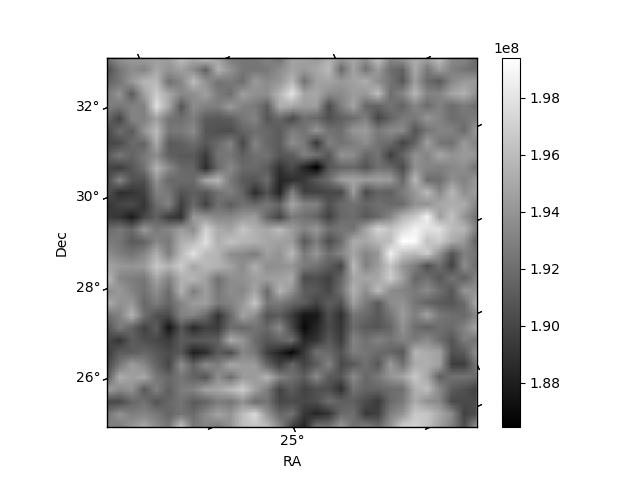
Quadrant B |
|---|---|---|---|
| Quadrant D | 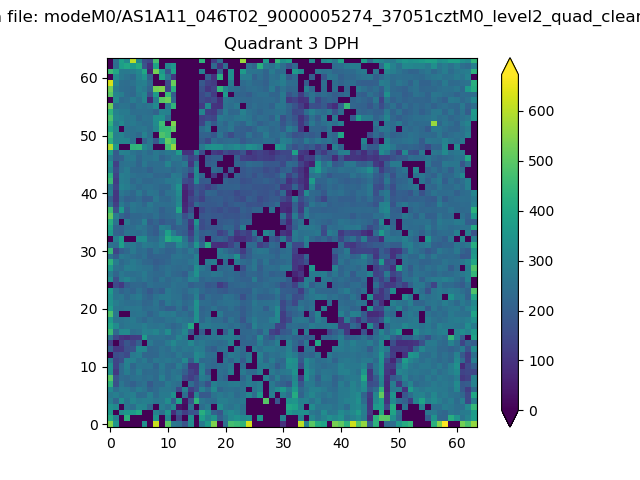 |
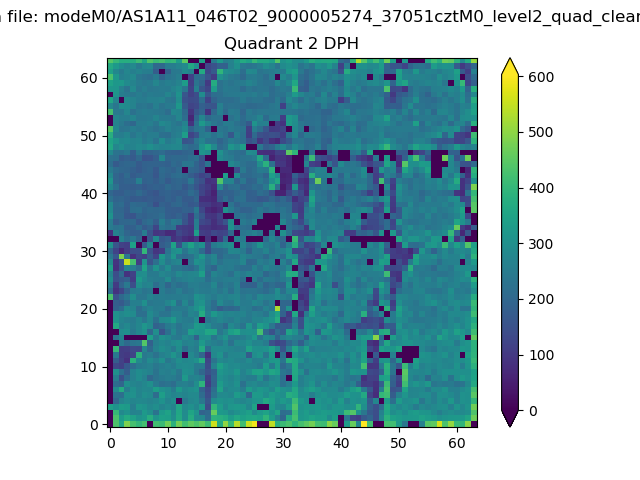 |
Quadrant C |
| Plot type | Count rate plots | Images |
|---|---|---|
| Comparison with Poisson distribution Blue bars denote a histogram of data divided into 1 sec bins. Red curve is a Poisson curve with rate = median count rate of data. |
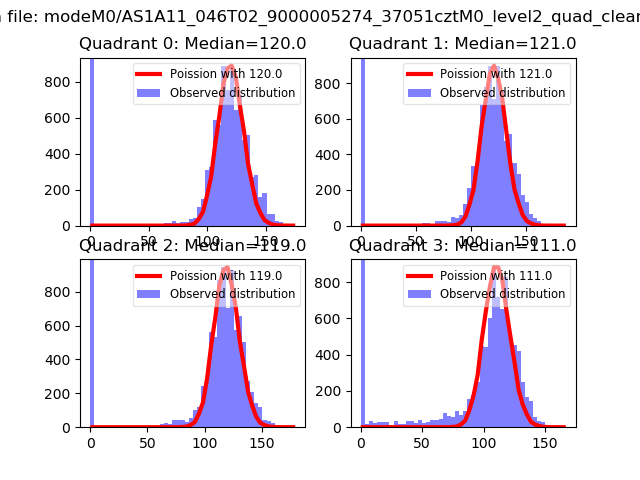 |
 |
| Quadrant-wise count rates Data is divided into 100 sec bins |
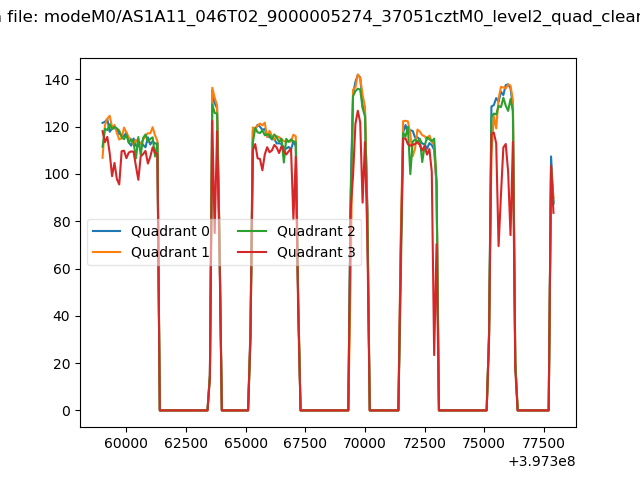 |
|
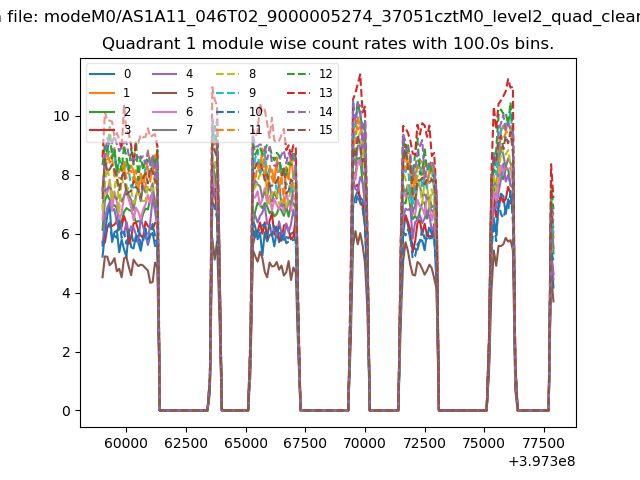
| Module-wise count rates for Quadrant A Data is divided into 100 sec bins |
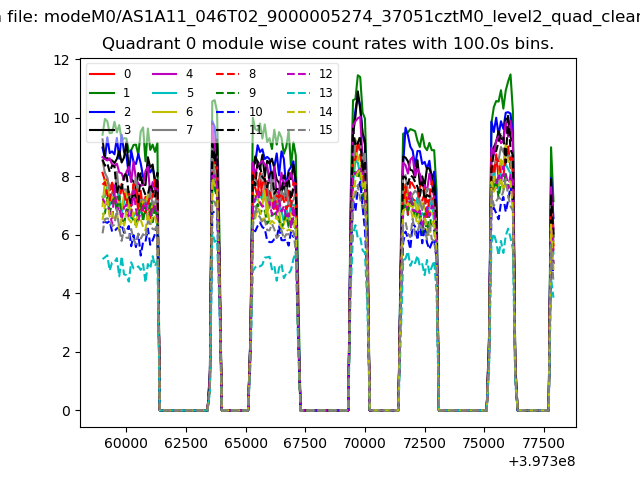 |
 |
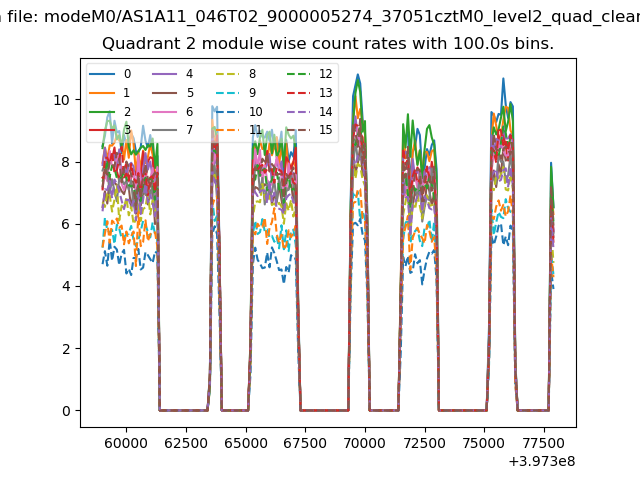
| Module-wise count rates for Quadrant B Data is divided into 100 sec bins |
 |
 |
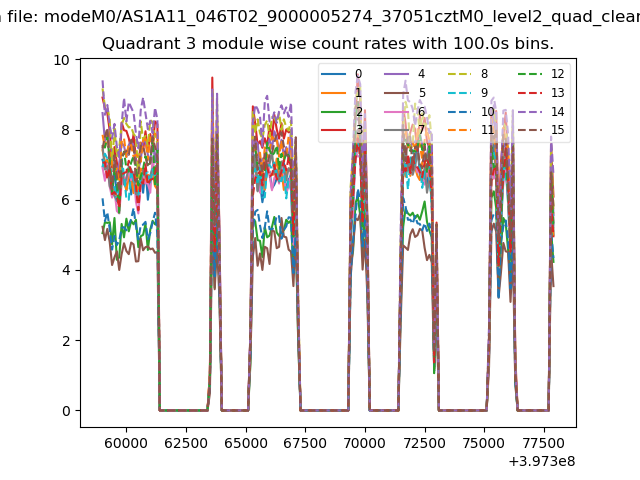
| Module-wise count rates for Quadrant C Data is divided into 100 sec bins |
 |
 |
| Module-wise count rates for Quadrant D Data is divided into 100 sec bins |
 |
 |
| Parameter | Plot |
|---|---|
| CZT HV Monitor | 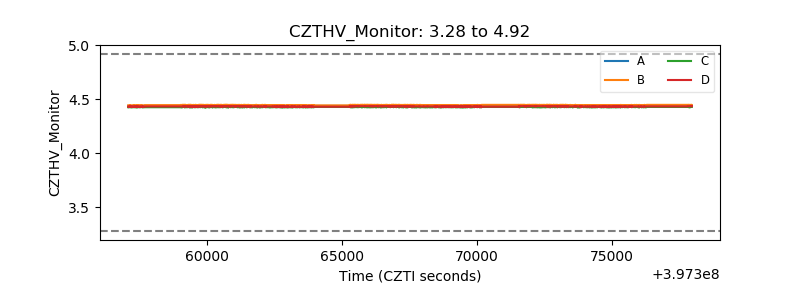 |
| D_VDD | 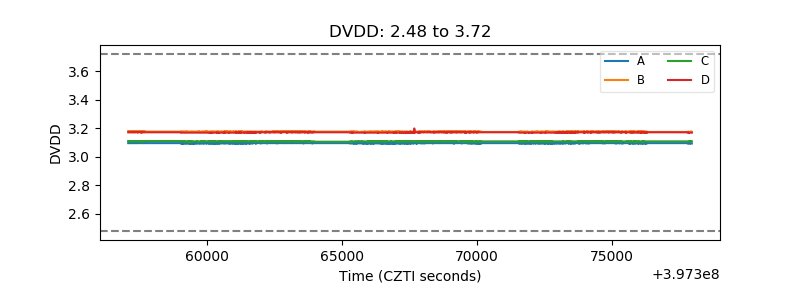 |
| Temperature 1 | 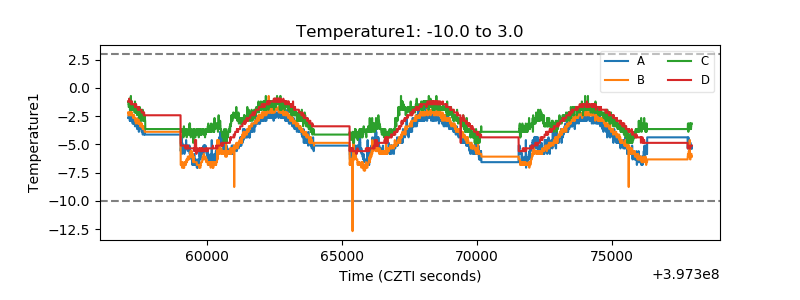 |
| Veto HV Monitor | 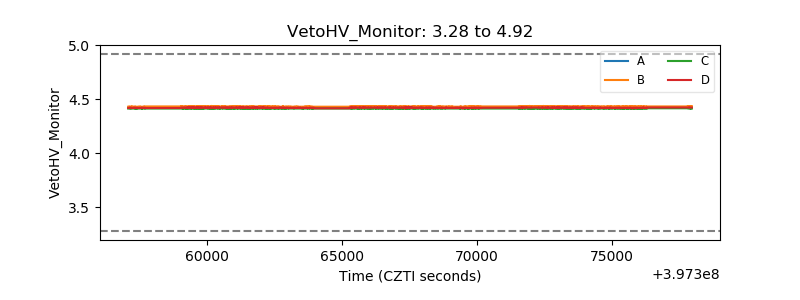 |
| Veto LLD | 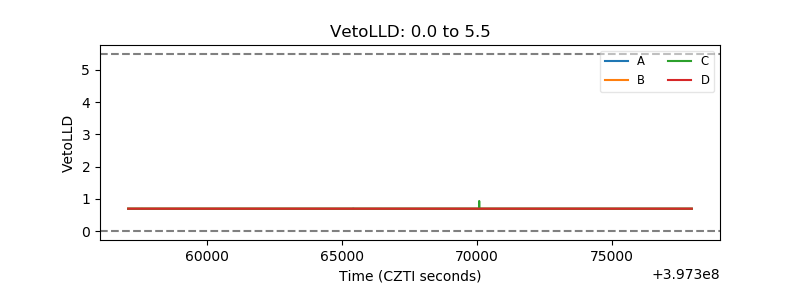 |
| Alpha Counter | 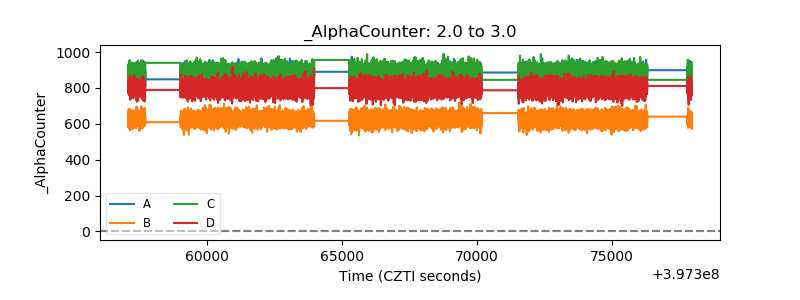 |
| _CPM_Rate | 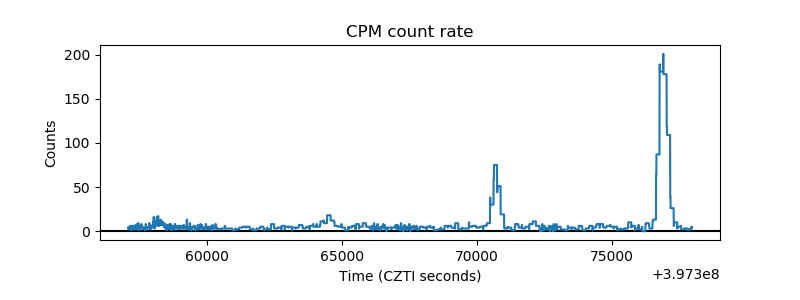 |
| CZT Counter | 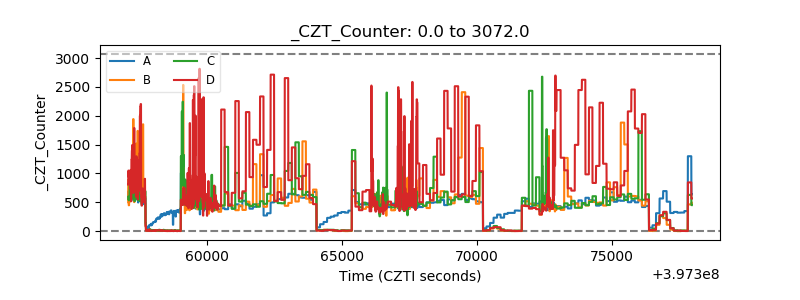 |
| +2.5 Volts monitor | 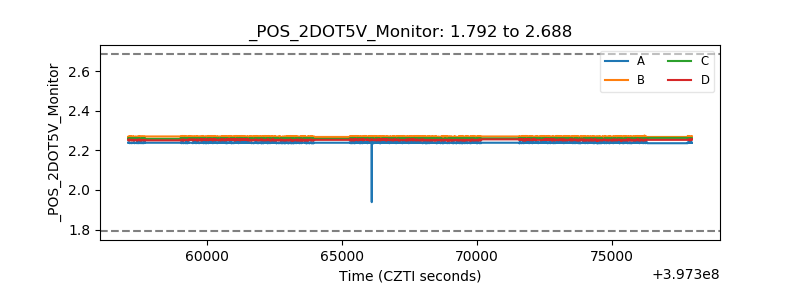 |
| +5 Volts monitor | 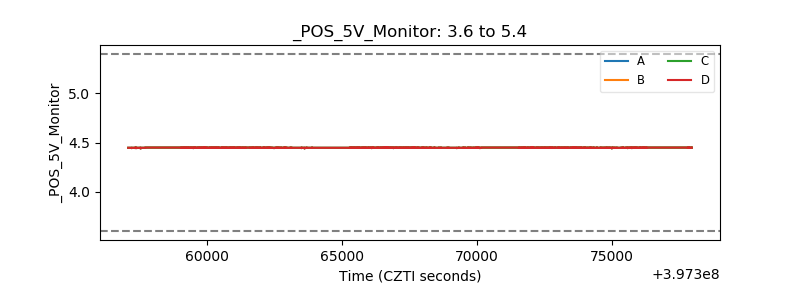 |
| _ROLL_ROT | 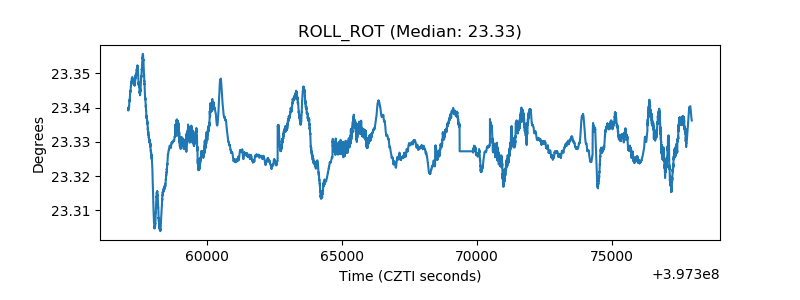 |
| _Roll_DEC | 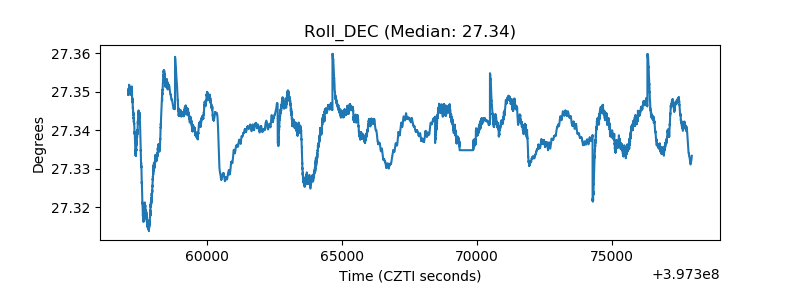 |
| _Roll_RA | 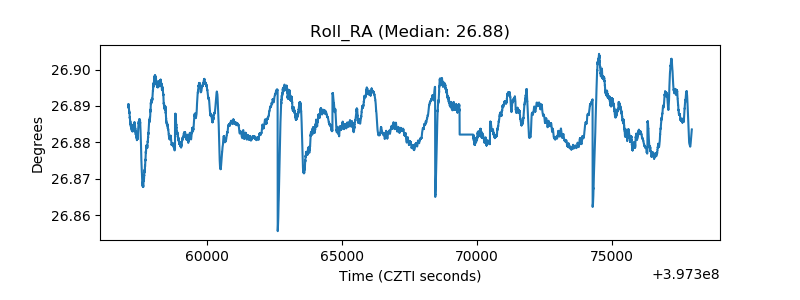 |
| Veto Counter | 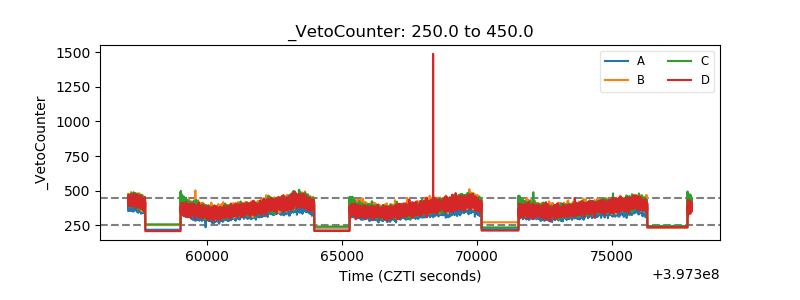 |