| Param | Original file | Final file |
|---|---|---|
| Filename | modeM0/AS1A11_046T02_9000005274_37052cztM0_level2.evt | modeM0/AS1A11_046T02_9000005274_37052cztM0_level2_quad_clean.evt |
| Size (bytes) | 743,002,560 | 62,130,240 |
| Size | 708.6 MB | 59.3 MB |
| Events in quadrant A | 2,961,465 | 394,186 |
| Events in quadrant B | 3,229,531 | 397,934 |
| Events in quadrant C | 7,488,483 | 372,754 |
| Events in quadrant D | 8,436,778 | 316,488 |
| Mode M9 | |||
|---|---|---|---|
| Quadrant | BADHDUFLAG | Total packets | Discarded packets |
| A | 0 | 17 | 0 |
| B | 0 | 17 | 0 |
| C | 0 | 17 | 0 |
| D | 0 | 18 | 0 |
| Mode SS | |||
|---|---|---|---|
| Quadrant | BADHDUFLAG | Total packets | Discarded packets |
| A | 0 | 118 | 0 |
| B | 0 | 118 | 0 |
| C | 0 | 118 | 0 |
| D | 0 | 118 | 0 |
| Mode M0 | |||
|---|---|---|---|
| Quadrant | BADHDUFLAG | Total packets | Discarded packets |
| A | 0 | 12134 | 4 |
| B | 0 | 13319 | 10 |
| C | 0 | 26020 | 11 |
| D | 0 | 28956 | 10 |
| Quadrant | Total seconds | Saturated seconds | Saturation percentage |
|---|---|---|---|
| A | 5702 | 11 | 0.192915% |
| B | 5697 | 145 | 2.545199% |
| C | 5701 | 1768 | 31.012103% |
| D | 5702 | 2390 | 41.915118% |
Noise dominated data is calculated using 1-second bins in cleaned event files. If a bin has >2000 counts, and if more than 50% of those come from <1% of pixels, then it is considered to be noise-dominated and hence unusable.
| Quadrant | # 1 sec bins | Bins with >0 counts | Bins with >2000 counts | High rate bins dominated by noise | Noise dominated (total time) | Noise dominated (detector-on time) | Marked lightcurve |
|---|---|---|---|---|---|---|---|
| A | 7316 | 5704 | 2 | 2 | 0.03% | 0.04% | 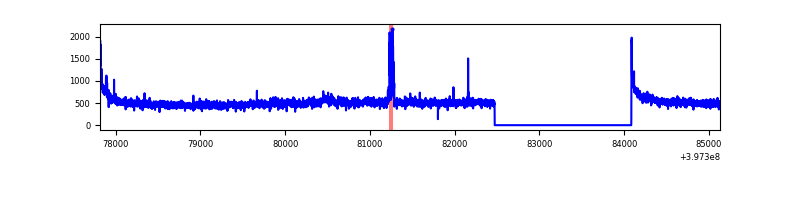 |
| B | 7316 | 5702 | 82 | 82 | 1.12% | 1.44% | 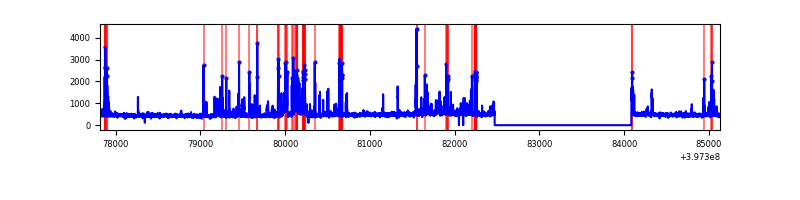 |
| C | 7316 | 5704 | 1659 | 1659 | 22.68% | 29.08% | 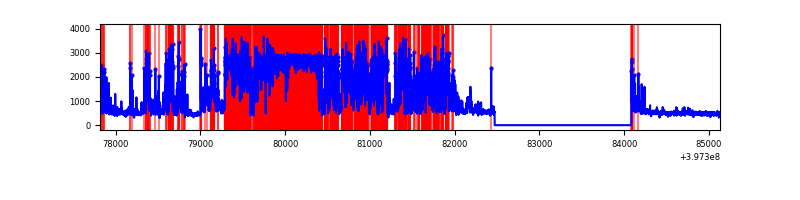 |
| D | 7316 | 5703 | 1918 | 1918 | 26.22% | 33.63% | 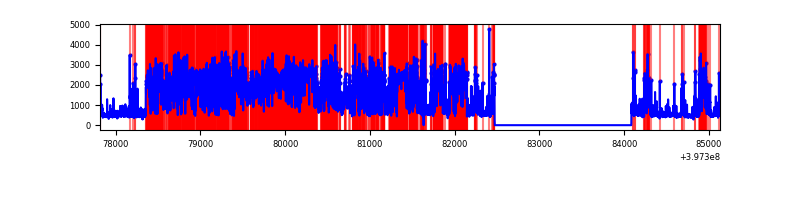 |
Top three noisy pixels from each quadrant. If the there are fewer than three noisy pixels in the level2.evt file, extra rows are filled as -1
| Pixel properties | Quadrant properties | ||||||
|---|---|---|---|---|---|---|---|
| Quadrant | DetID | PixID | Counts | Sigma | Mean | Median | Sigma |
| A | 10 | 83 | 261427 | 1956.6 | 660 | 646 | 133.3 |
| A | 11 | 254 | 82211 | 611.97 | 660 | 646 | 133.3 |
| A | 7 | 3 | 49665 | 367.78 | 660 | 646 | 133.3 |
| B | 5 | 184 | 347755 | 2750.7 | 649 | 633 | 126.2 |
| B | 5 | 172 | 140236 | 1106.26 | 649 | 633 | 126.2 |
| B | 4 | 232 | 51267 | 401.24 | 649 | 633 | 126.2 |
| C | 10 | 20 | 4449156 | 34778.61 | 548 | 551 | 127.9 |
| C | 14 | 254 | 277031 | 2161.48 | 548 | 551 | 127.9 |
| C | 0 | 207 | 226279 | 1764.71 | 548 | 551 | 127.9 |
| D | 12 | 17 | 5168647 | 42604.43 | 487 | 473 | 121.3 |
| D | 1 | 52 | 606080 | 4992.39 | 487 | 473 | 121.3 |
| D | 6 | 112 | 153889 | 1264.7 | 487 | 473 | 121.3 |
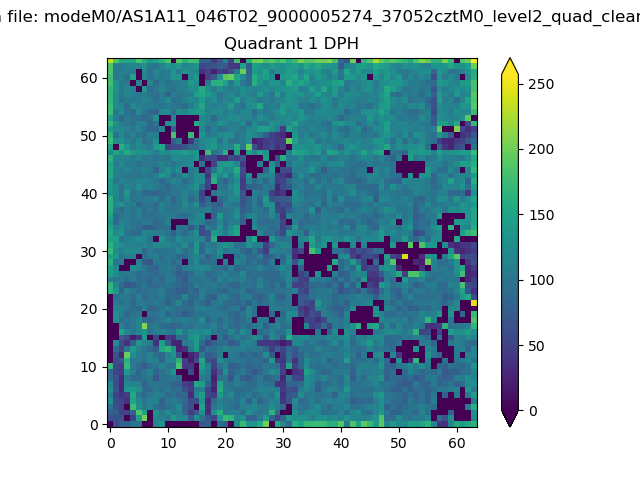
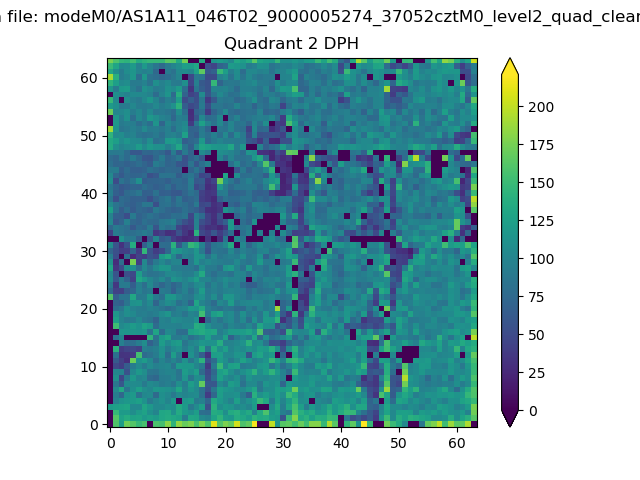
Histogram calculated using DETX and DETY for each event in the final _common_clean file
| Quadrant A |  |
 |
Quadrant B |
|---|---|---|---|
| Quadrant D | 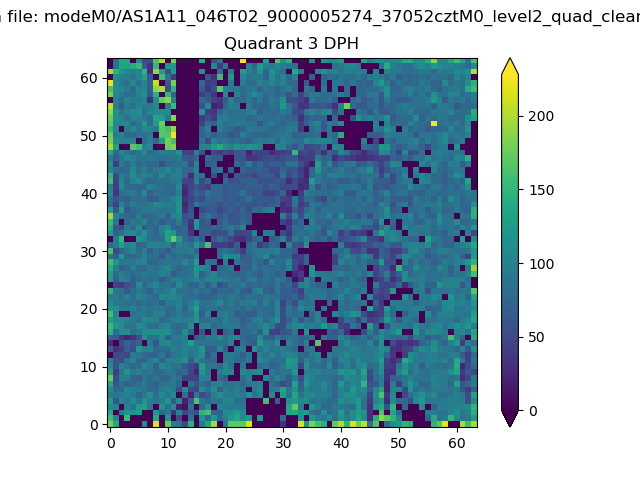 |
 |
Quadrant C |
| Plot type | Count rate plots | Images |
|---|---|---|
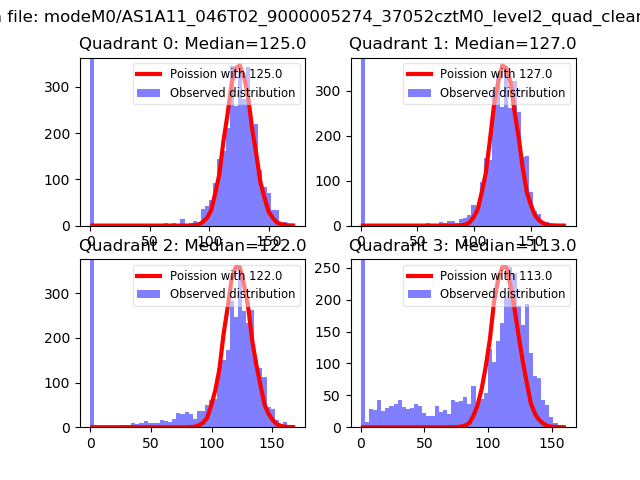
| Comparison with Poisson distribution Blue bars denote a histogram of data divided into 1 sec bins. Red curve is a Poisson curve with rate = median count rate of data. |
 |
 |
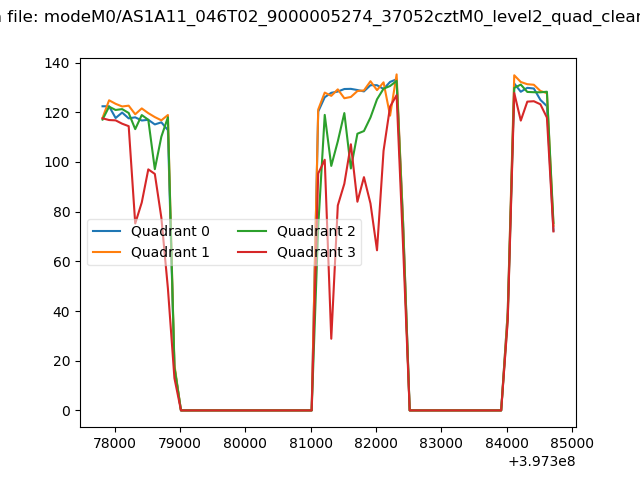
| Quadrant-wise count rates Data is divided into 100 sec bins |
 |
|
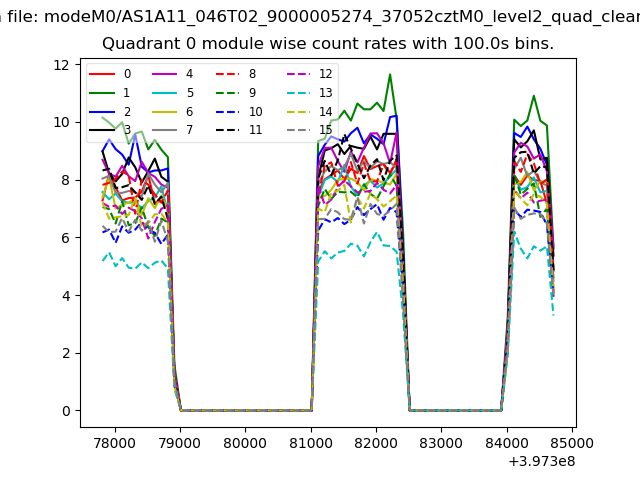
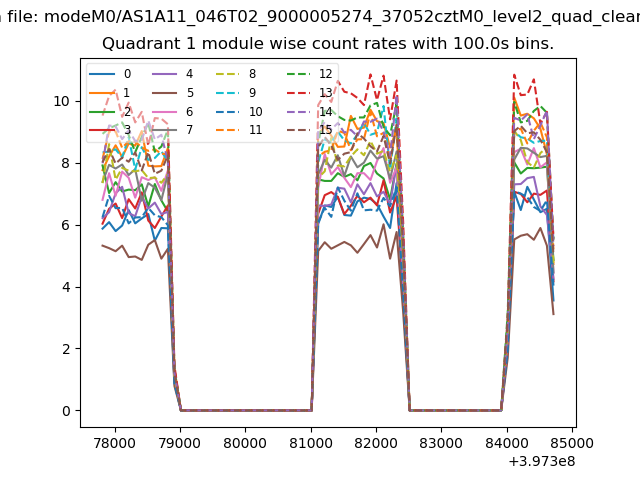
| Module-wise count rates for Quadrant A Data is divided into 100 sec bins |
 |
 |
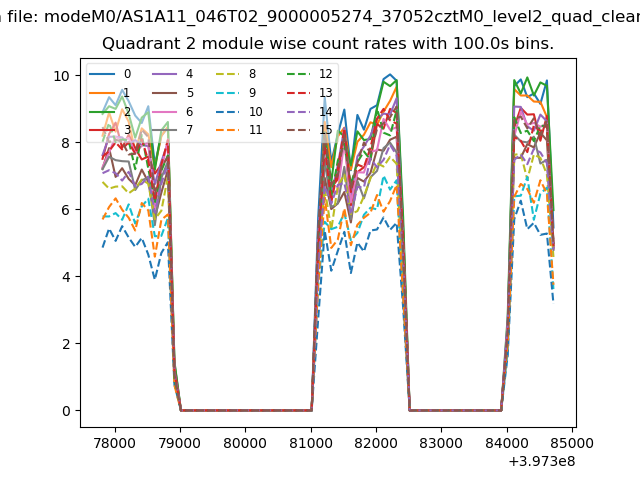
| Module-wise count rates for Quadrant B Data is divided into 100 sec bins |
 |
 |
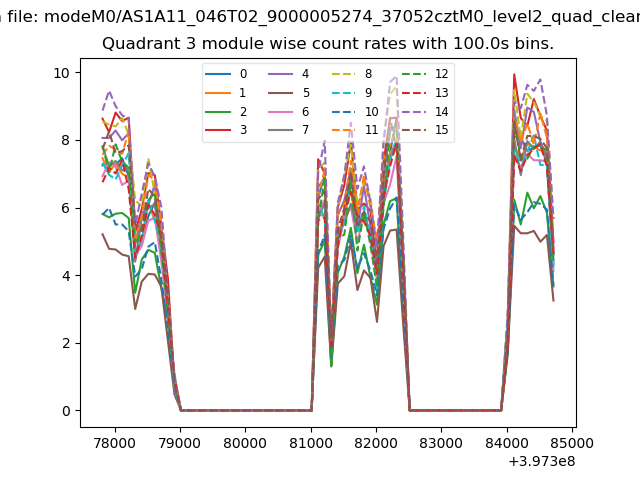
| Module-wise count rates for Quadrant C Data is divided into 100 sec bins |
 |
 |
| Module-wise count rates for Quadrant D Data is divided into 100 sec bins |
 |
 |
| Parameter | Plot |
|---|---|
| CZT HV Monitor | 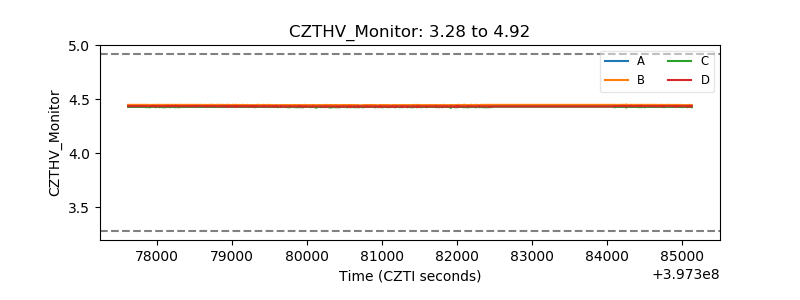 |
| D_VDD | 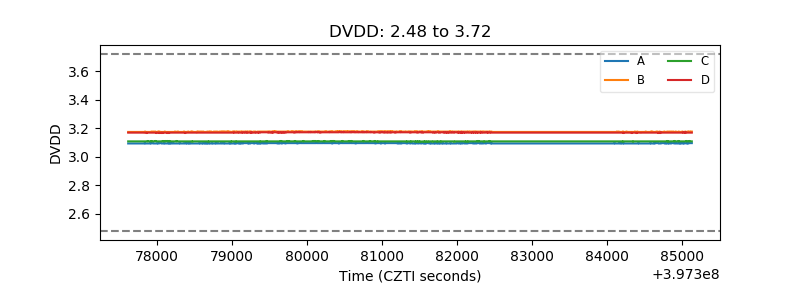 |
| Temperature 1 | 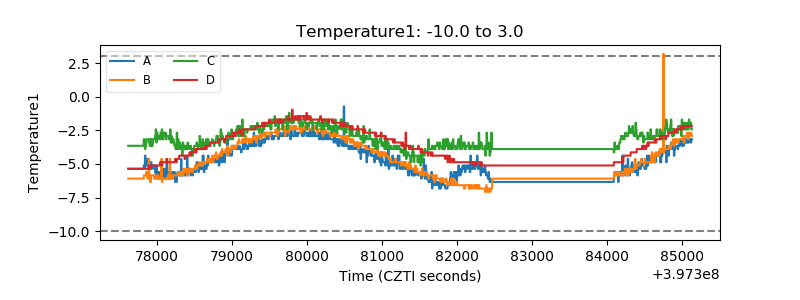 |
| Veto HV Monitor | 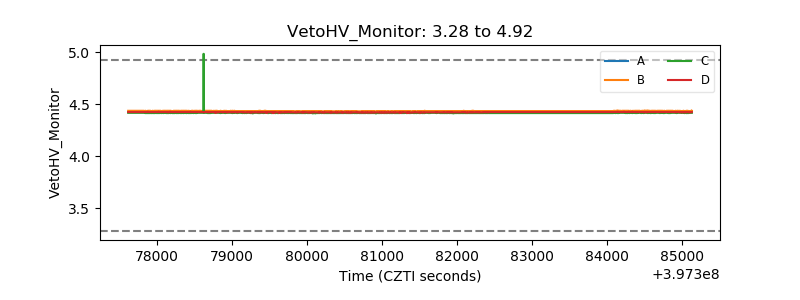 |
| Veto LLD | 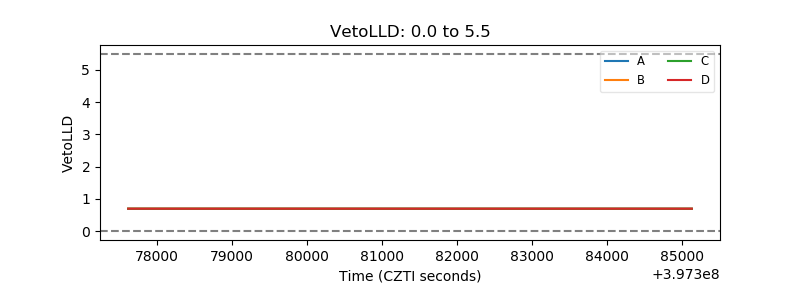 |
| Alpha Counter | 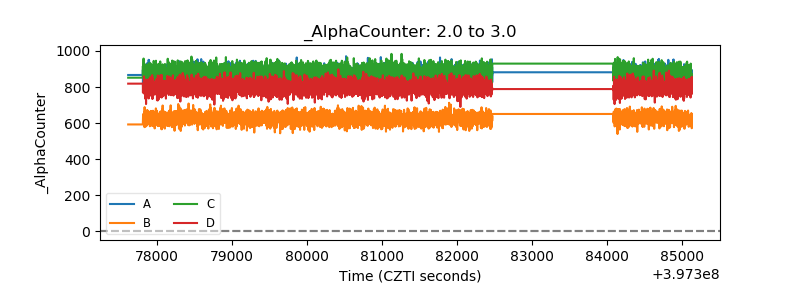 |
| _CPM_Rate | 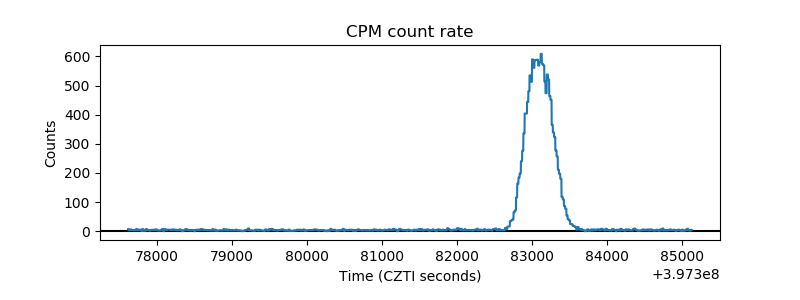 |
| CZT Counter | 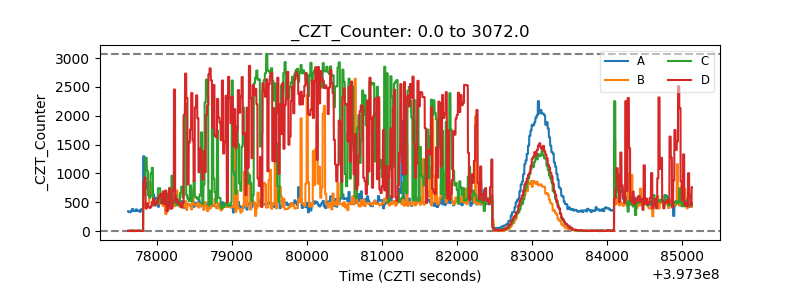 |
| +2.5 Volts monitor | 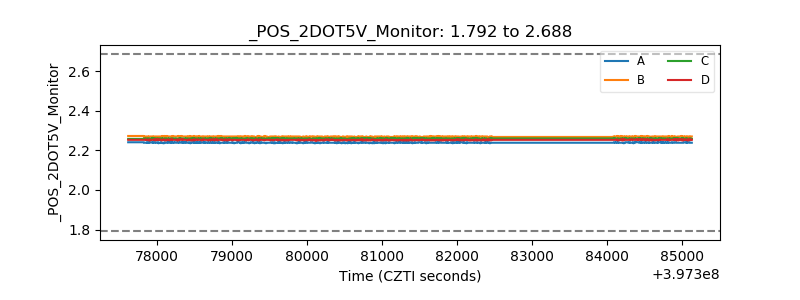 |
| +5 Volts monitor | 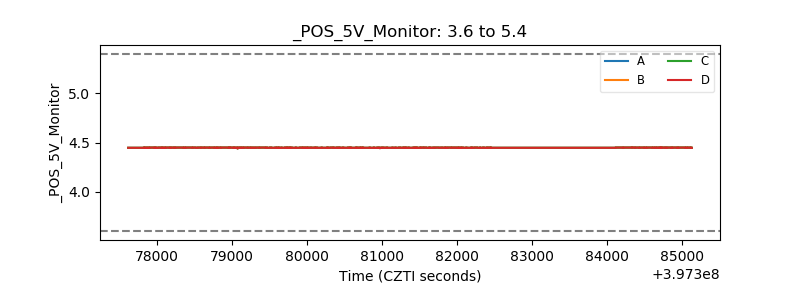 |
| _ROLL_ROT | 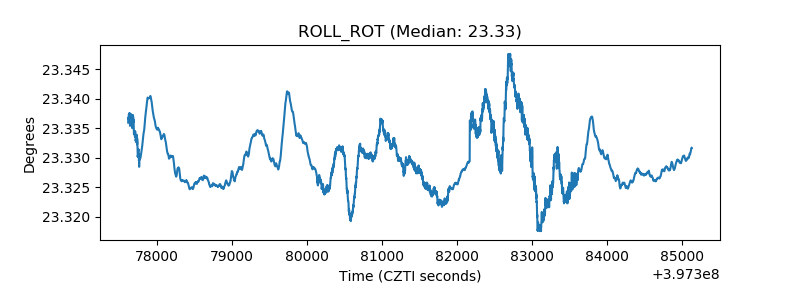 |
| _Roll_DEC | 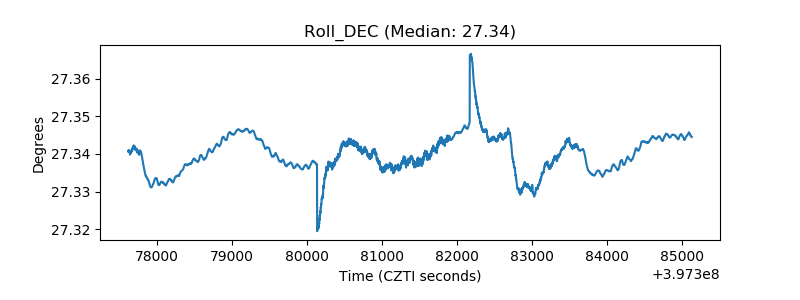 |
| _Roll_RA | 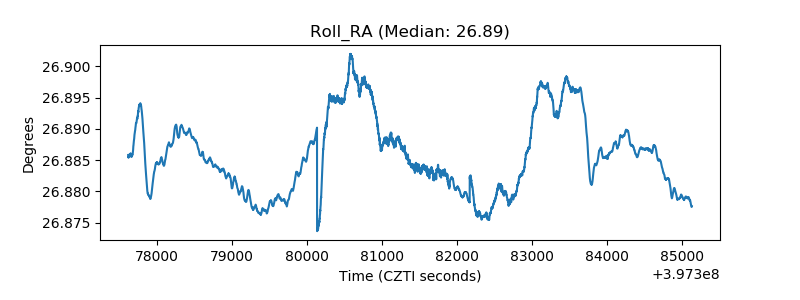 |
| Veto Counter | 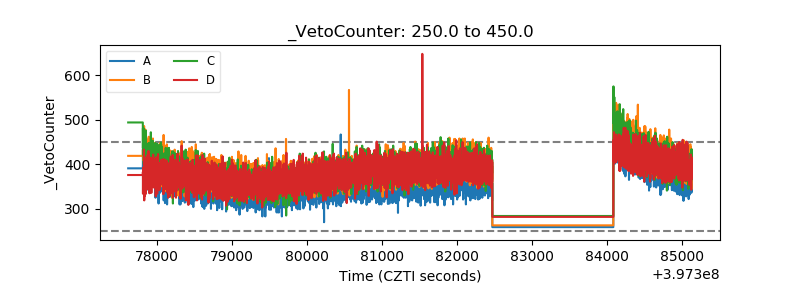 |