| Param | Original file | Final file |
|---|---|---|
| Filename | modeM0/AS1A11_046T02_9000005274_37054cztM0_level2.evt | modeM0/AS1A11_046T02_9000005274_37054cztM0_level2_quad_clean.evt |
| Size (bytes) | 568,664,640 | 55,941,120 |
| Size | 542.3 MB | 53.3 MB |
| Events in quadrant A | 3,010,921 | 341,272 |
| Events in quadrant B | 3,312,164 | 345,101 |
| Events in quadrant C | 3,639,187 | 333,030 |
| Events in quadrant D | 6,879,470 | 280,992 |
| Mode M9 | |||
|---|---|---|---|
| Quadrant | BADHDUFLAG | Total packets | Discarded packets |
| A | 0 | 20 | 0 |
| B | 0 | 20 | 0 |
| C | 0 | 20 | 0 |
| D | 0 | 21 | 0 |
| Mode SS | |||
|---|---|---|---|
| Quadrant | BADHDUFLAG | Total packets | Discarded packets |
| A | 0 | 116 | 0 |
| B | 0 | 116 | 0 |
| C | 0 | 116 | 0 |
| D | 0 | 116 | 0 |
| Mode M0 | |||
|---|---|---|---|
| Quadrant | BADHDUFLAG | Total packets | Discarded packets |
| A | 0 | 12157 | 3 |
| B | 0 | 13355 | 2 |
| C | 0 | 14157 | 2 |
| D | 0 | 24275 | 2 |
| Quadrant | Total seconds | Saturated seconds | Saturation percentage |
|---|---|---|---|
| A | 5609 | 11 | 0.196113% |
| B | 5609 | 106 | 1.889820% |
| C | 5609 | 127 | 2.264218% |
| D | 5609 | 1365 | 24.335889% |
Noise dominated data is calculated using 1-second bins in cleaned event files. If a bin has >2000 counts, and if more than 50% of those come from <1% of pixels, then it is considered to be noise-dominated and hence unusable.
| Quadrant | # 1 sec bins | Bins with >0 counts | Bins with >2000 counts | High rate bins dominated by noise | Noise dominated (total time) | Noise dominated (detector-on time) | Marked lightcurve |
|---|---|---|---|---|---|---|---|
| A | 7342 | 5610 | 6 | 6 | 0.08% | 0.11% | 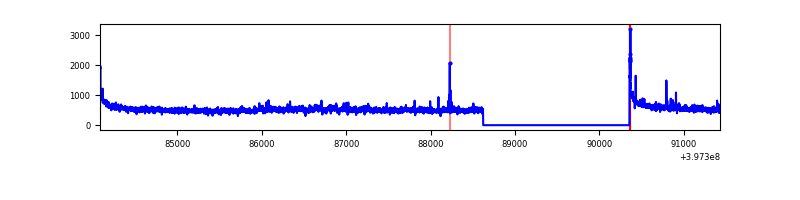 |
| B | 7342 | 5610 | 74 | 74 | 1.01% | 1.32% | 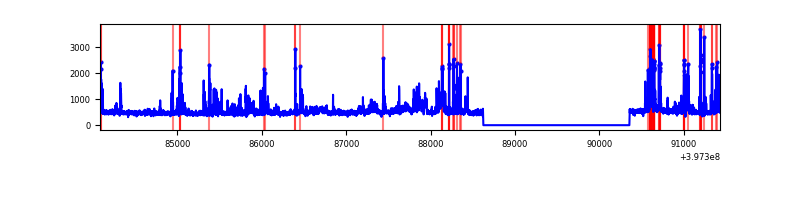 |
| C | 7342 | 5610 | 115 | 115 | 1.57% | 2.05% | 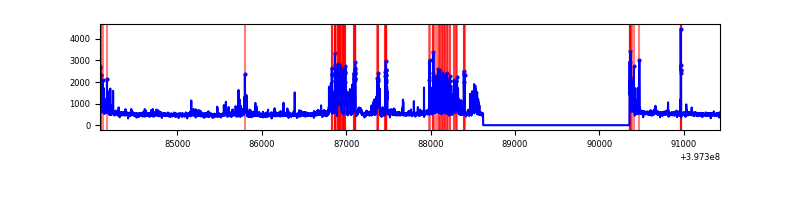 |
| D | 7342 | 5610 | 1211 | 1211 | 16.49% | 21.59% | 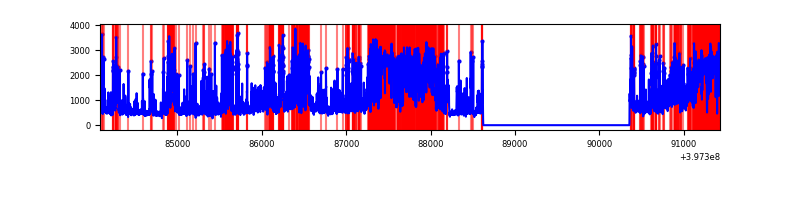 |
Top three noisy pixels from each quadrant. If the there are fewer than three noisy pixels in the level2.evt file, extra rows are filled as -1
| Pixel properties | Quadrant properties | ||||||
|---|---|---|---|---|---|---|---|
| Quadrant | DetID | PixID | Counts | Sigma | Mean | Median | Sigma |
| A | 10 | 83 | 262916 | 1956.82 | 671 | 657 | 134.0 |
| A | 11 | 254 | 97245 | 720.68 | 671 | 657 | 134.0 |
| A | 9 | 143 | 37584 | 275.53 | 671 | 657 | 134.0 |
| B | 5 | 184 | 270069 | 2104.48 | 659 | 640 | 128.0 |
| B | 5 | 172 | 257925 | 2009.63 | 659 | 640 | 128.0 |
| B | 0 | 229 | 47171 | 363.45 | 659 | 640 | 128.0 |
| C | 10 | 20 | 418579 | 2812.36 | 639 | 643 | 148.6 |
| C | 14 | 254 | 306920 | 2060.98 | 639 | 643 | 148.6 |
| C | 15 | 214 | 239261 | 1605.7 | 639 | 643 | 148.6 |
| D | 12 | 17 | 2990126 | 20895.84 | 583 | 566 | 143.1 |
| D | 1 | 52 | 513956 | 3588.39 | 583 | 566 | 143.1 |
| D | 6 | 112 | 448628 | 3131.78 | 583 | 566 | 143.1 |
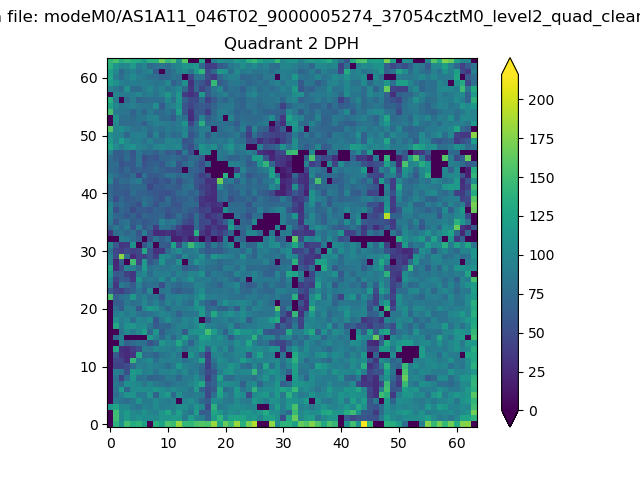
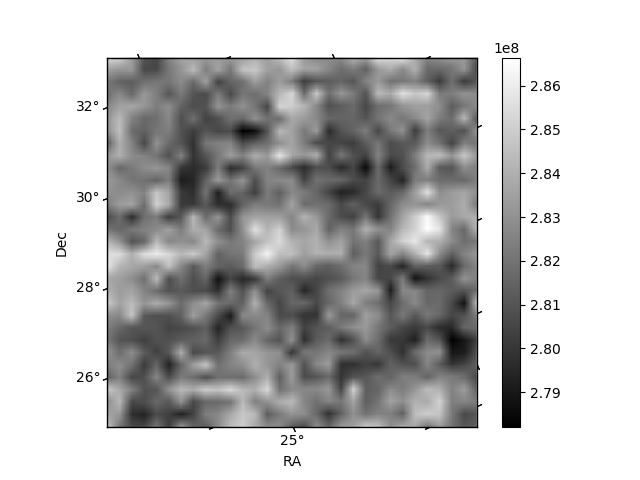
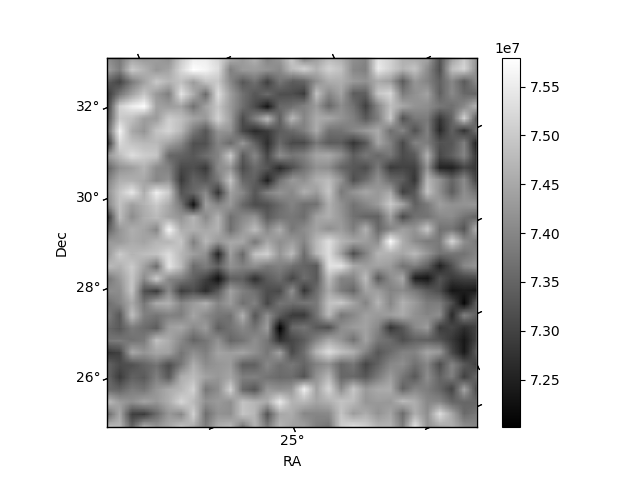
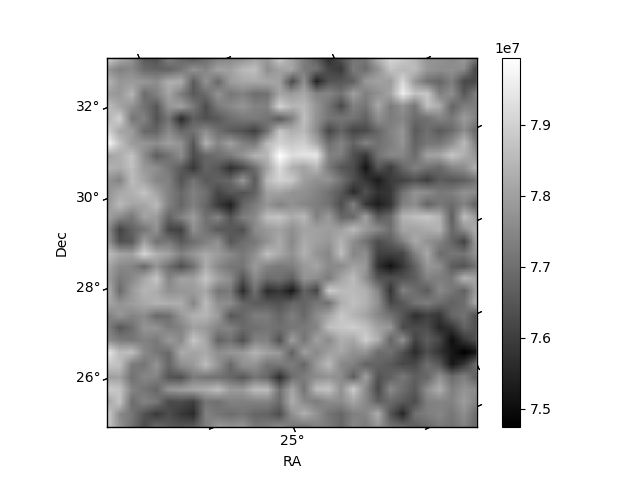
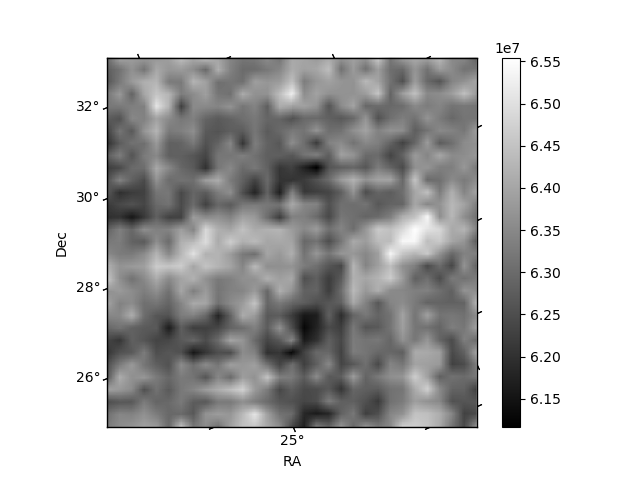
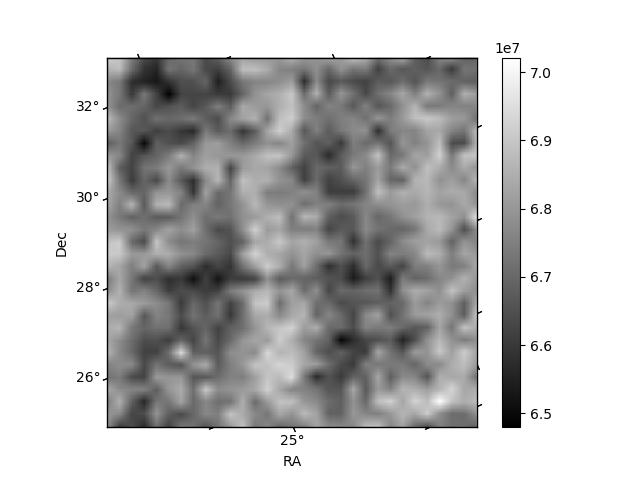
Histogram calculated using DETX and DETY for each event in the final _common_clean file
| Quadrant A | 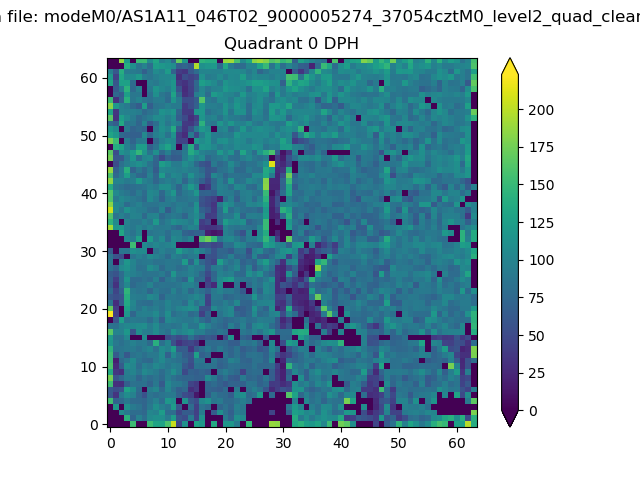 |
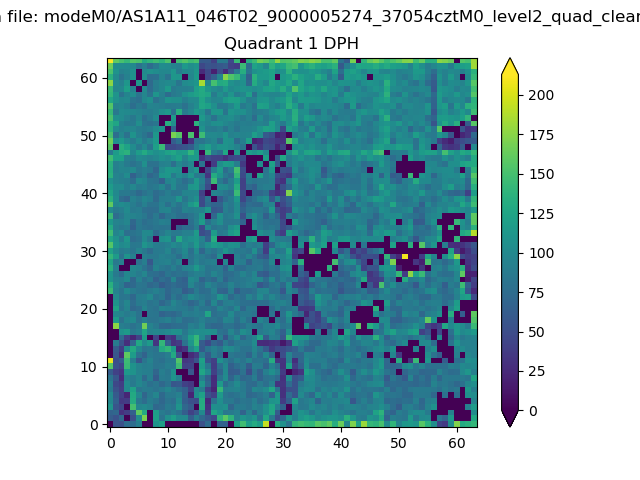 |
Quadrant B |
|---|---|---|---|
| Quadrant D | 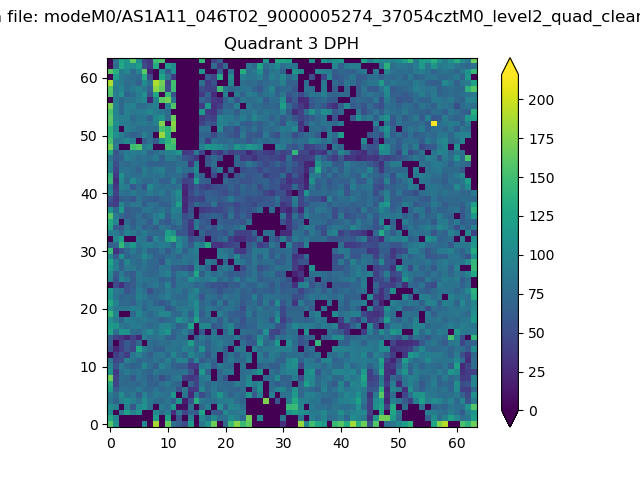 |
 |
Quadrant C |
| Plot type | Count rate plots | Images |
|---|---|---|
| Comparison with Poisson distribution Blue bars denote a histogram of data divided into 1 sec bins. Red curve is a Poisson curve with rate = median count rate of data. |
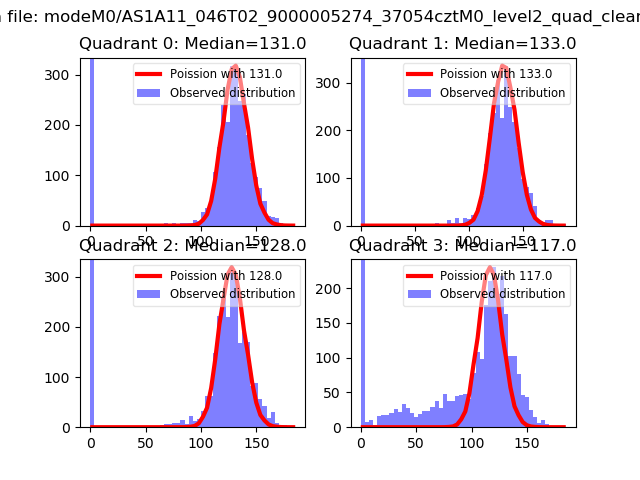 |
 |
| Quadrant-wise count rates Data is divided into 100 sec bins |
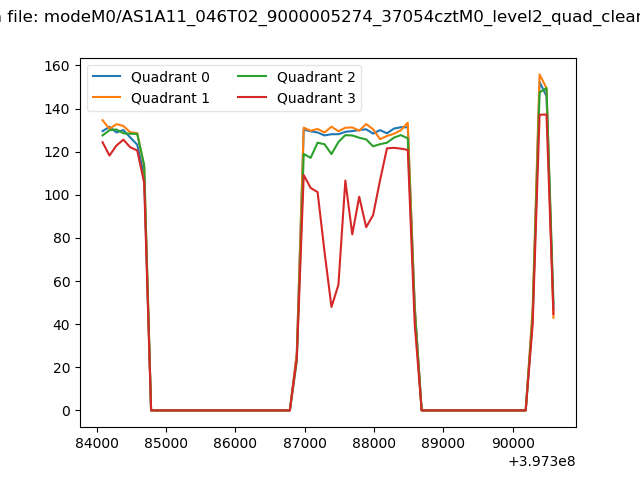 |
|
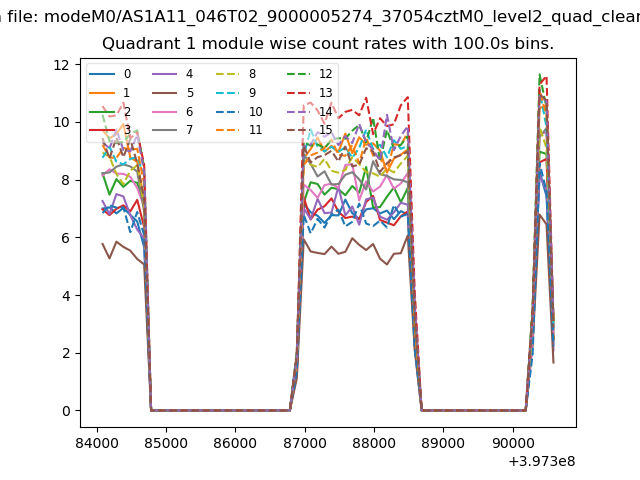
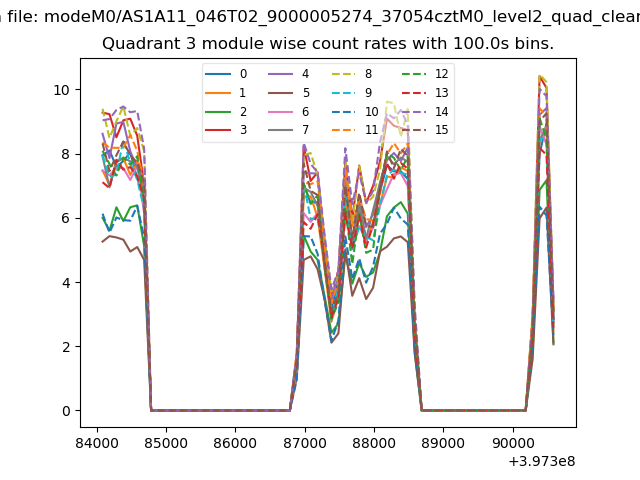
| Module-wise count rates for Quadrant A Data is divided into 100 sec bins |
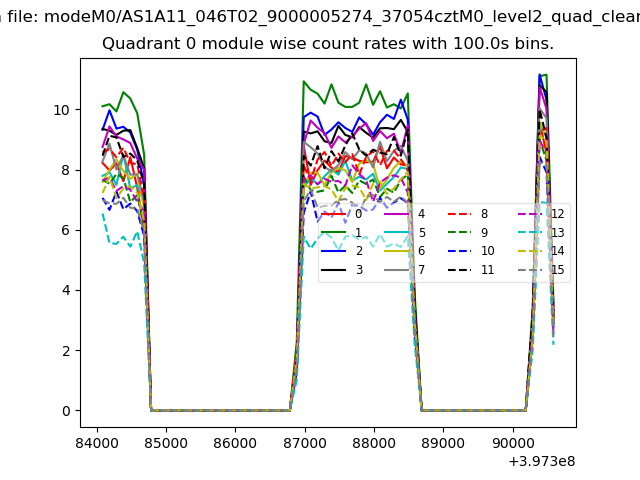 |
 |
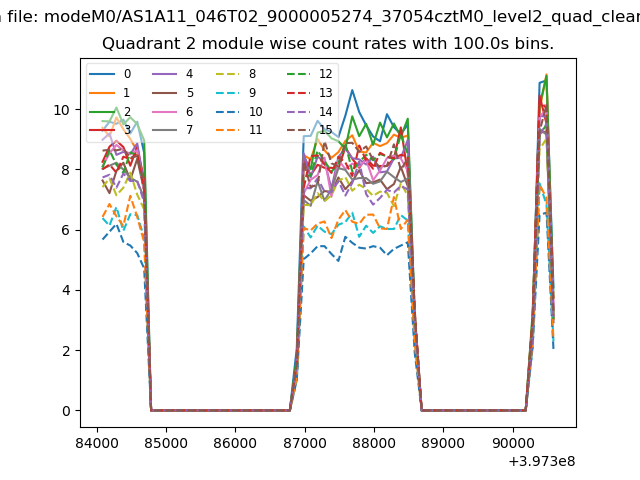
| Module-wise count rates for Quadrant B Data is divided into 100 sec bins |
 |
 |
| Module-wise count rates for Quadrant C Data is divided into 100 sec bins |
 |
 |
| Module-wise count rates for Quadrant D Data is divided into 100 sec bins |
 |
 |
| Parameter | Plot |
|---|---|
| CZT HV Monitor | 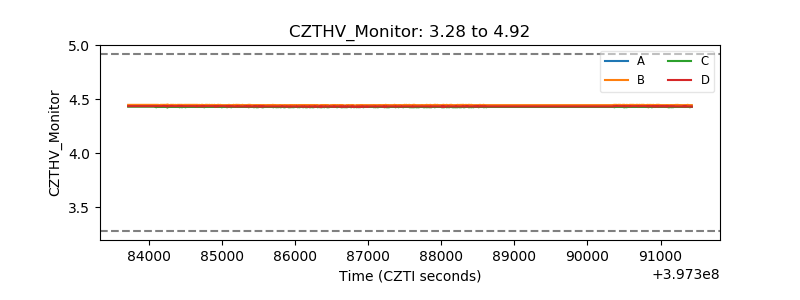 |
| D_VDD | 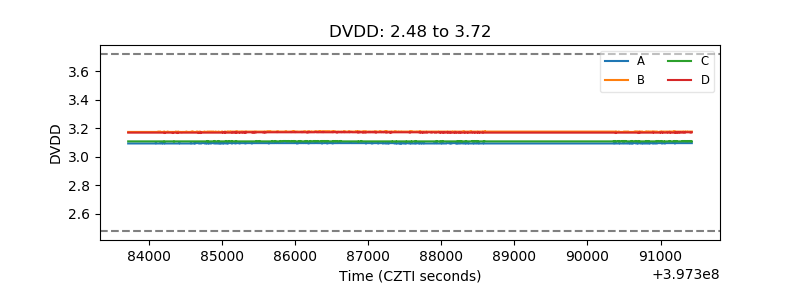 |
| Temperature 1 | 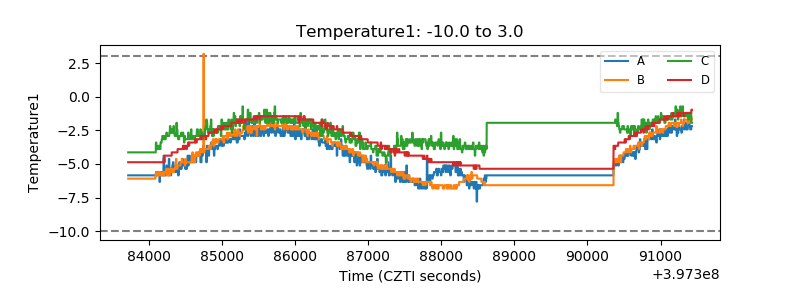 |
| Veto HV Monitor | 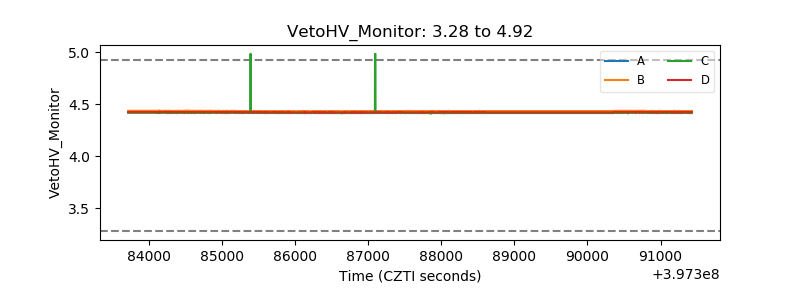 |
| Veto LLD | 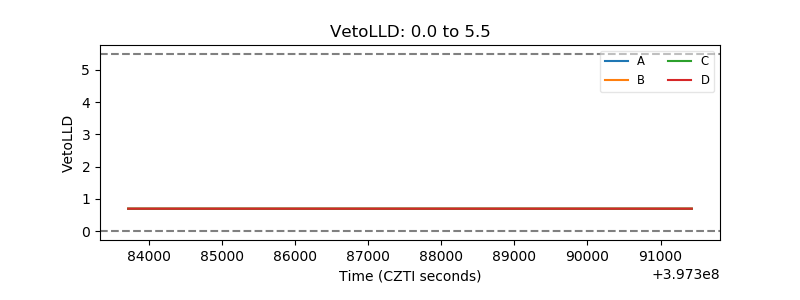 |
| Alpha Counter | 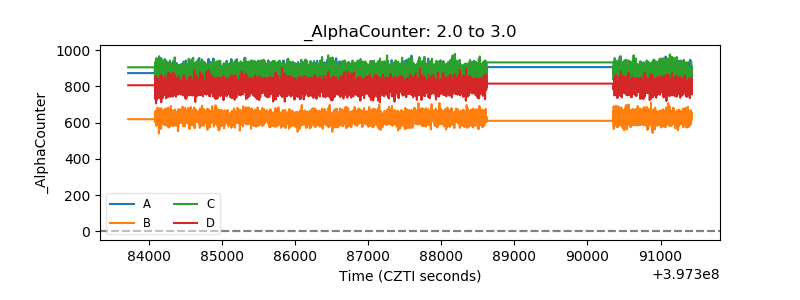 |
| _CPM_Rate | 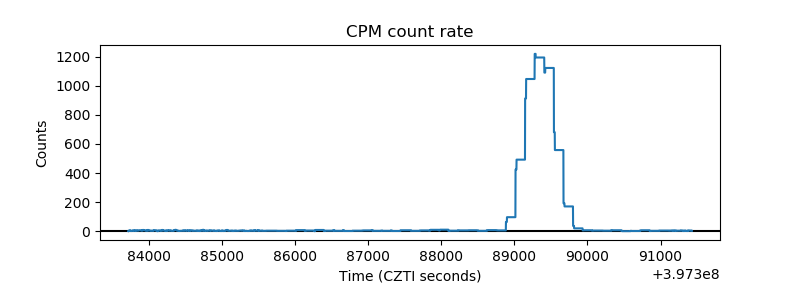 |
| CZT Counter | 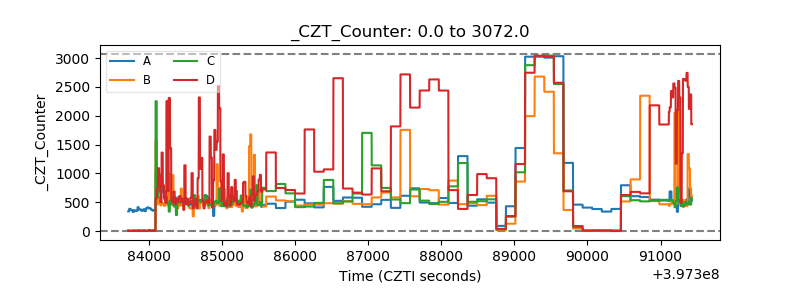 |
| +2.5 Volts monitor | 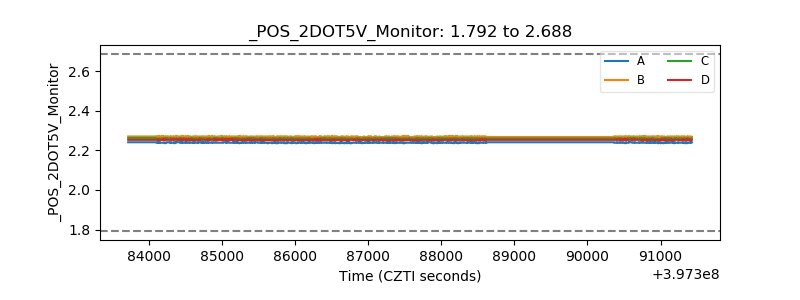 |
| +5 Volts monitor | 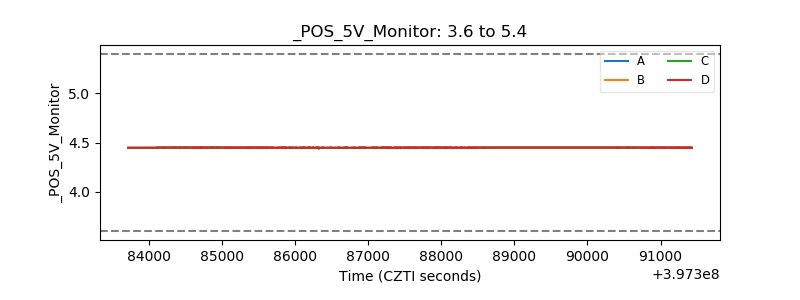 |
| _ROLL_ROT | 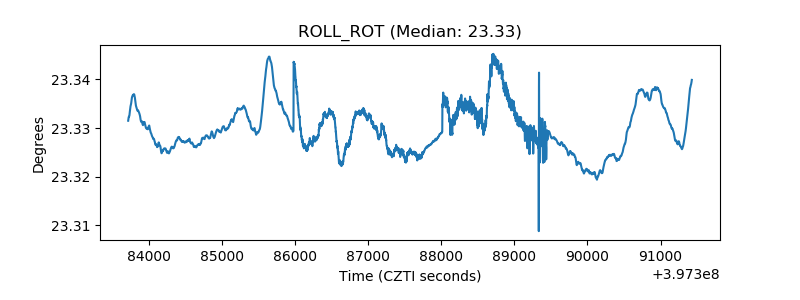 |
| _Roll_DEC | 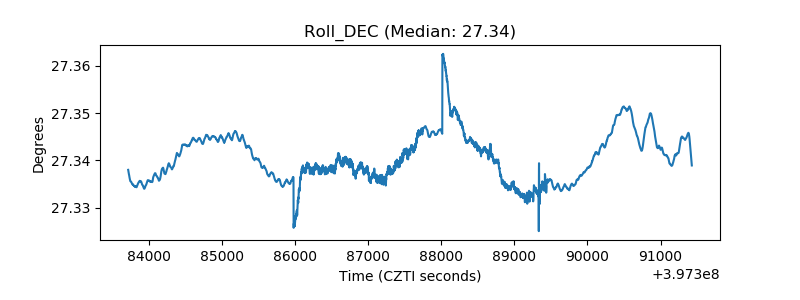 |
| _Roll_RA | 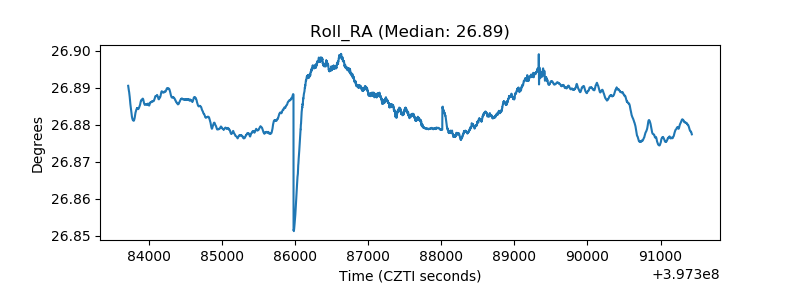 |
| Veto Counter | 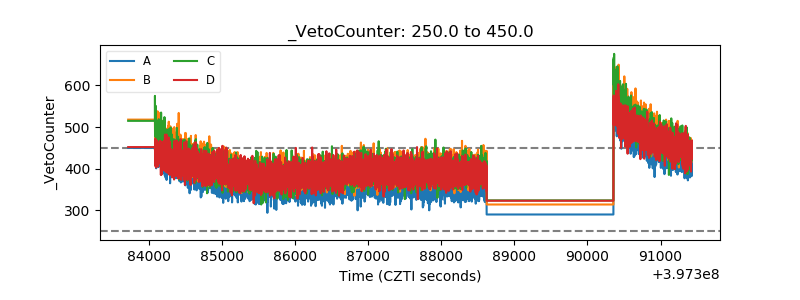 |