| Param | Original file | Final file |
|---|---|---|
| Filename | modeM0/AS1A11_046T02_9000005274_37055cztM0_level2.evt | modeM0/AS1A11_046T02_9000005274_37055cztM0_level2_quad_clean.evt |
| Size (bytes) | 603,685,440 | 49,705,920 |
| Size | 575.7 MB | 47.4 MB |
| Events in quadrant A | 3,056,887 | 299,027 |
| Events in quadrant B | 3,518,211 | 297,895 |
| Events in quadrant C | 3,132,964 | 291,346 |
| Events in quadrant D | 8,208,229 | 236,822 |
| Mode M9 | |||
|---|---|---|---|
| Quadrant | BADHDUFLAG | Total packets | Discarded packets |
| A | 0 | 27 | 0 |
| B | 0 | 27 | 0 |
| C | 0 | 27 | 0 |
| D | 0 | 28 | 0 |
| Mode SS | |||
|---|---|---|---|
| Quadrant | BADHDUFLAG | Total packets | Discarded packets |
| A | 0 | 110 | 0 |
| B | 0 | 110 | 0 |
| C | 0 | 110 | 0 |
| D | 0 | 110 | 0 |
| Mode M0 | |||
|---|---|---|---|
| Quadrant | BADHDUFLAG | Total packets | Discarded packets |
| A | 0 | 12356 | 3 |
| B | 0 | 13751 | 2 |
| C | 0 | 12418 | 2 |
| D | 0 | 28163 | 2 |
| Quadrant | Total seconds | Saturated seconds | Saturation percentage |
|---|---|---|---|
| A | 5417 | 15 | 0.276906% |
| B | 5417 | 190 | 3.507476% |
| C | 5417 | 42 | 0.775337% |
| D | 5417 | 1888 | 34.853240% |
Noise dominated data is calculated using 1-second bins in cleaned event files. If a bin has >2000 counts, and if more than 50% of those come from <1% of pixels, then it is considered to be noise-dominated and hence unusable.
| Quadrant | # 1 sec bins | Bins with >0 counts | Bins with >2000 counts | High rate bins dominated by noise | Noise dominated (total time) | Noise dominated (detector-on time) | Marked lightcurve |
|---|---|---|---|---|---|---|---|
| A | 7300 | 5418 | 7 | 7 | 0.10% | 0.13% | 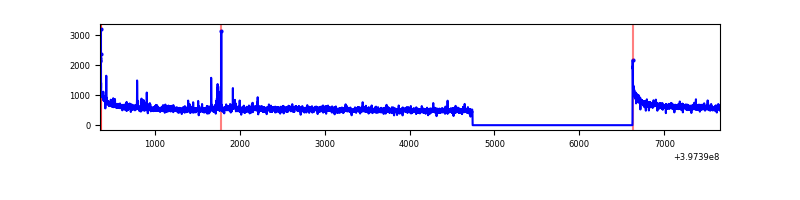 |
| B | 7300 | 5418 | 124 | 124 | 1.70% | 2.29% | 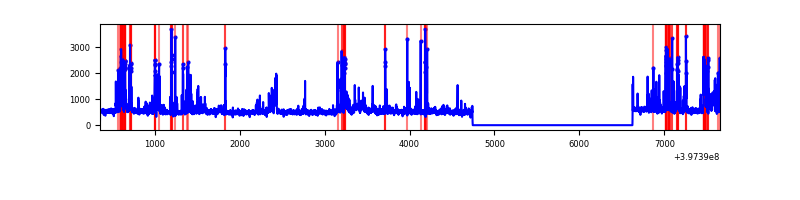 |
| C | 7300 | 5418 | 40 | 40 | 0.55% | 0.74% | 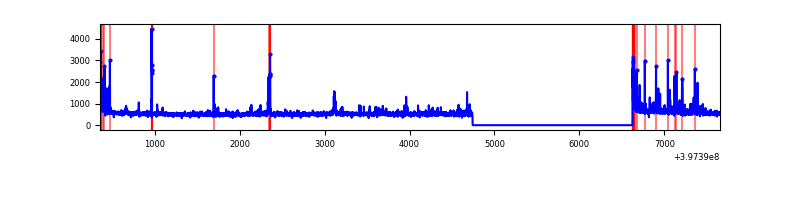 |
| D | 7300 | 5418 | 1666 | 1666 | 22.82% | 30.75% | 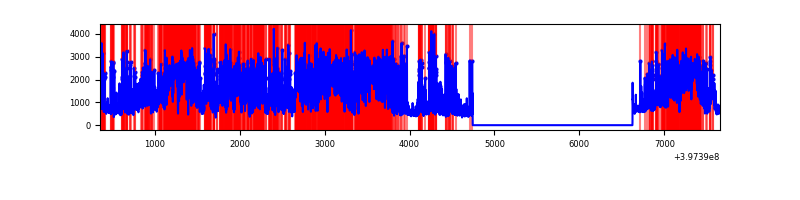 |
Top three noisy pixels from each quadrant. If the there are fewer than three noisy pixels in the level2.evt file, extra rows are filled as -1
| Pixel properties | Quadrant properties | ||||||
|---|---|---|---|---|---|---|---|
| Quadrant | DetID | PixID | Counts | Sigma | Mean | Median | Sigma |
| A | 10 | 83 | 263007 | 1912.1 | 683 | 671 | 137.2 |
| A | 11 | 254 | 95626 | 692.1 | 683 | 671 | 137.2 |
| A | 9 | 143 | 51813 | 372.76 | 683 | 671 | 137.2 |
| B | 5 | 172 | 496428 | 3909.08 | 664 | 647 | 126.8 |
| B | 5 | 184 | 104260 | 816.96 | 664 | 647 | 126.8 |
| B | 0 | 229 | 86434 | 676.4 | 664 | 647 | 126.8 |
| C | 15 | 214 | 232251 | 1557.29 | 650 | 655 | 148.7 |
| C | 0 | 10 | 118395 | 791.7 | 650 | 655 | 148.7 |
| C | 0 | 207 | 113090 | 756.03 | 650 | 655 | 148.7 |
| D | 12 | 17 | 2886570 | 20822.0 | 571 | 556 | 138.6 |
| D | 6 | 112 | 1672275 | 12061.11 | 571 | 556 | 138.6 |
| D | 1 | 52 | 824424 | 5944.04 | 571 | 556 | 138.6 |
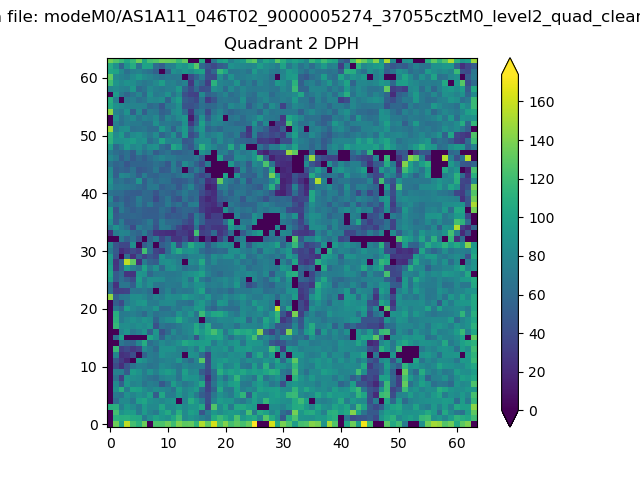
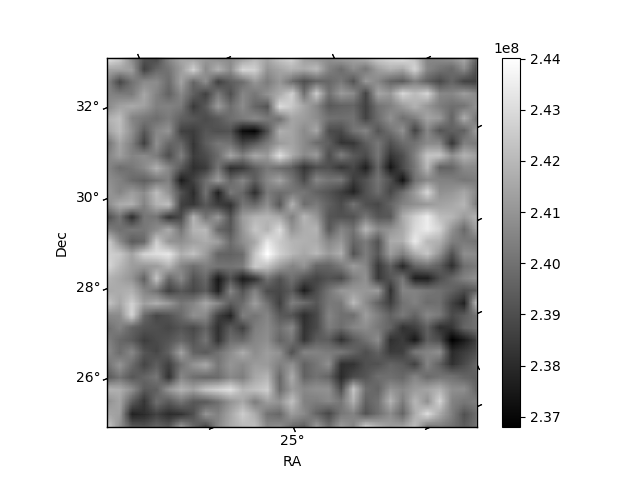
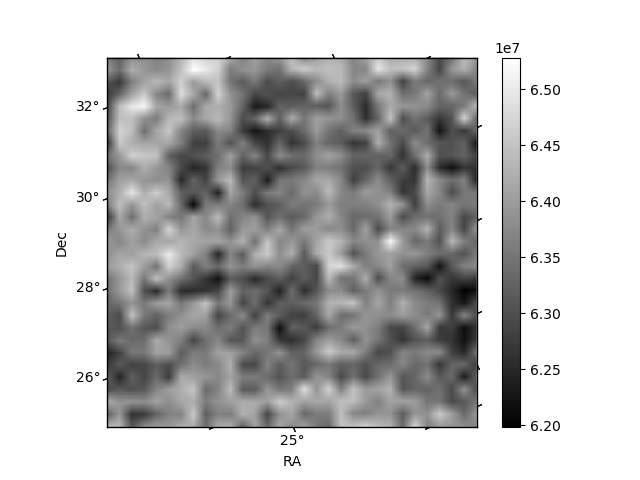
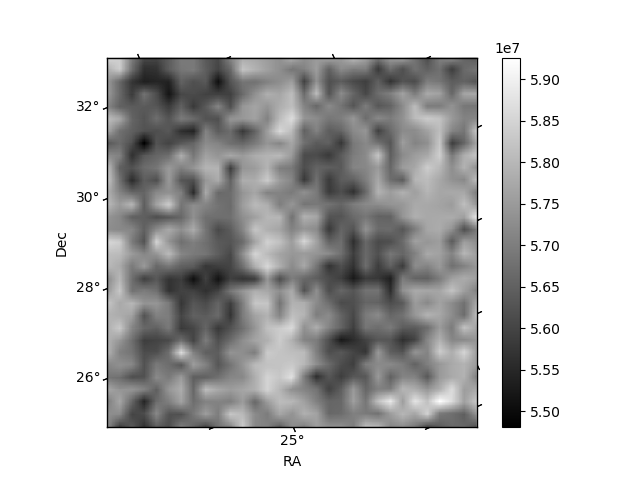
Histogram calculated using DETX and DETY for each event in the final _common_clean file
| Quadrant A | 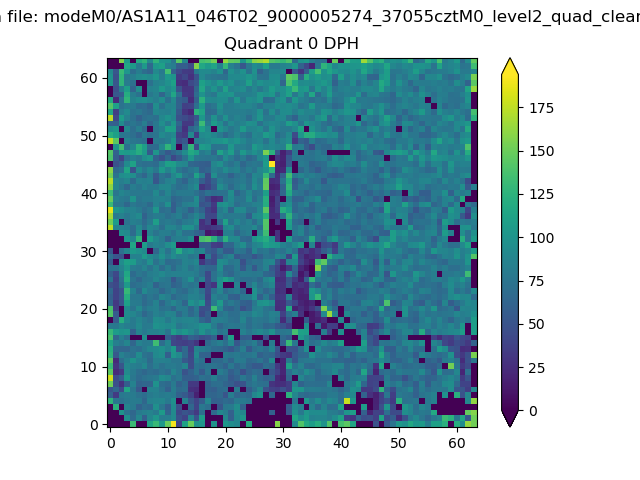 |
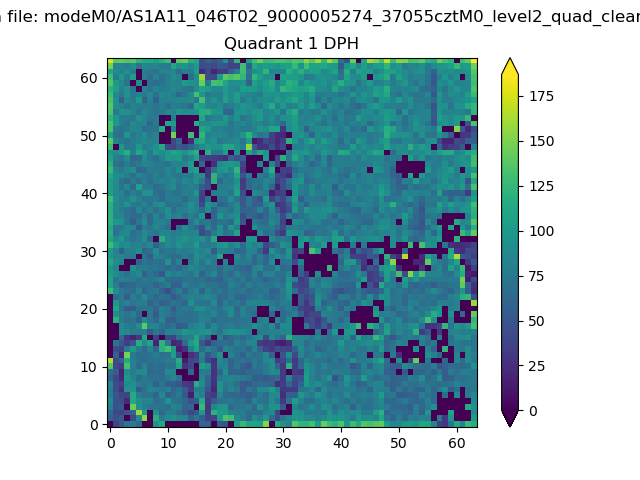 |
Quadrant B |
|---|---|---|---|
| Quadrant D | 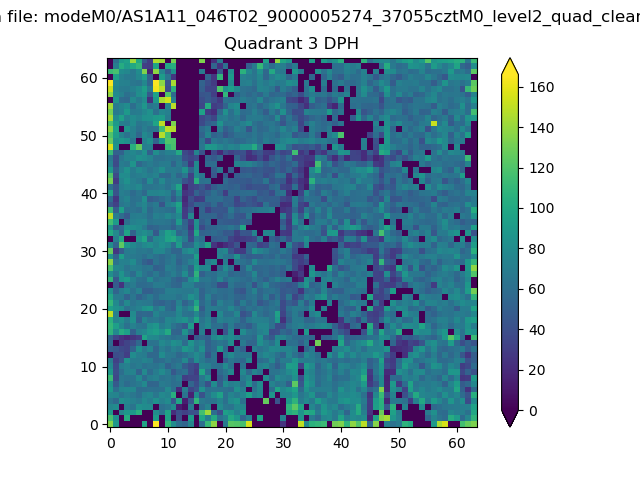 |
 |
Quadrant C |
| Plot type | Count rate plots | Images |
|---|---|---|
| Comparison with Poisson distribution Blue bars denote a histogram of data divided into 1 sec bins. Red curve is a Poisson curve with rate = median count rate of data. |
 |
 |
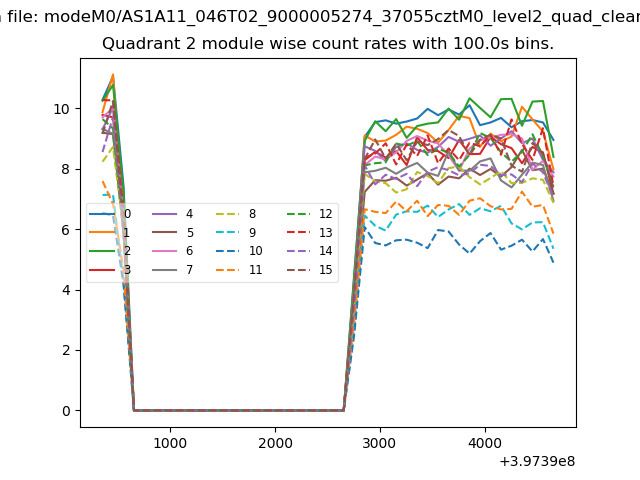
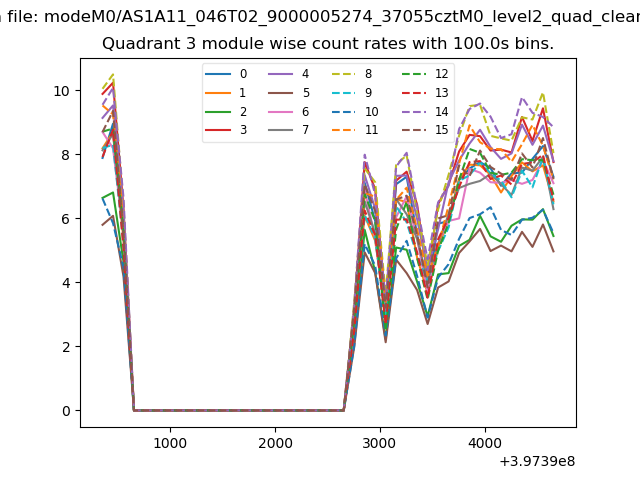
| Quadrant-wise count rates Data is divided into 100 sec bins |
 |
|
| Module-wise count rates for Quadrant A Data is divided into 100 sec bins |
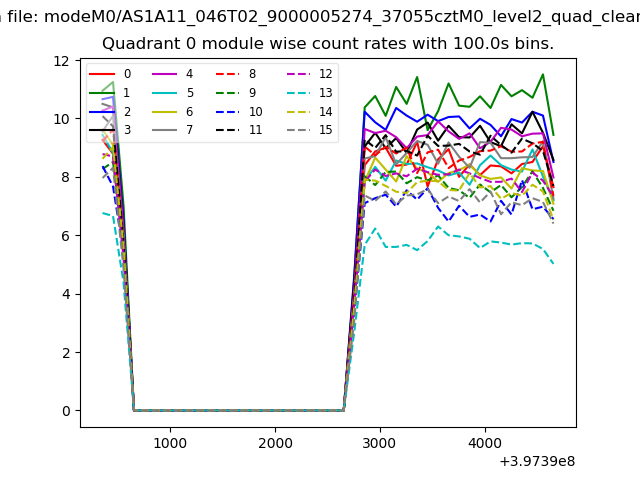 |
 |
| Module-wise count rates for Quadrant B Data is divided into 100 sec bins |
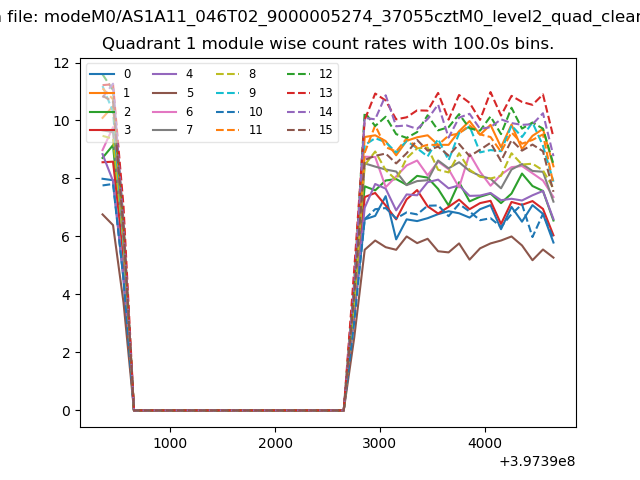 |
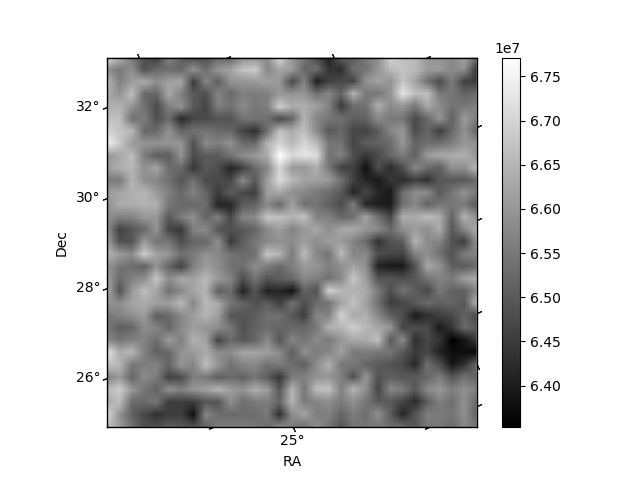 |
| Module-wise count rates for Quadrant C Data is divided into 100 sec bins |
 |
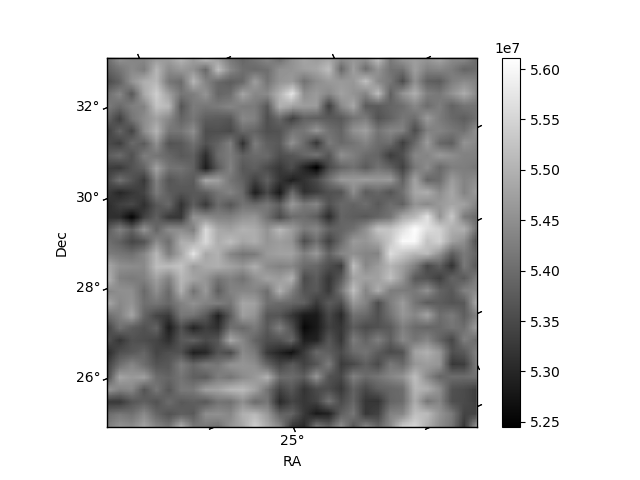 |
| Module-wise count rates for Quadrant D Data is divided into 100 sec bins |
 |
 |
| Parameter | Plot |
|---|---|
| CZT HV Monitor | 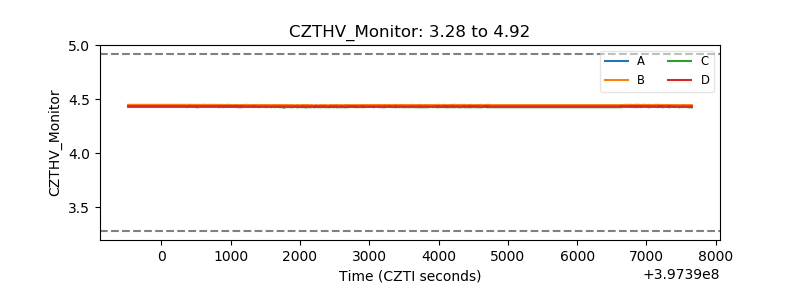 |
| D_VDD | 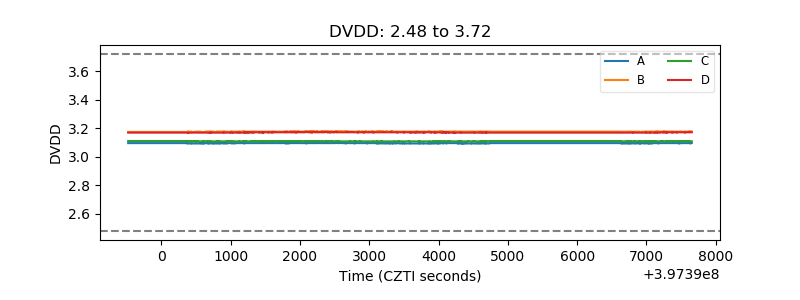 |
| Temperature 1 | 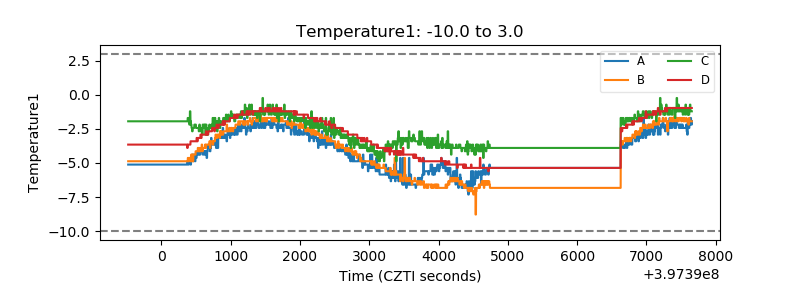 |
| Veto HV Monitor | 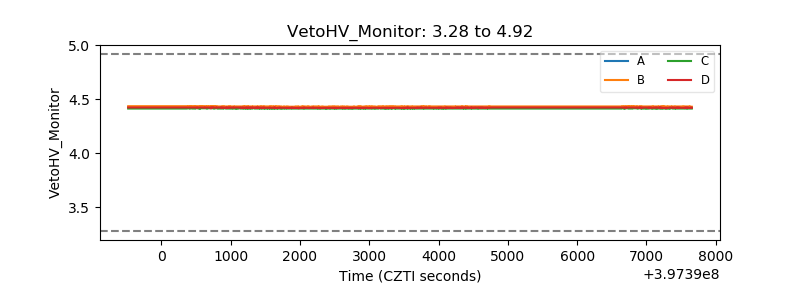 |
| Veto LLD |  |
| Alpha Counter | 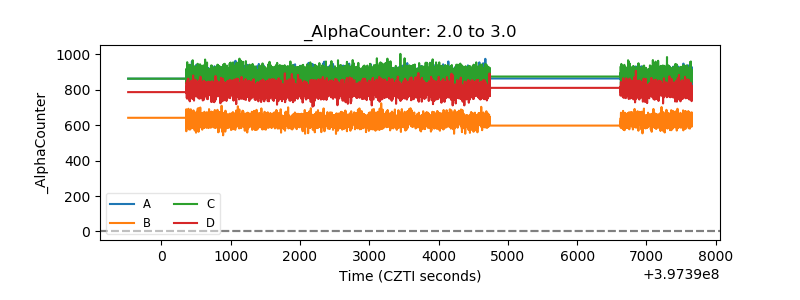 |
| _CPM_Rate |  |
| CZT Counter | 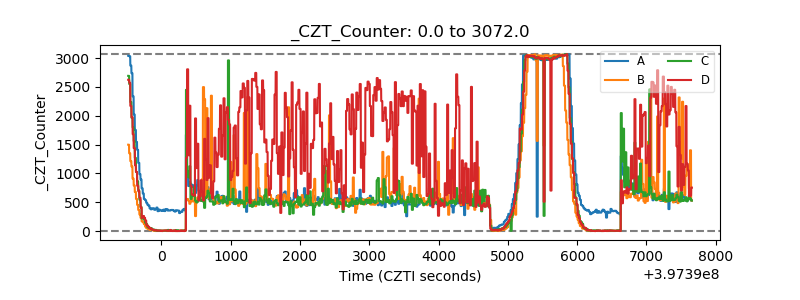 |
| +2.5 Volts monitor |  |
| +5 Volts monitor |  |
| _ROLL_ROT | 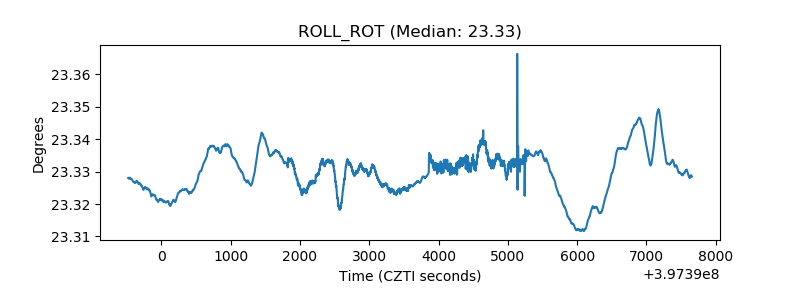 |
| _Roll_DEC | 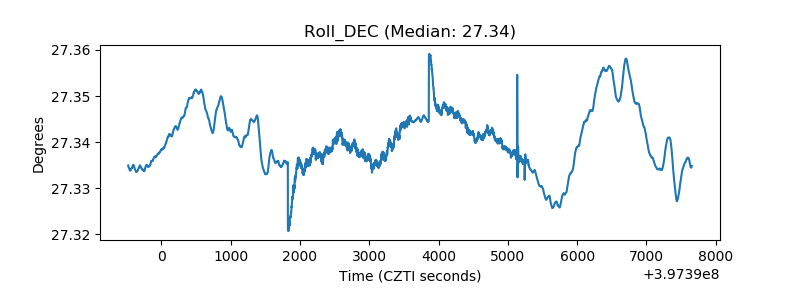 |
| _Roll_RA | 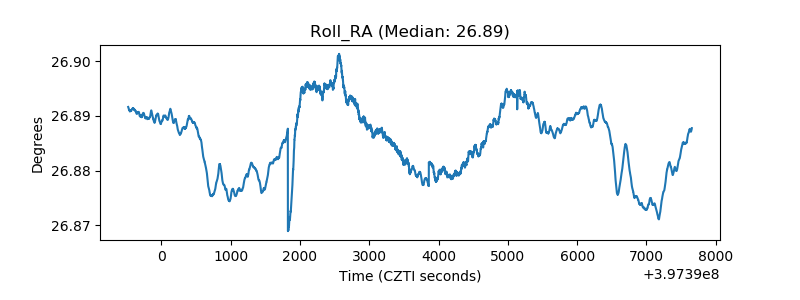 |
| Veto Counter | 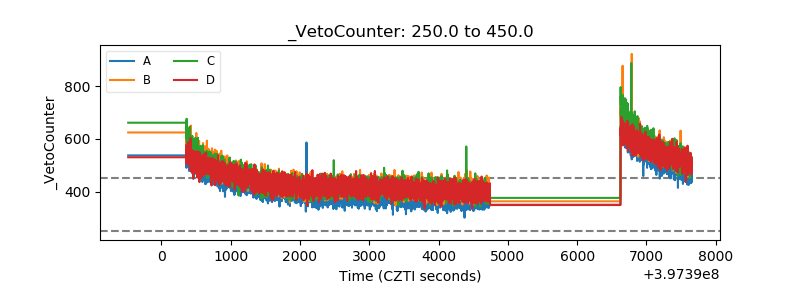 |