| Param | Original file | Final file |
|---|---|---|
| Filename | modeM0/AS1A11_046T02_9000005274_37056cztM0_level2.evt | modeM0/AS1A11_046T02_9000005274_37056cztM0_level2_quad_clean.evt |
| Size (bytes) | 576,469,440 | 51,393,600 |
| Size | 549.8 MB | 49.0 MB |
| Events in quadrant A | 3,075,632 | 316,193 |
| Events in quadrant B | 3,613,393 | 308,909 |
| Events in quadrant C | 3,156,665 | 308,481 |
| Events in quadrant D | 7,256,260 | 252,857 |
| Mode M9 | |||
|---|---|---|---|
| Quadrant | BADHDUFLAG | Total packets | Discarded packets |
| A | 0 | 22 | 0 |
| B | 0 | 22 | 0 |
| C | 0 | 22 | 0 |
| D | 0 | 23 | 0 |
| Mode SS | |||
|---|---|---|---|
| Quadrant | BADHDUFLAG | Total packets | Discarded packets |
| A | 0 | 106 | 0 |
| B | 0 | 106 | 0 |
| C | 0 | 106 | 0 |
| D | 0 | 106 | 0 |
| Mode M0 | |||
|---|---|---|---|
| Quadrant | BADHDUFLAG | Total packets | Discarded packets |
| A | 0 | 12530 | 3 |
| B | 0 | 14088 | 2 |
| C | 0 | 12506 | 2 |
| D | 0 | 25265 | 2 |
| Quadrant | Total seconds | Saturated seconds | Saturation percentage |
|---|---|---|---|
| A | 5274 | 22 | 0.417141% |
| B | 5274 | 235 | 4.455821% |
| C | 5274 | 55 | 1.042852% |
| D | 5274 | 1426 | 27.038301% |
Noise dominated data is calculated using 1-second bins in cleaned event files. If a bin has >2000 counts, and if more than 50% of those come from <1% of pixels, then it is considered to be noise-dominated and hence unusable.
| Quadrant | # 1 sec bins | Bins with >0 counts | Bins with >2000 counts | High rate bins dominated by noise | Noise dominated (total time) | Noise dominated (detector-on time) | Marked lightcurve |
|---|---|---|---|---|---|---|---|
| A | 7277 | 5275 | 7 | 7 | 0.10% | 0.13% | 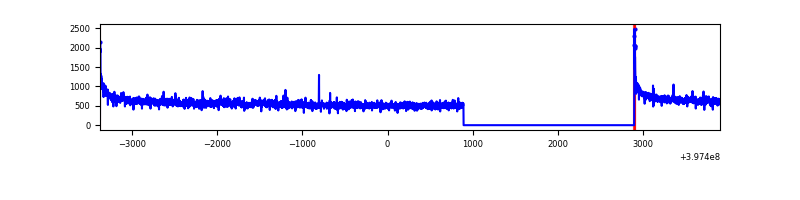 |
| B | 7277 | 5275 | 159 | 159 | 2.18% | 3.01% | 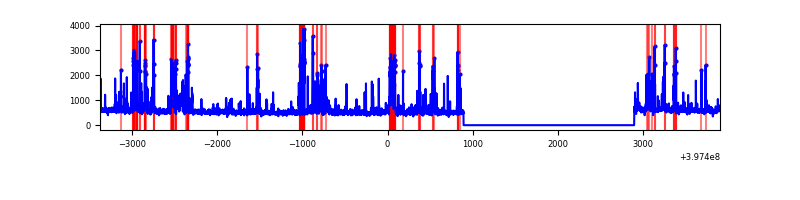 |
| C | 7277 | 5275 | 46 | 46 | 0.63% | 0.87% | 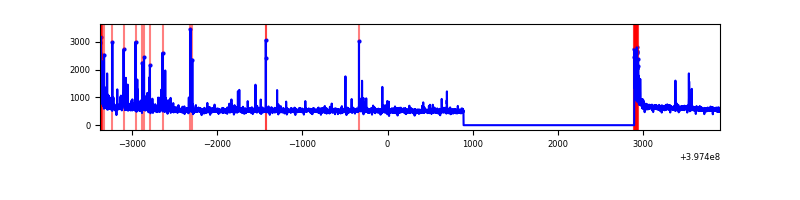 |
| D | 7277 | 5275 | 1276 | 1276 | 17.53% | 24.19% | 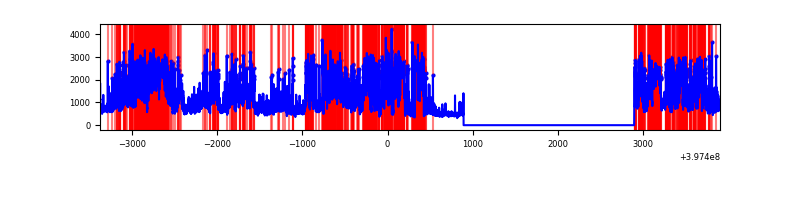 |
Top three noisy pixels from each quadrant. If the there are fewer than three noisy pixels in the level2.evt file, extra rows are filled as -1
| Pixel properties | Quadrant properties | ||||||
|---|---|---|---|---|---|---|---|
| Quadrant | DetID | PixID | Counts | Sigma | Mean | Median | Sigma |
| A | 10 | 83 | 260388 | 1867.18 | 700 | 689 | 139.1 |
| A | 11 | 254 | 101777 | 726.8 | 700 | 689 | 139.1 |
| A | 13 | 254 | 8335 | 54.97 | 700 | 689 | 139.1 |
| B | 5 | 172 | 670330 | 5275.57 | 676 | 662 | 126.9 |
| B | 5 | 200 | 90601 | 708.53 | 676 | 662 | 126.9 |
| B | 0 | 229 | 39159 | 303.28 | 676 | 662 | 126.9 |
| C | 15 | 214 | 225564 | 1468.12 | 668 | 674 | 153.2 |
| C | 0 | 10 | 133103 | 864.52 | 668 | 674 | 153.2 |
| C | 0 | 207 | 109516 | 710.54 | 668 | 674 | 153.2 |
| D | 12 | 17 | 2101702 | 14409.98 | 603 | 588 | 145.8 |
| D | 13 | 171 | 1033659 | 7085.07 | 603 | 588 | 145.8 |
| D | 1 | 52 | 616560 | 4224.5 | 603 | 588 | 145.8 |
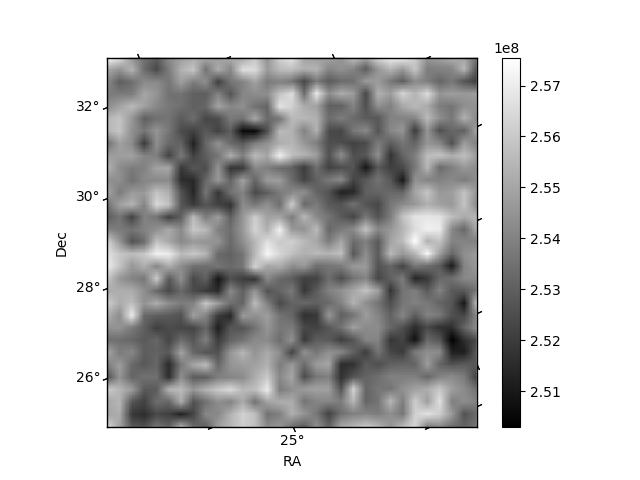
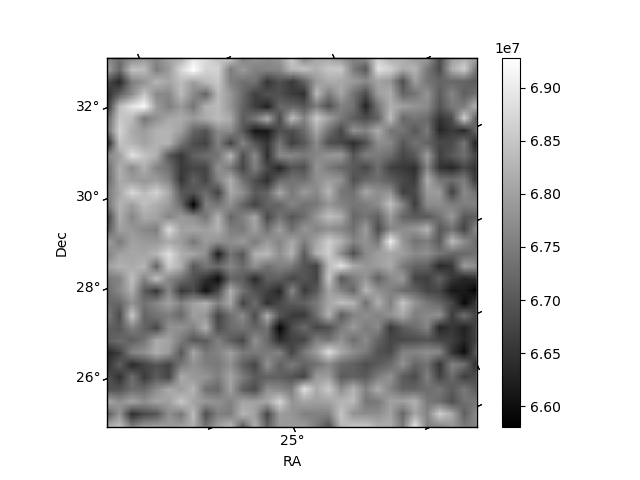
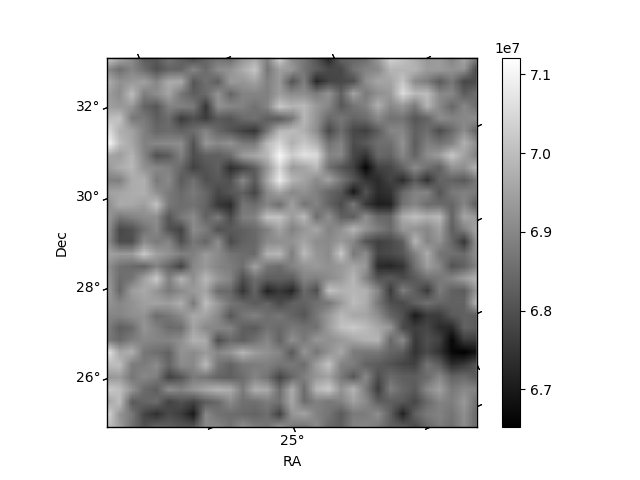
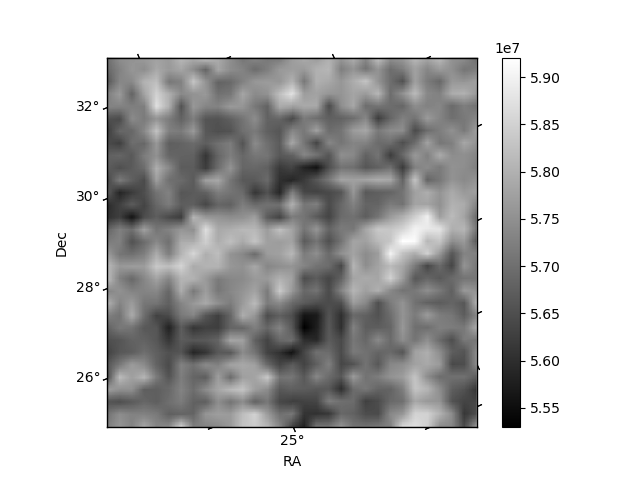
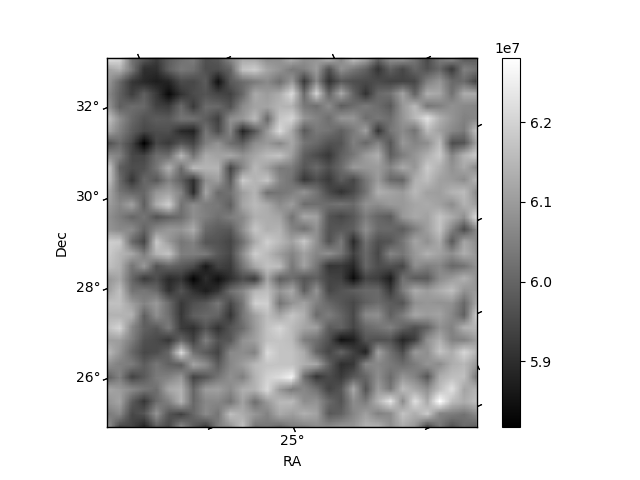
Histogram calculated using DETX and DETY for each event in the final _common_clean file
| Quadrant A | 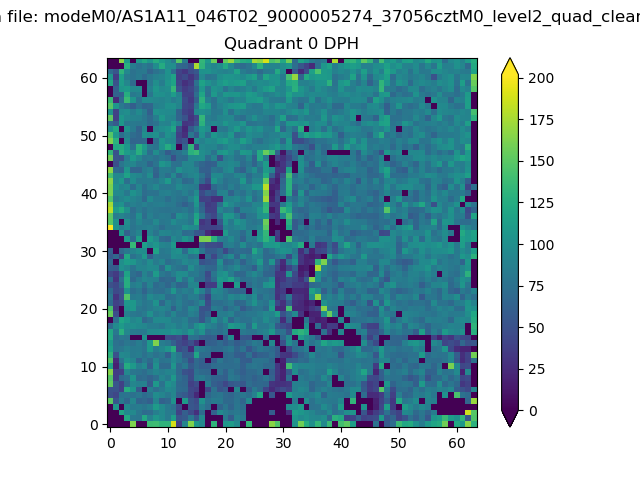 |
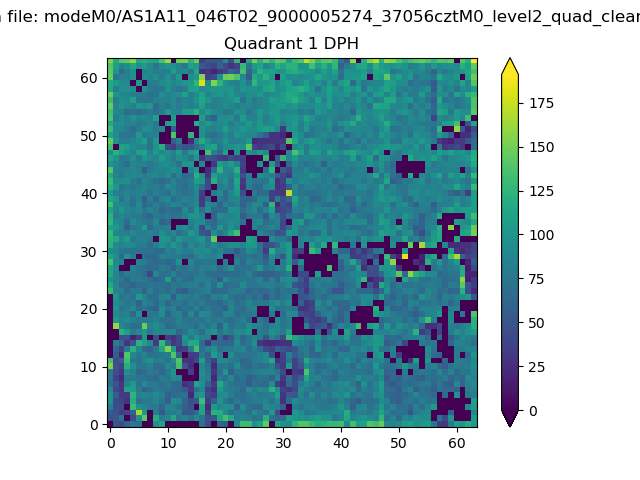 |
Quadrant B |
|---|---|---|---|
| Quadrant D | 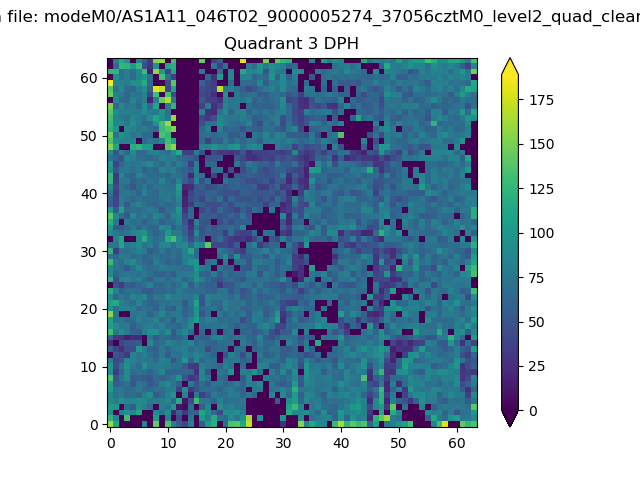 |
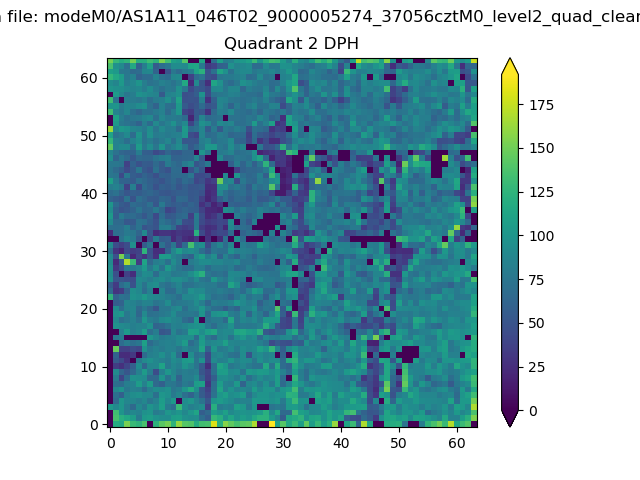 |
Quadrant C |
| Plot type | Count rate plots | Images |
|---|---|---|
| Comparison with Poisson distribution Blue bars denote a histogram of data divided into 1 sec bins. Red curve is a Poisson curve with rate = median count rate of data. |
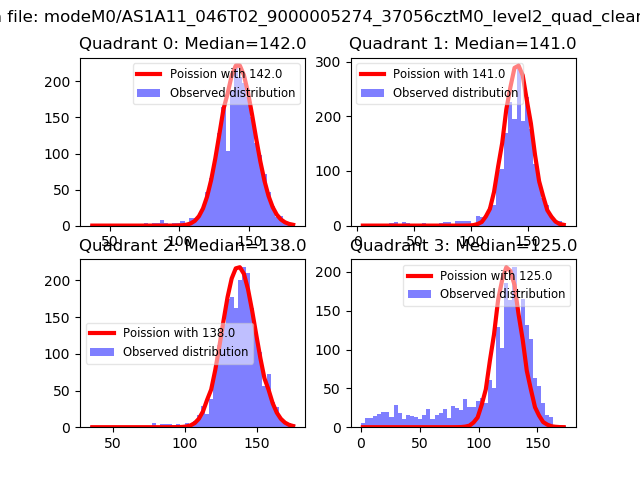 |
 |
| Quadrant-wise count rates Data is divided into 100 sec bins |
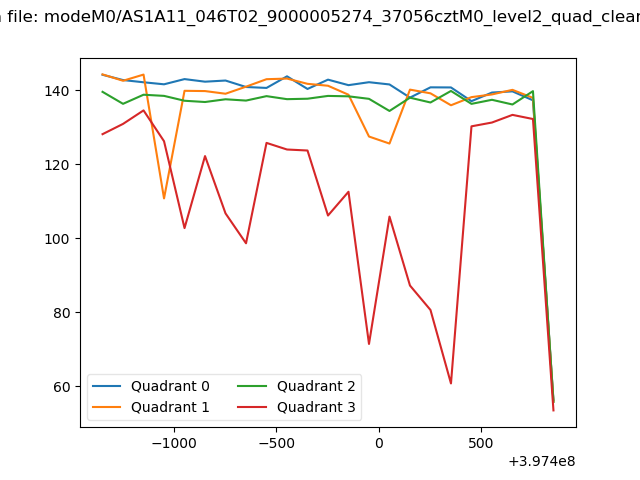 |
|
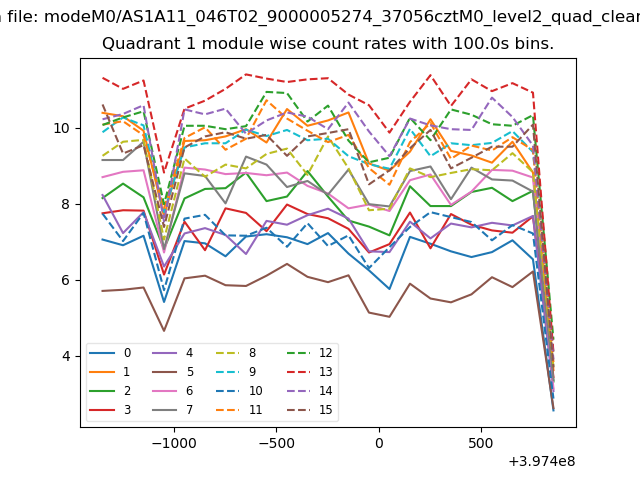
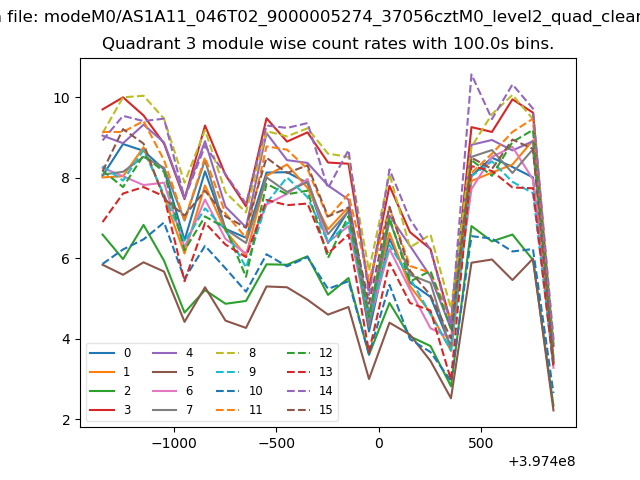
| Module-wise count rates for Quadrant A Data is divided into 100 sec bins |
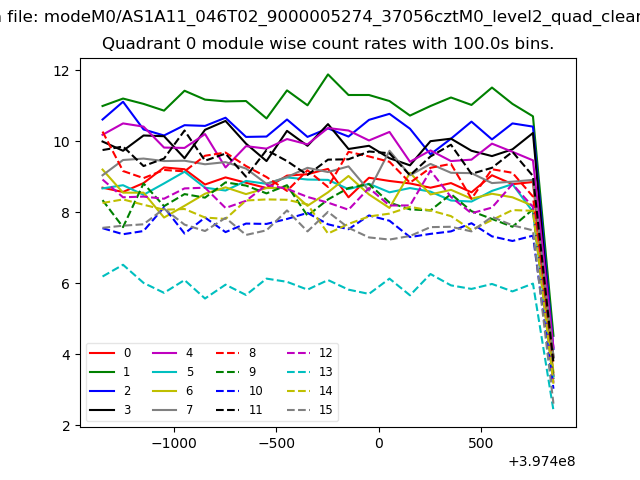 |
 |
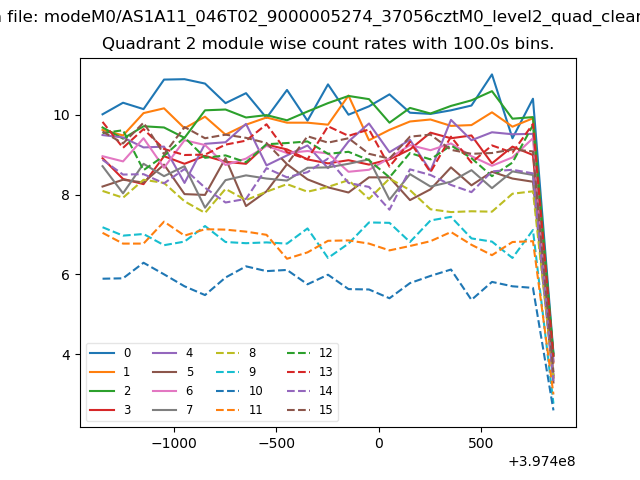
| Module-wise count rates for Quadrant B Data is divided into 100 sec bins |
 |
 |
| Module-wise count rates for Quadrant C Data is divided into 100 sec bins |
 |
 |
| Module-wise count rates for Quadrant D Data is divided into 100 sec bins |
 |
 |
| Parameter | Plot |
|---|---|
| CZT HV Monitor | 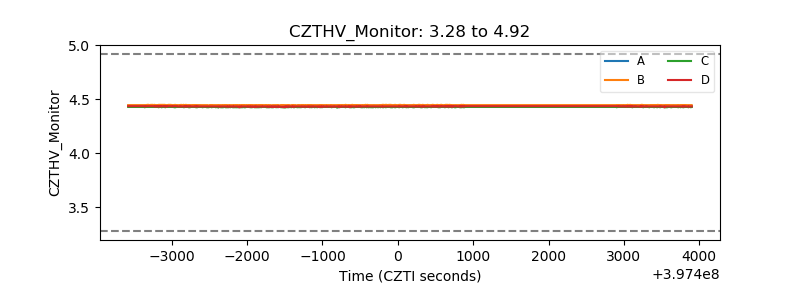 |
| D_VDD | 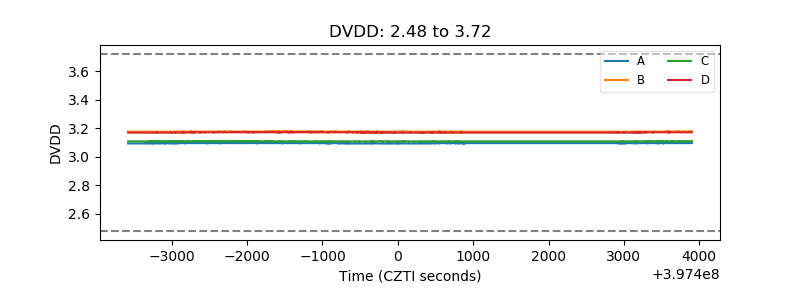 |
| Temperature 1 | 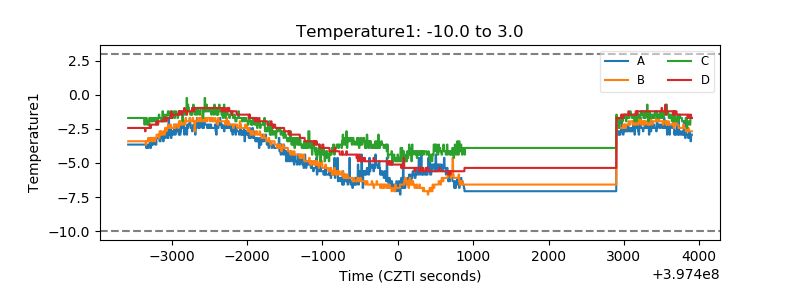 |
| Veto HV Monitor | 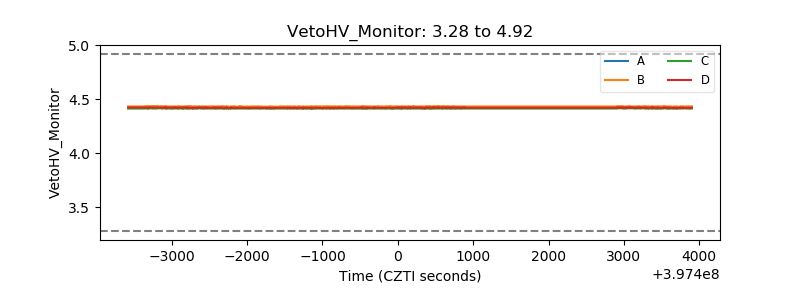 |
| Veto LLD | 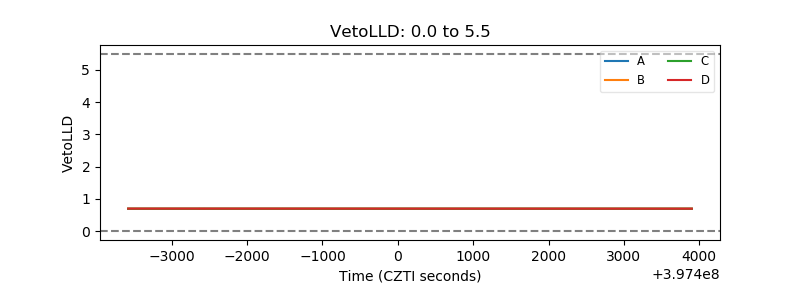 |
| Alpha Counter | 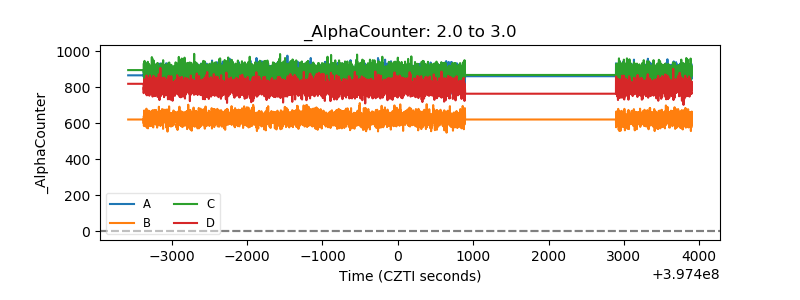 |
| _CPM_Rate | 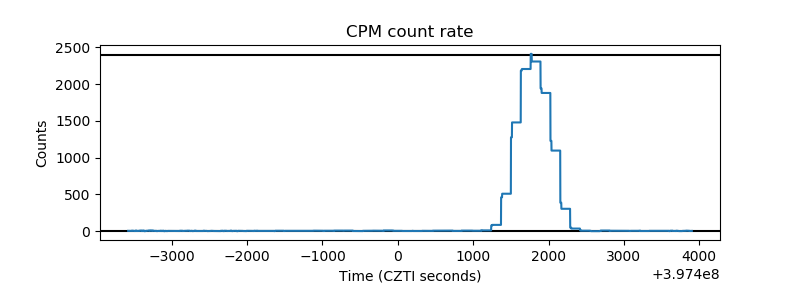 |
| CZT Counter |  |
| +2.5 Volts monitor | 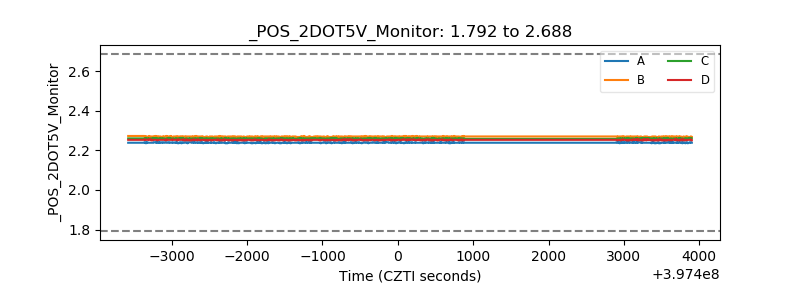 |
| +5 Volts monitor | 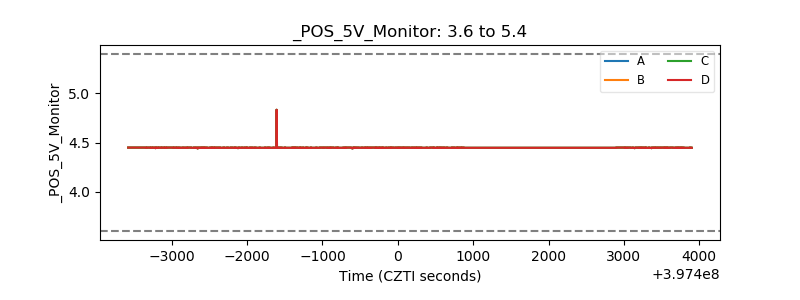 |
| _ROLL_ROT | 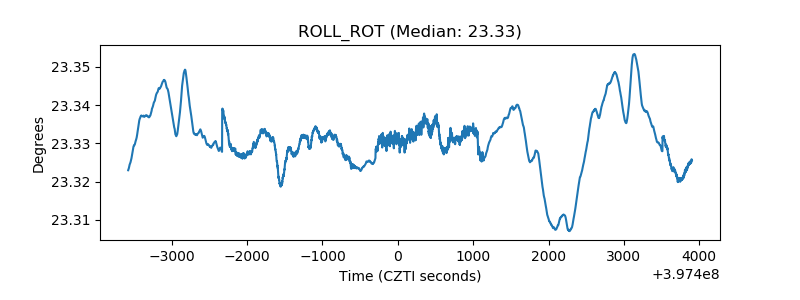 |
| _Roll_DEC | 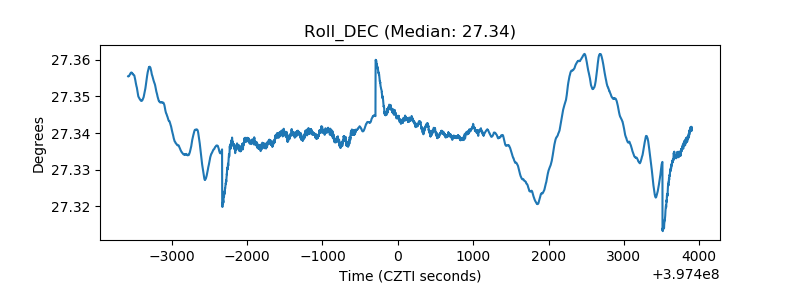 |
| _Roll_RA |  |
| Veto Counter | 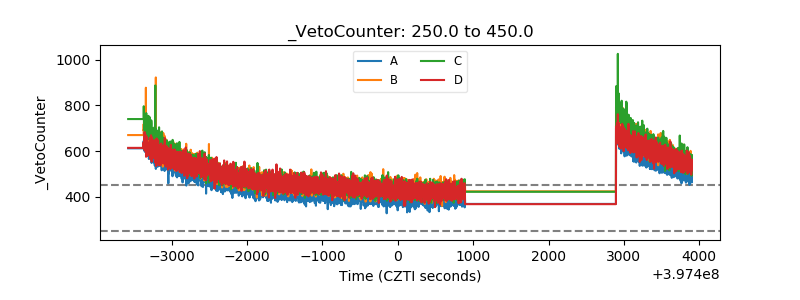 |