| Param | Original file | Final file |
|---|---|---|
| Filename | modeM0/AS1A11_046T02_9000005274_37057cztM0_level2.evt | modeM0/AS1A11_046T02_9000005274_37057cztM0_level2_quad_clean.evt |
| Size (bytes) | 576,449,280 | 59,106,240 |
| Size | 549.7 MB | 56.4 MB |
| Events in quadrant A | 2,986,608 | 377,436 |
| Events in quadrant B | 3,625,263 | 376,480 |
| Events in quadrant C | 3,469,173 | 364,134 |
| Events in quadrant D | 7,031,457 | 313,151 |
| Mode M9 | |||
|---|---|---|---|
| Quadrant | BADHDUFLAG | Total packets | Discarded packets |
| A | 0 | 27 | 0 |
| B | 0 | 27 | 0 |
| C | 0 | 27 | 0 |
| D | 0 | 28 | 0 |
| Mode SS | |||
|---|---|---|---|
| Quadrant | BADHDUFLAG | Total packets | Discarded packets |
| A | 0 | 104 | 0 |
| B | 0 | 104 | 0 |
| C | 0 | 104 | 0 |
| D | 0 | 104 | 0 |
| Mode M0 | |||
|---|---|---|---|
| Quadrant | BADHDUFLAG | Total packets | Discarded packets |
| A | 0 | 12211 | 3 |
| B | 0 | 14071 | 2 |
| C | 0 | 13504 | 2 |
| D | 0 | 24468 | 2 |
| Quadrant | Total seconds | Saturated seconds | Saturation percentage |
|---|---|---|---|
| A | 5107 | 21 | 0.411200% |
| B | 5107 | 270 | 5.286861% |
| C | 5107 | 189 | 3.700803% |
| D | 5107 | 1329 | 26.023106% |
Noise dominated data is calculated using 1-second bins in cleaned event files. If a bin has >2000 counts, and if more than 50% of those come from <1% of pixels, then it is considered to be noise-dominated and hence unusable.
| Quadrant | # 1 sec bins | Bins with >0 counts | Bins with >2000 counts | High rate bins dominated by noise | Noise dominated (total time) | Noise dominated (detector-on time) | Marked lightcurve |
|---|---|---|---|---|---|---|---|
| A | 7200 | 5108 | 9 | 9 | 0.12% | 0.18% | 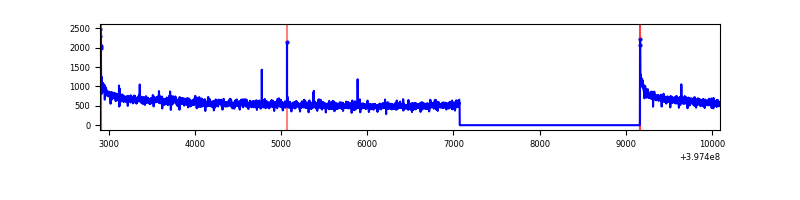 |
| B | 7200 | 5108 | 186 | 186 | 2.58% | 3.64% | 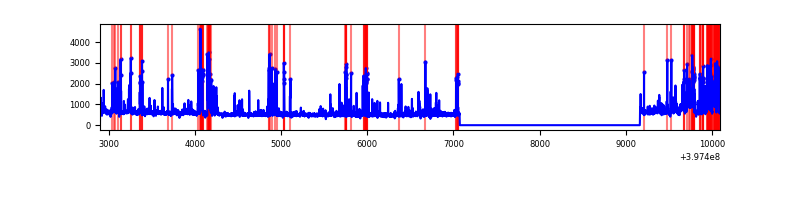 |
| C | 7200 | 5108 | 167 | 167 | 2.32% | 3.27% | 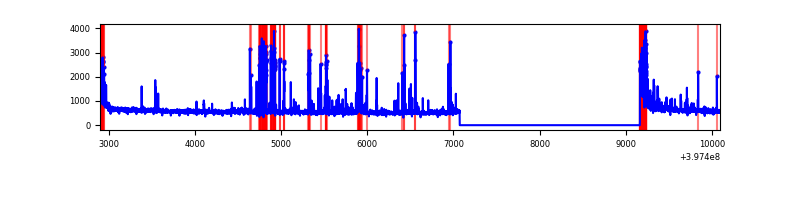 |
| D | 7200 | 5108 | 1176 | 1176 | 16.33% | 23.02% | 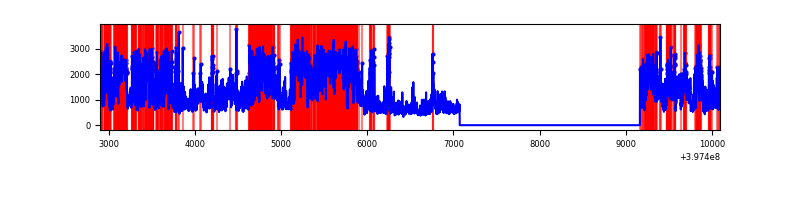 |
Top three noisy pixels from each quadrant. If the there are fewer than three noisy pixels in the level2.evt file, extra rows are filled as -1
| Pixel properties | Quadrant properties | ||||||
|---|---|---|---|---|---|---|---|
| Quadrant | DetID | PixID | Counts | Sigma | Mean | Median | Sigma |
| A | 10 | 83 | 258298 | 1888.12 | 686 | 676 | 136.4 |
| A | 11 | 254 | 53491 | 387.08 | 686 | 676 | 136.4 |
| A | 7 | 3 | 10003 | 68.36 | 686 | 676 | 136.4 |
| B | 5 | 172 | 697813 | 5641.75 | 666 | 651 | 123.6 |
| B | 5 | 184 | 158696 | 1278.97 | 666 | 651 | 123.6 |
| B | 15 | 85 | 72732 | 583.31 | 666 | 651 | 123.6 |
| C | 0 | 10 | 587993 | 3888.63 | 657 | 663 | 151.0 |
| C | 15 | 214 | 214263 | 1414.22 | 657 | 663 | 151.0 |
| C | 0 | 207 | 64305 | 421.36 | 657 | 663 | 151.0 |
| D | 12 | 17 | 2201161 | 14909.1 | 612 | 596 | 147.6 |
| D | 6 | 112 | 1347703 | 9126.81 | 612 | 596 | 147.6 |
| D | 1 | 52 | 529082 | 3580.56 | 612 | 596 | 147.6 |
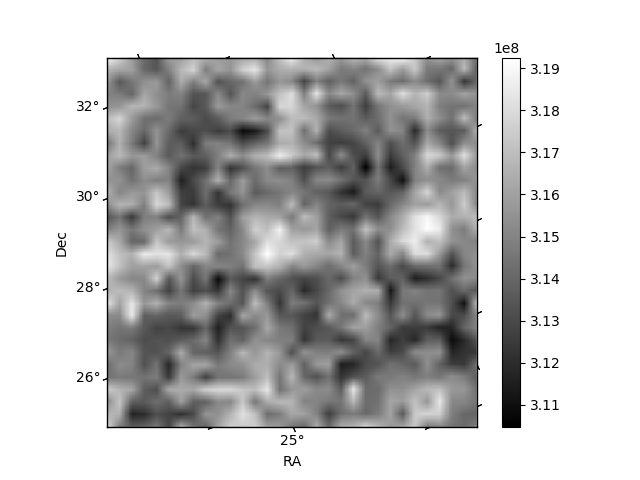
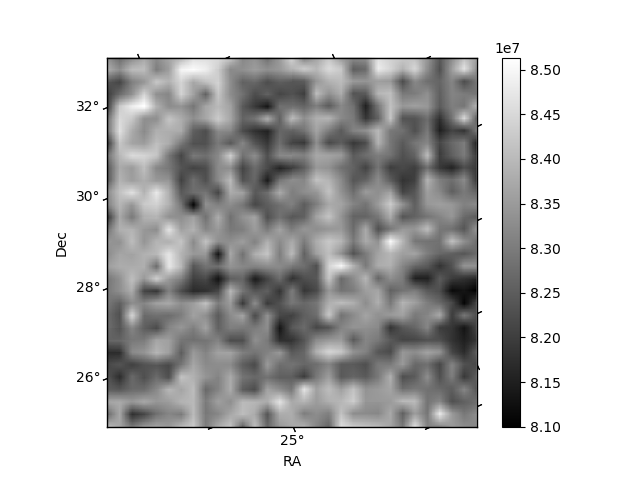
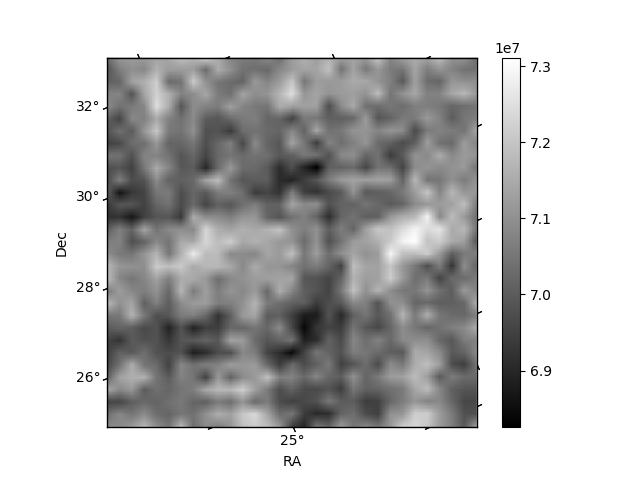
Histogram calculated using DETX and DETY for each event in the final _common_clean file
| Quadrant A | 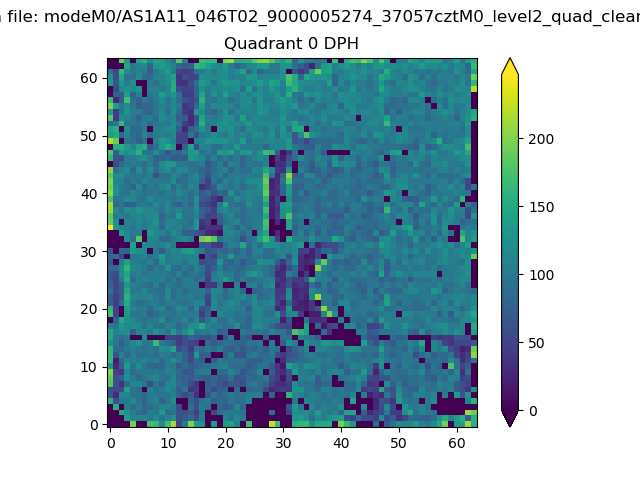 |
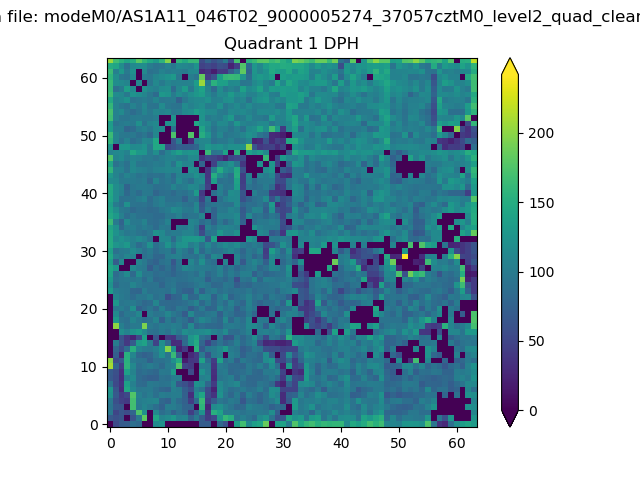 |
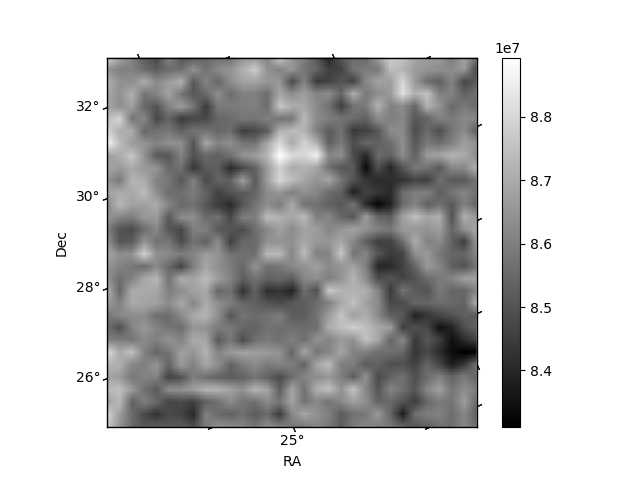
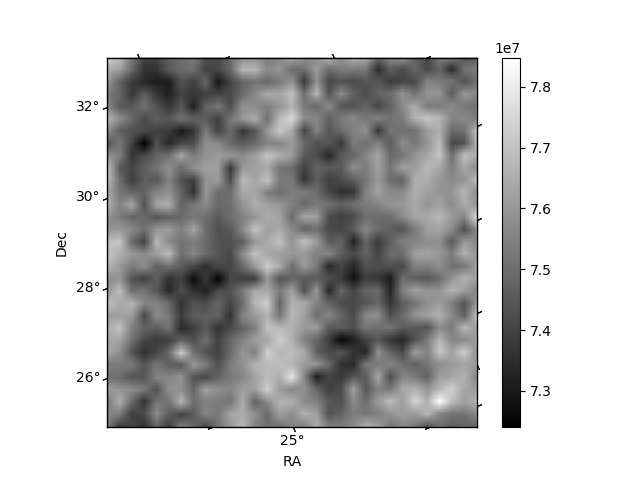
Quadrant B |
|---|---|---|---|
| Quadrant D | 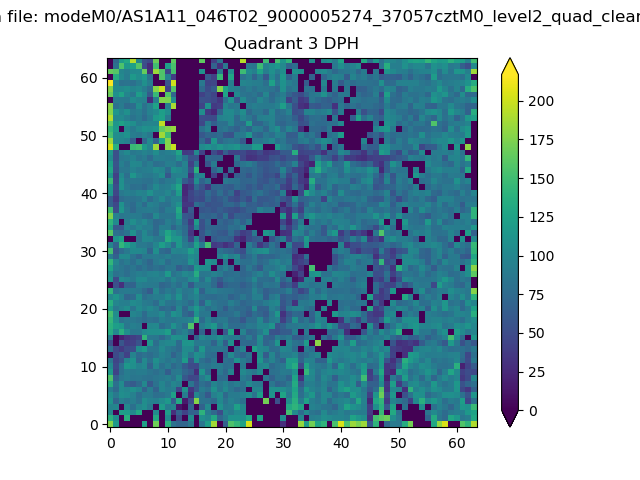 |
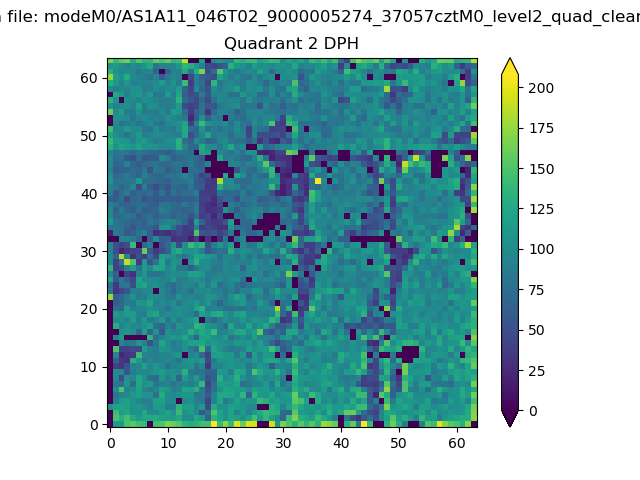 |
Quadrant C |
| Plot type | Count rate plots | Images |
|---|---|---|
| Comparison with Poisson distribution Blue bars denote a histogram of data divided into 1 sec bins. Red curve is a Poisson curve with rate = median count rate of data. |
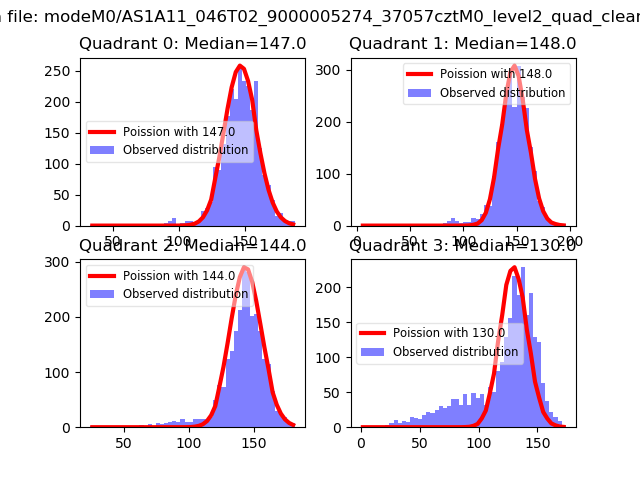 |
 |
| Quadrant-wise count rates Data is divided into 100 sec bins |
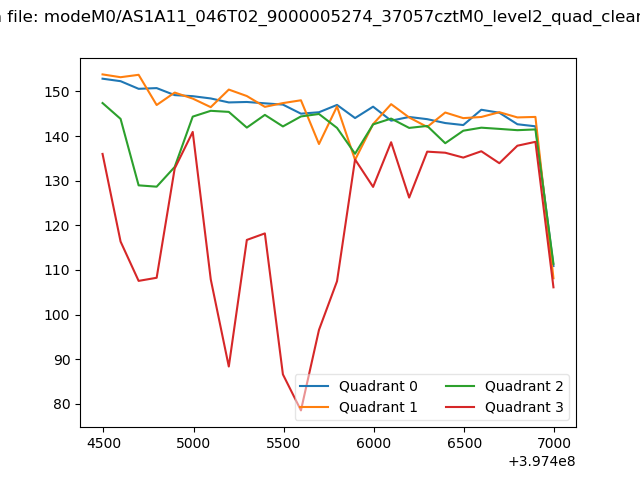 |
|
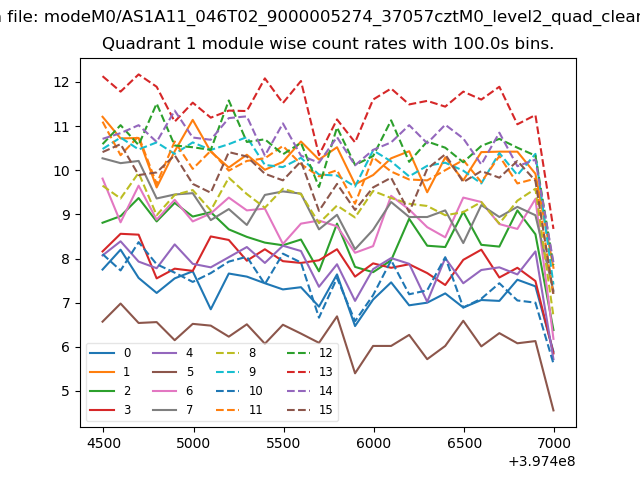
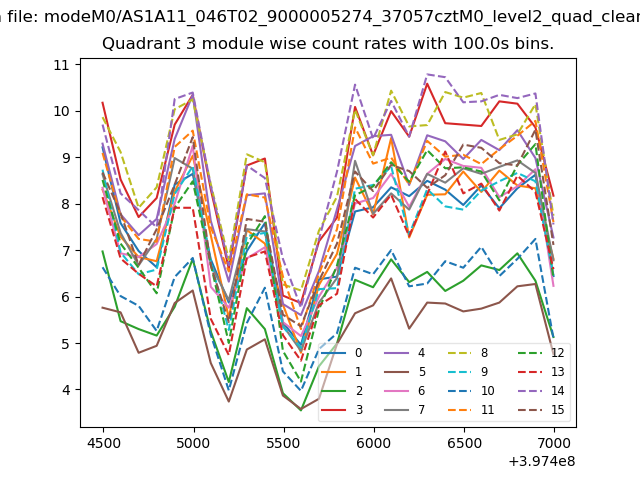
| Module-wise count rates for Quadrant A Data is divided into 100 sec bins |
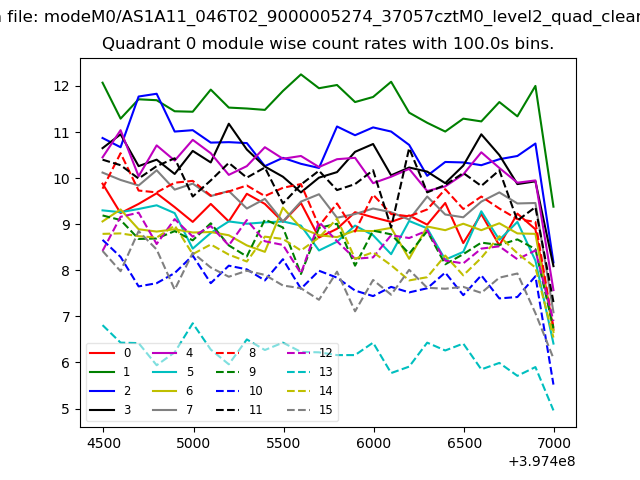 |
 |
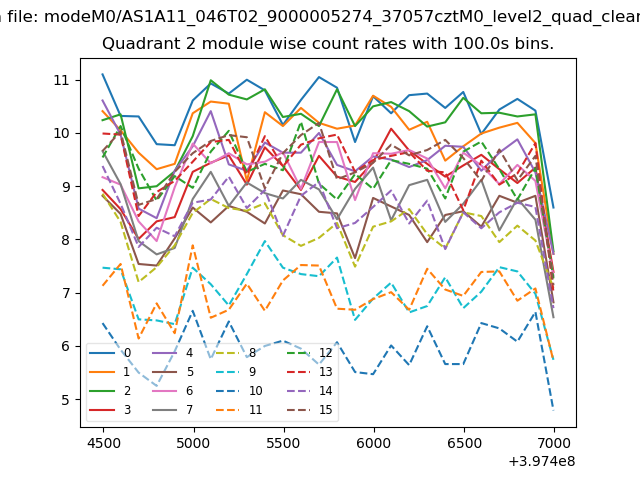
| Module-wise count rates for Quadrant B Data is divided into 100 sec bins |
 |
 |
| Module-wise count rates for Quadrant C Data is divided into 100 sec bins |
 |
 |
| Module-wise count rates for Quadrant D Data is divided into 100 sec bins |
 |
 |
| Parameter | Plot |
|---|---|
| CZT HV Monitor | 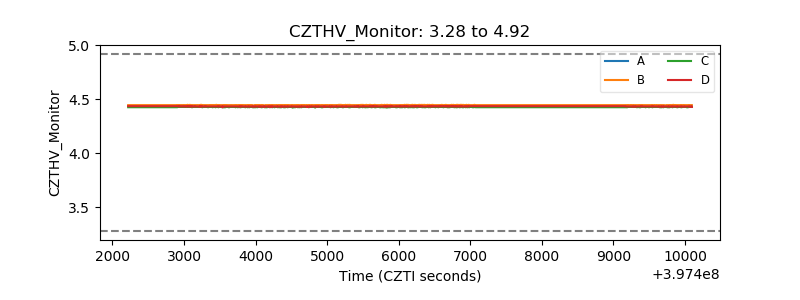 |
| D_VDD | 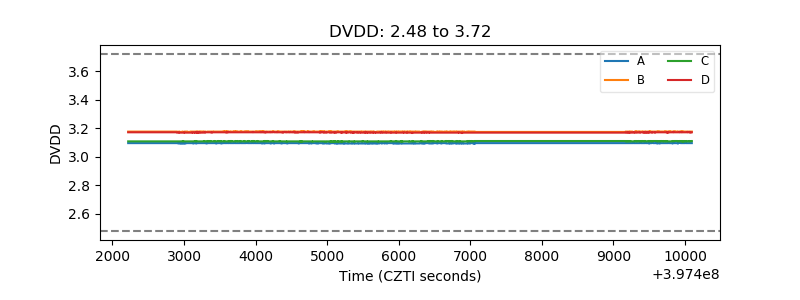 |
| Temperature 1 | 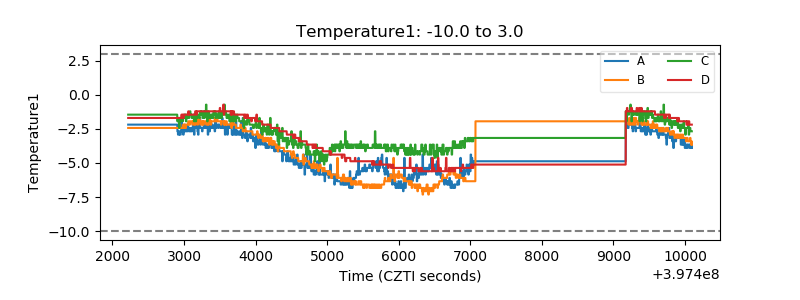 |
| Veto HV Monitor | 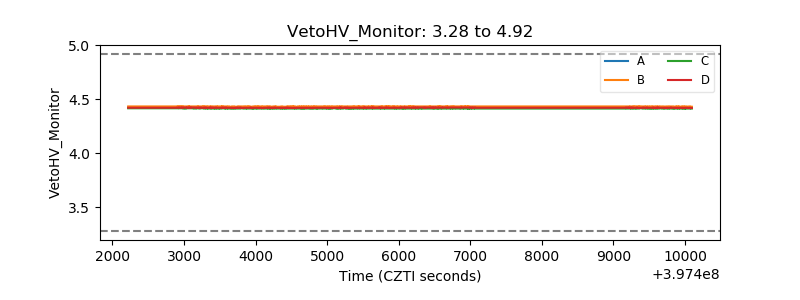 |
| Veto LLD | 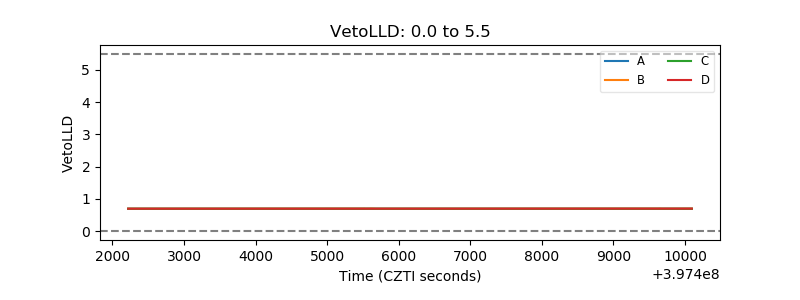 |
| Alpha Counter | 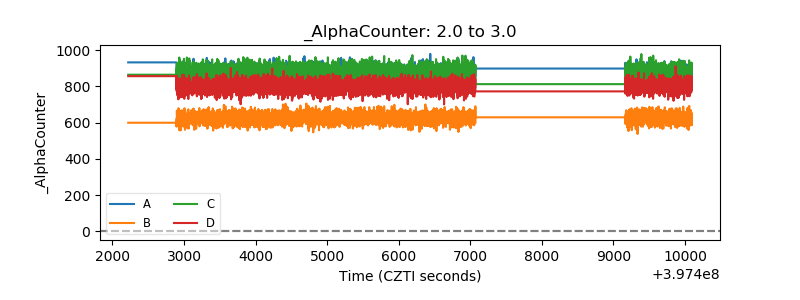 |
| _CPM_Rate | 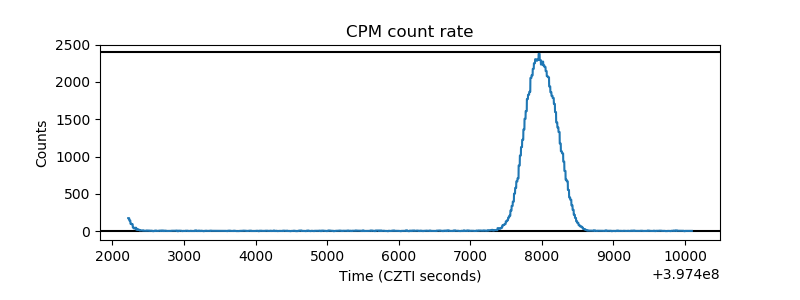 |
| CZT Counter |  |
| +2.5 Volts monitor | 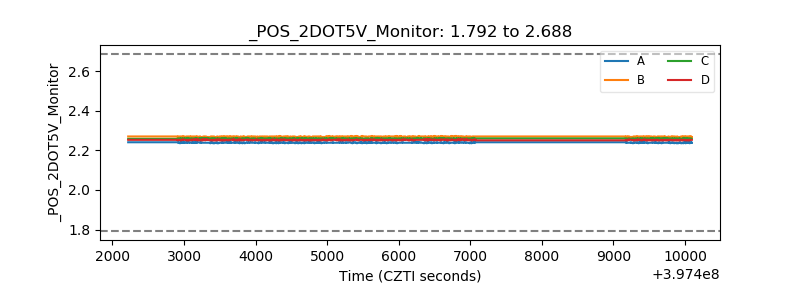 |
| +5 Volts monitor | 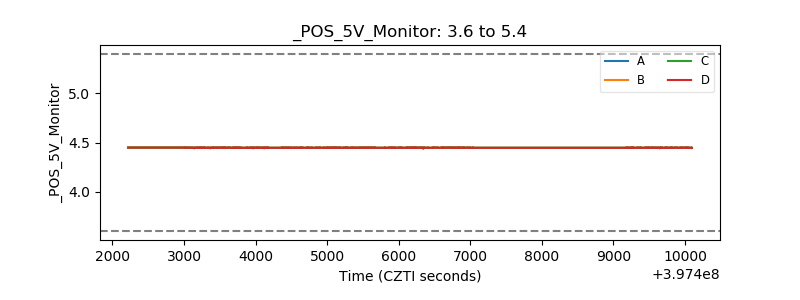 |
| _ROLL_ROT | 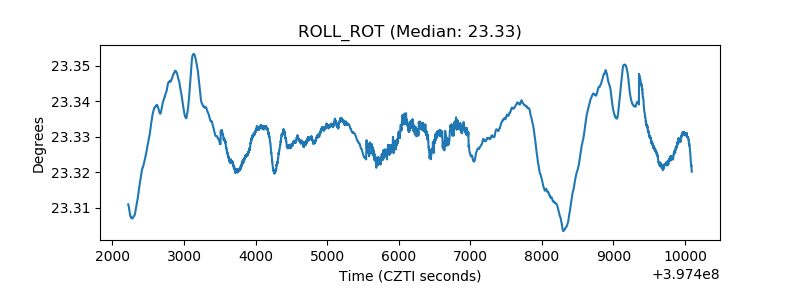 |
| _Roll_DEC | 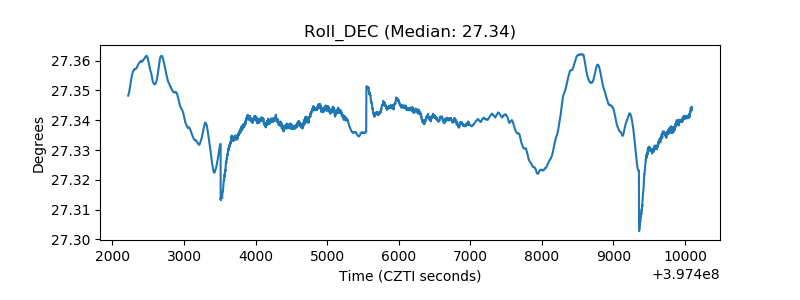 |
| _Roll_RA | 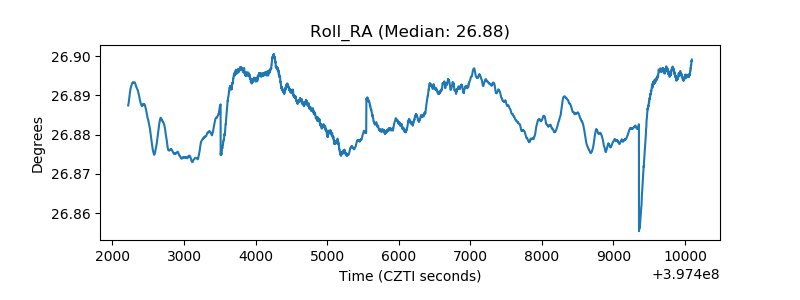 |
| Veto Counter | 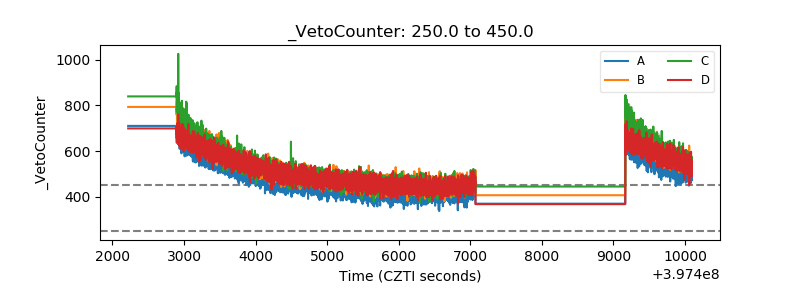 |