| Param | Original file | Final file |
|---|---|---|
| Filename | modeM0/AS1A11_046T02_9000005274_37058cztM0_level2.evt | modeM0/AS1A11_046T02_9000005274_37058cztM0_level2_quad_clean.evt |
| Size (bytes) | 530,671,680 | 65,931,840 |
| Size | 506.1 MB | 62.9 MB |
| Events in quadrant A | 2,713,378 | 431,017 |
| Events in quadrant B | 3,529,547 | 425,592 |
| Events in quadrant C | 3,472,335 | 418,904 |
| Events in quadrant D | 6,031,121 | 383,355 |
| Mode M9 | |||
|---|---|---|---|
| Quadrant | BADHDUFLAG | Total packets | Discarded packets |
| A | 0 | 33 | 0 |
| B | 0 | 33 | 0 |
| C | 0 | 33 | 0 |
| D | 0 | 34 | 0 |
| Mode SS | |||
|---|---|---|---|
| Quadrant | BADHDUFLAG | Total packets | Discarded packets |
| A | 0 | 98 | 0 |
| B | 0 | 98 | 0 |
| C | 0 | 98 | 0 |
| D | 0 | 98 | 0 |
| Mode M0 | |||
|---|---|---|---|
| Quadrant | BADHDUFLAG | Total packets | Discarded packets |
| A | 0 | 11066 | 3 |
| B | 0 | 13639 | 2 |
| C | 0 | 13466 | 2 |
| D | 0 | 21289 | 2 |
| Quadrant | Total seconds | Saturated seconds | Saturation percentage |
|---|---|---|---|
| A | 4807 | 12 | 0.249636% |
| B | 4807 | 269 | 5.596006% |
| C | 4807 | 214 | 4.451841% |
| D | 4807 | 754 | 15.685459% |
Noise dominated data is calculated using 1-second bins in cleaned event files. If a bin has >2000 counts, and if more than 50% of those come from <1% of pixels, then it is considered to be noise-dominated and hence unusable.
| Quadrant | # 1 sec bins | Bins with >0 counts | Bins with >2000 counts | High rate bins dominated by noise | Noise dominated (total time) | Noise dominated (detector-on time) | Marked lightcurve |
|---|---|---|---|---|---|---|---|
| A | 6959 | 4808 | 4 | 4 | 0.06% | 0.08% | 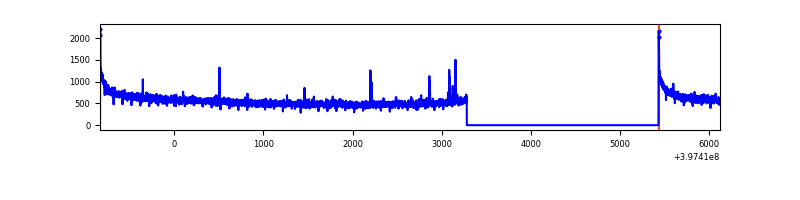 |
| B | 6959 | 4808 | 186 | 186 | 2.67% | 3.87% | 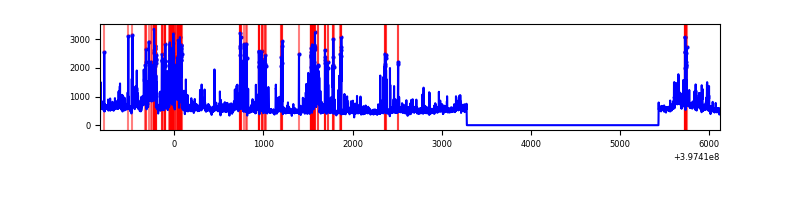 |
| C | 6959 | 4808 | 176 | 176 | 2.53% | 3.66% | 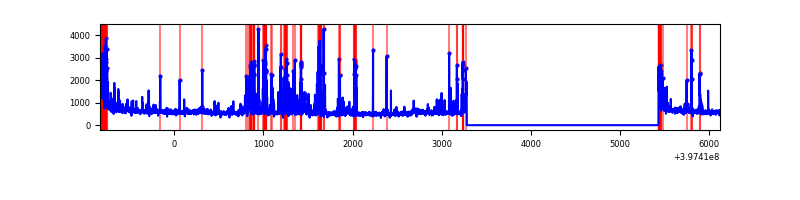 |
| D | 6959 | 4808 | 667 | 667 | 9.58% | 13.87% | 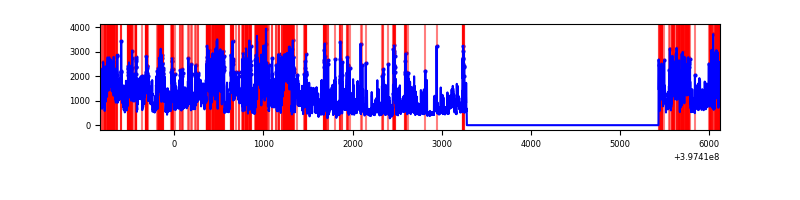 |
Top three noisy pixels from each quadrant. If the there are fewer than three noisy pixels in the level2.evt file, extra rows are filled as -1
| Pixel properties | Quadrant properties | ||||||
|---|---|---|---|---|---|---|---|
| Quadrant | DetID | PixID | Counts | Sigma | Mean | Median | Sigma |
| A | 10 | 83 | 250249 | 1972.74 | 629 | 618 | 126.5 |
| A | 7 | 3 | 16048 | 121.94 | 629 | 618 | 126.5 |
| A | 7 | 16 | 8915 | 65.57 | 629 | 618 | 126.5 |
| B | 5 | 172 | 497935 | 4339.29 | 611 | 597 | 114.6 |
| B | 5 | 184 | 461291 | 4019.57 | 611 | 597 | 114.6 |
| B | 15 | 85 | 61285 | 529.51 | 611 | 597 | 114.6 |
| C | 1 | 23 | 518352 | 3713.51 | 604 | 609 | 139.4 |
| C | 0 | 10 | 251639 | 1800.51 | 604 | 609 | 139.4 |
| C | 15 | 214 | 202859 | 1450.64 | 604 | 609 | 139.4 |
| D | 6 | 112 | 1892701 | 13320.2 | 587 | 573 | 142.0 |
| D | 1 | 52 | 775984 | 5458.74 | 587 | 573 | 142.0 |
| D | 12 | 17 | 420656 | 2957.3 | 587 | 573 | 142.0 |
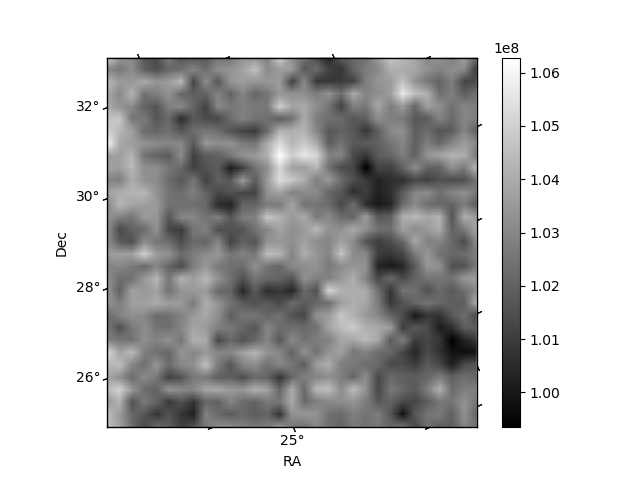
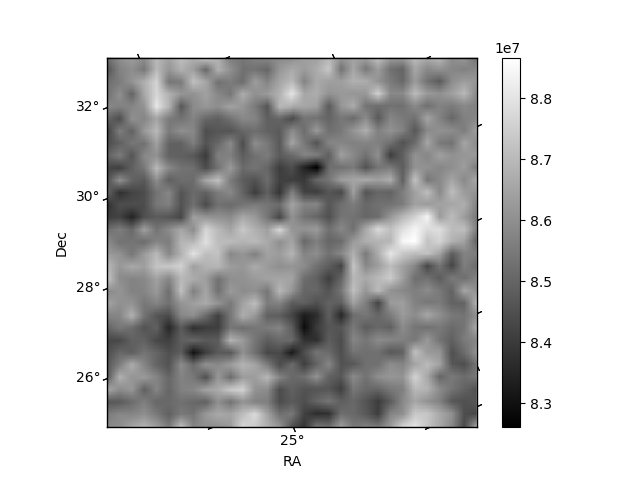
Histogram calculated using DETX and DETY for each event in the final _common_clean file
| Quadrant A | 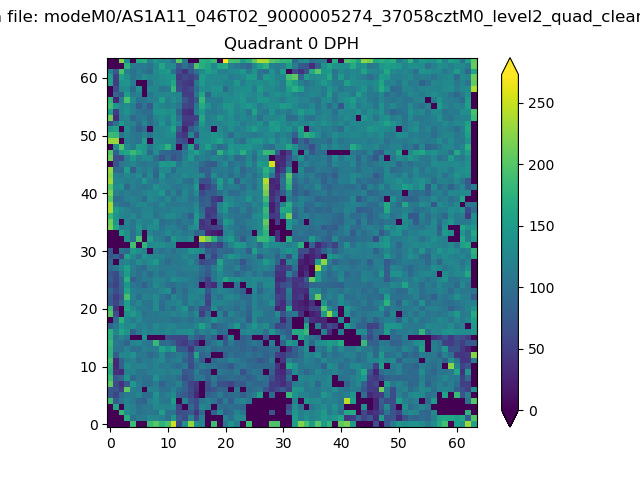 |
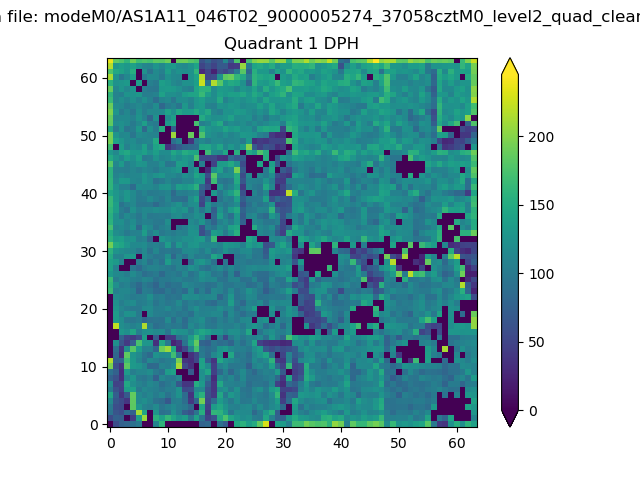 |
Quadrant B |
|---|---|---|---|
| Quadrant D | 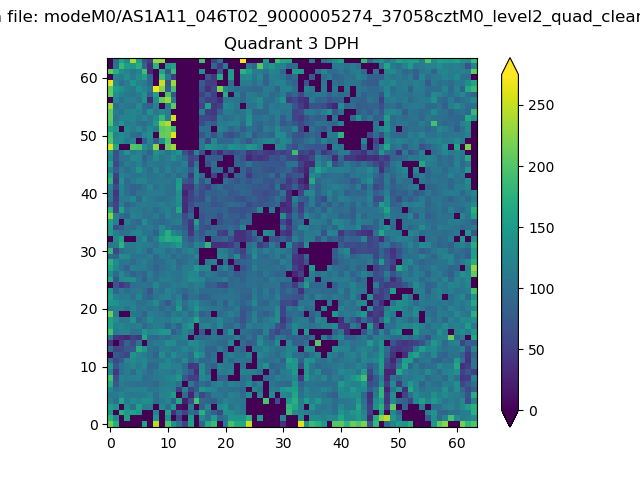 |
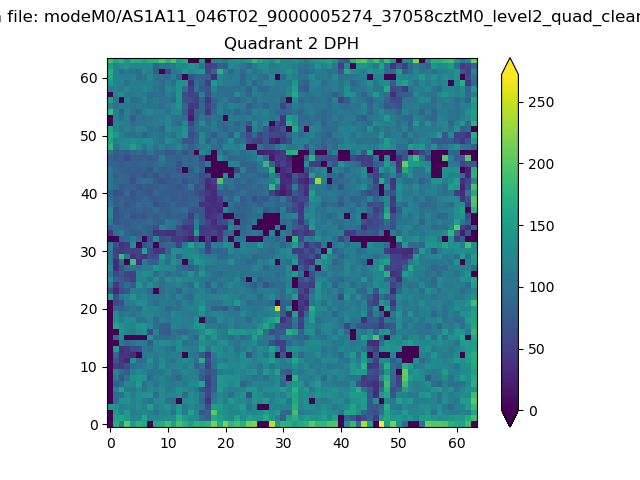 |
Quadrant C |
| Plot type | Count rate plots | Images |
|---|---|---|
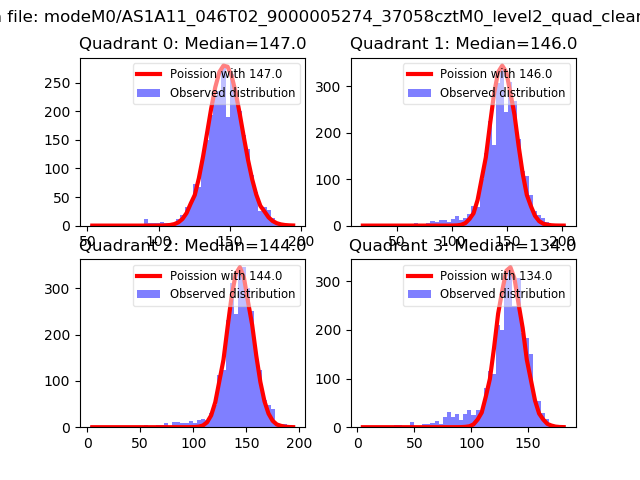
| Comparison with Poisson distribution Blue bars denote a histogram of data divided into 1 sec bins. Red curve is a Poisson curve with rate = median count rate of data. |
 |
 |
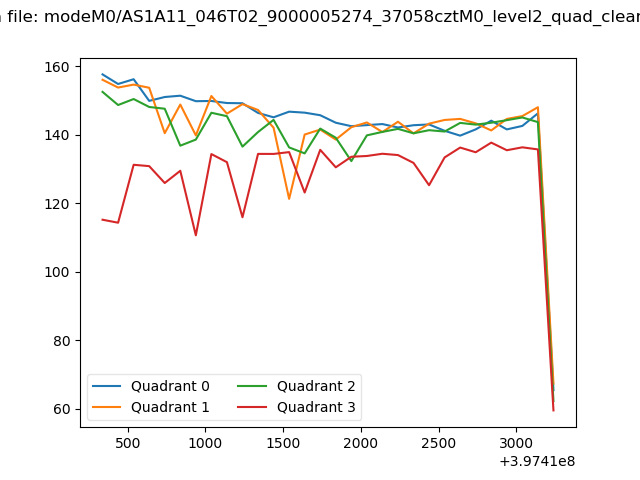
| Quadrant-wise count rates Data is divided into 100 sec bins |
 |
|
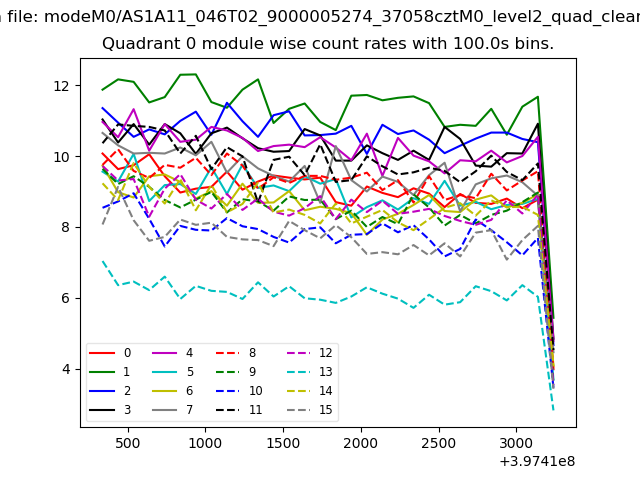
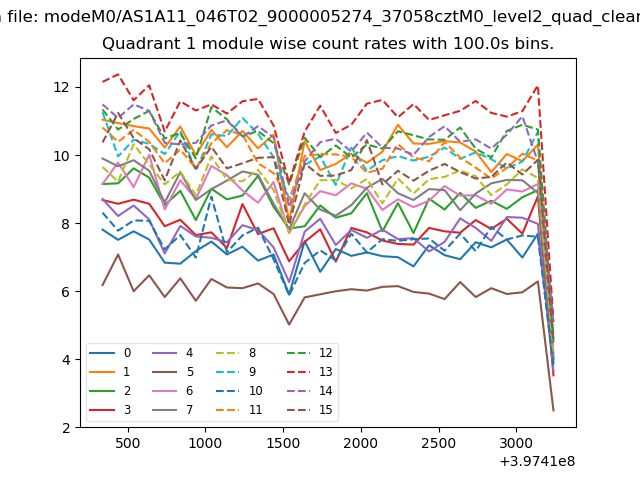
| Module-wise count rates for Quadrant A Data is divided into 100 sec bins |
 |
 |
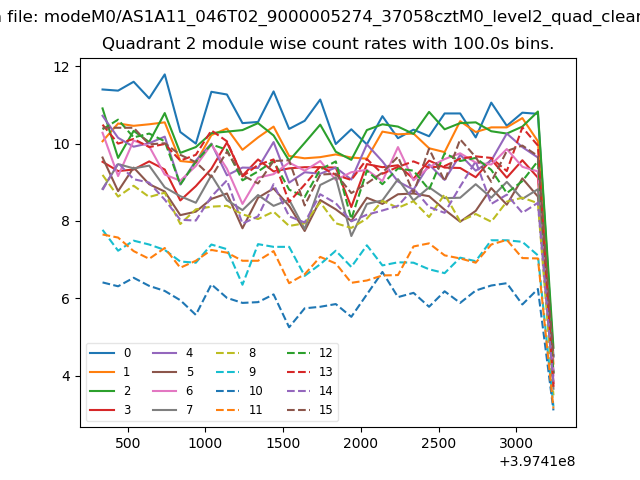
| Module-wise count rates for Quadrant B Data is divided into 100 sec bins |
 |
 |
| Module-wise count rates for Quadrant C Data is divided into 100 sec bins |
 |
 |
| Module-wise count rates for Quadrant D Data is divided into 100 sec bins |
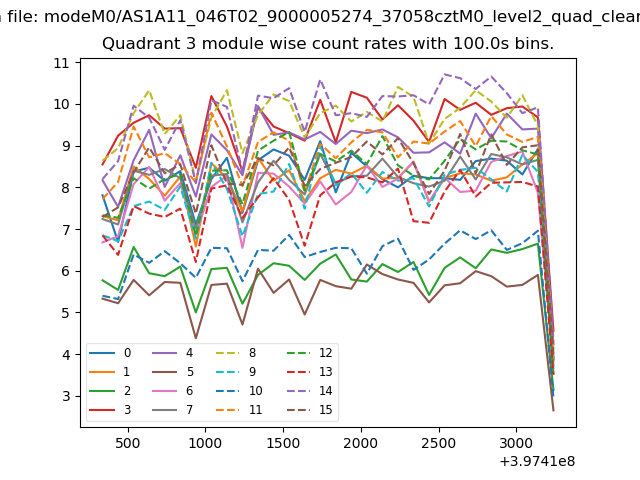 |
 |
| Parameter | Plot |
|---|---|
| CZT HV Monitor | 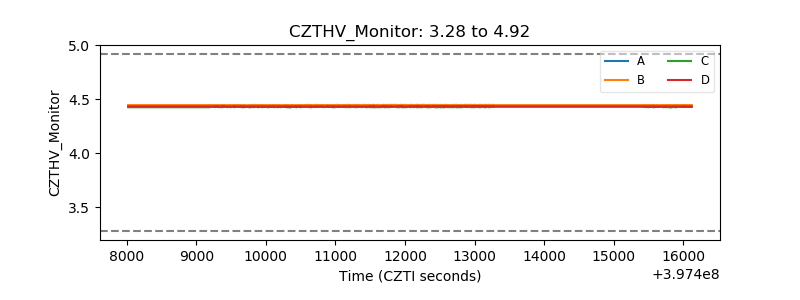 |
| D_VDD | 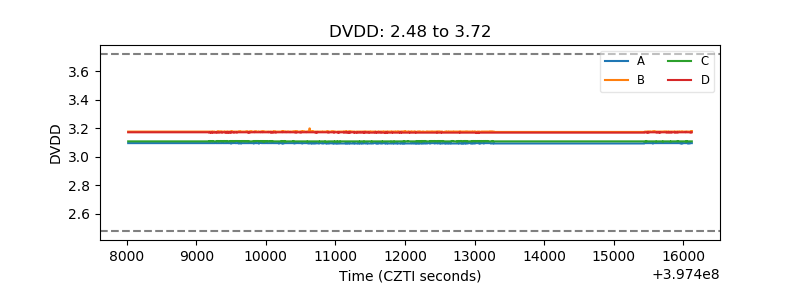 |
| Temperature 1 | 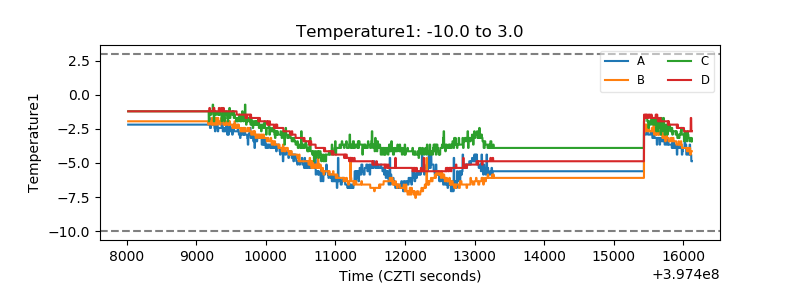 |
| Veto HV Monitor | 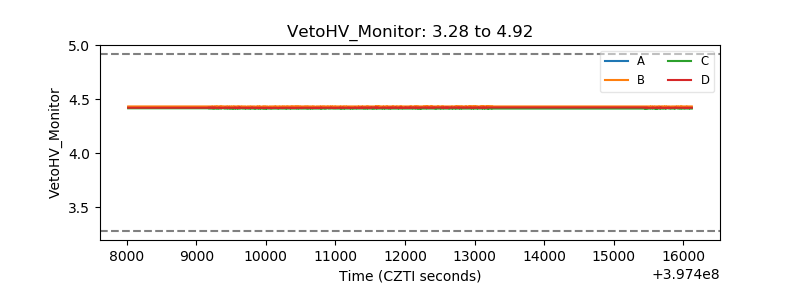 |
| Veto LLD | 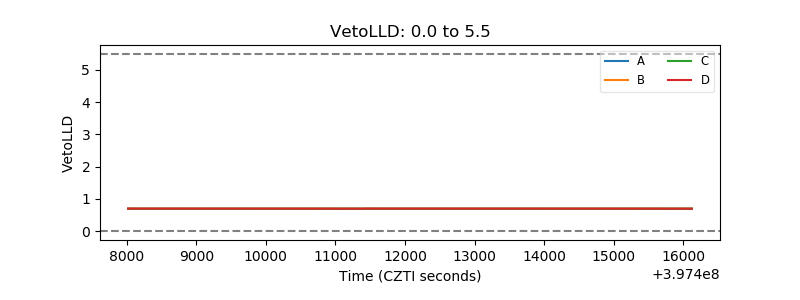 |
| Alpha Counter | 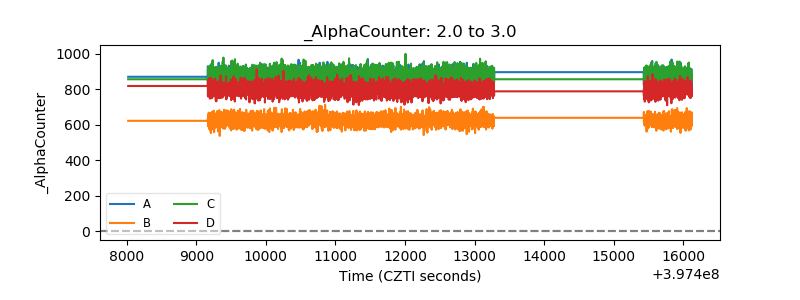 |
| _CPM_Rate | 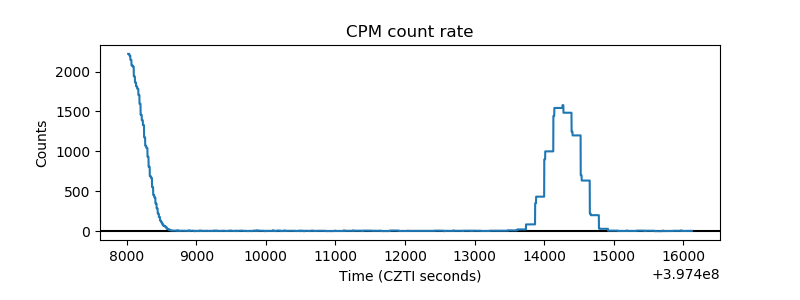 |
| CZT Counter | 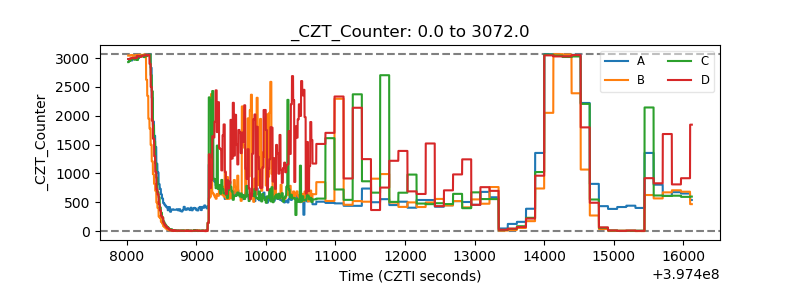 |
| +2.5 Volts monitor | 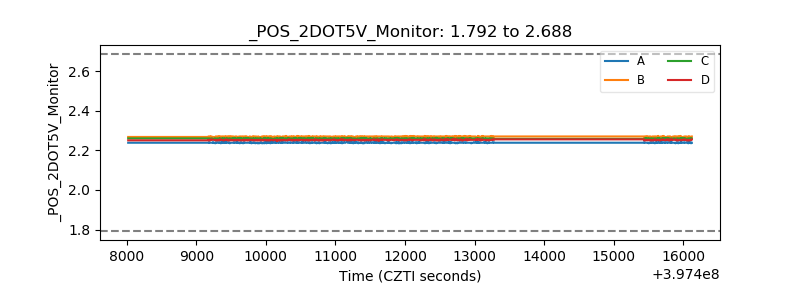 |
| +5 Volts monitor | 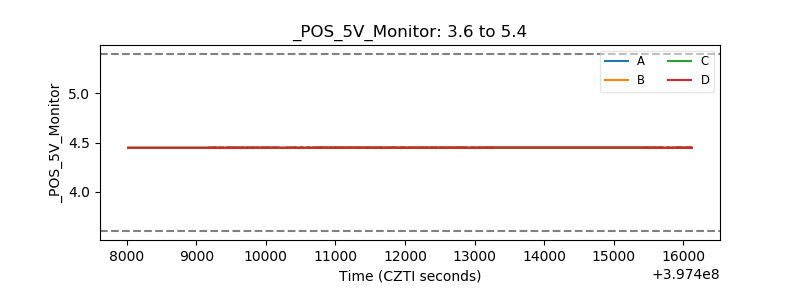 |
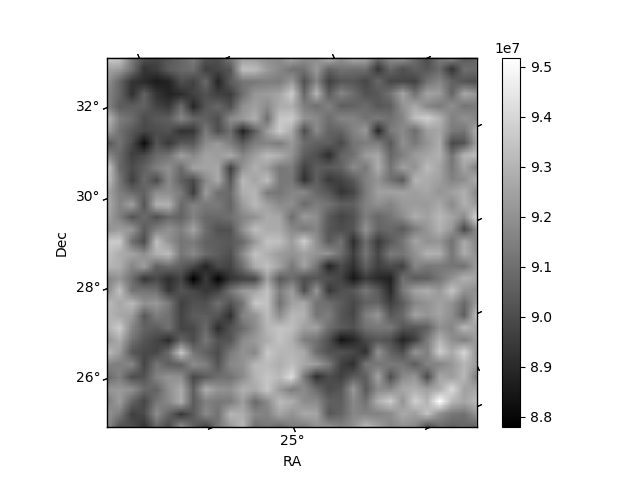
| _ROLL_ROT | 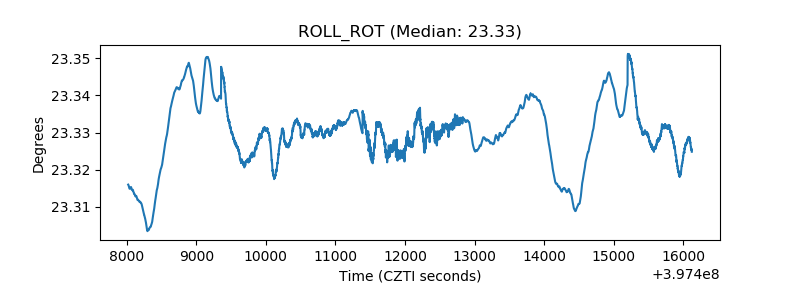 |
| _Roll_DEC | 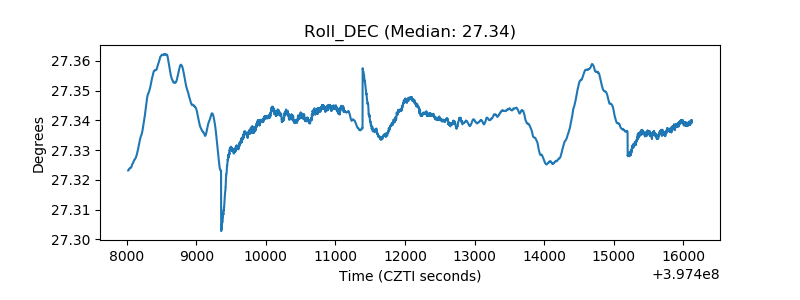 |
| _Roll_RA | 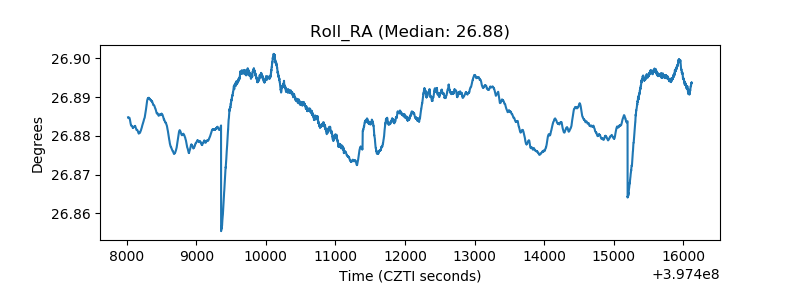 |
| Veto Counter | 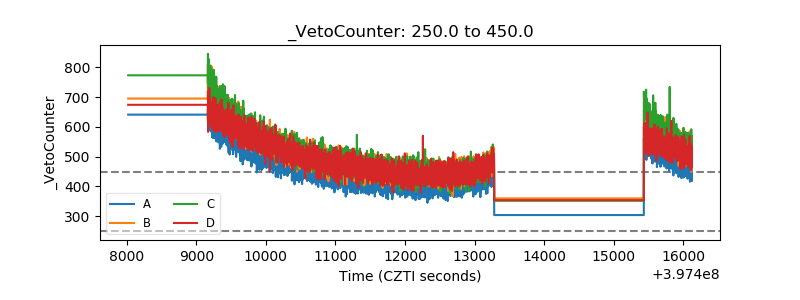 |