| Param | Original file | Final file |
|---|---|---|
| Filename | modeM0/AS1A11_046T02_9000005274_37059cztM0_level2.evt | modeM0/AS1A11_046T02_9000005274_37059cztM0_level2_quad_clean.evt |
| Size (bytes) | 168,557,760 | 20,531,520 |
| Size | 160.7 MB | 19.6 MB |
| Events in quadrant A | 956,505 | 128,878 |
| Events in quadrant B | 1,073,079 | 129,516 |
| Events in quadrant C | 1,069,233 | 126,195 |
| Events in quadrant D | 1,893,356 | 116,658 |
| Mode M9 | |||
|---|---|---|---|
| Quadrant | BADHDUFLAG | Total packets | Discarded packets |
| A | 0 | 15 | 0 |
| B | 0 | 15 | 0 |
| C | 0 | 15 | 0 |
| D | 0 | 16 | 0 |
| Mode SS | |||
|---|---|---|---|
| Quadrant | BADHDUFLAG | Total packets | Discarded packets |
| A | 0 | 32 | 0 |
| B | 0 | 32 | 0 |
| C | 0 | 32 | 0 |
| D | 0 | 32 | 0 |
| Mode M0 | |||
|---|---|---|---|
| Quadrant | BADHDUFLAG | Total packets | Discarded packets |
| A | 0 | 3868 | 1 |
| B | 0 | 4186 | 1 |
| C | 0 | 4231 | 1 |
| D | 0 | 6740 | 1 |
| Quadrant | Total seconds | Saturated seconds | Saturation percentage |
|---|---|---|---|
| A | 1630 | 7 | 0.429448% |
| B | 1630 | 44 | 2.699387% |
| C | 1630 | 43 | 2.638037% |
| D | 1630 | 258 | 15.828221% |
Noise dominated data is calculated using 1-second bins in cleaned event files. If a bin has >2000 counts, and if more than 50% of those come from <1% of pixels, then it is considered to be noise-dominated and hence unusable.
| Quadrant | # 1 sec bins | Bins with >0 counts | Bins with >2000 counts | High rate bins dominated by noise | Noise dominated (total time) | Noise dominated (detector-on time) | Marked lightcurve |
|---|---|---|---|---|---|---|---|
| A | 1630 | 1630 | 3 | 3 | 0.18% | 0.18% | 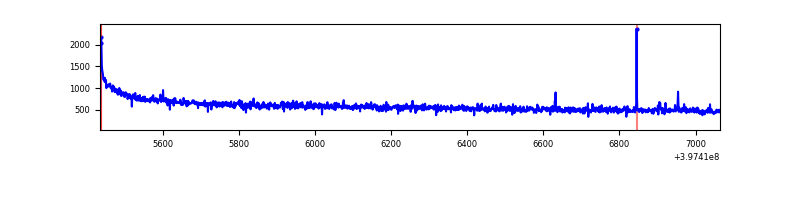 |
| B | 1630 | 1630 | 25 | 25 | 1.53% | 1.53% | 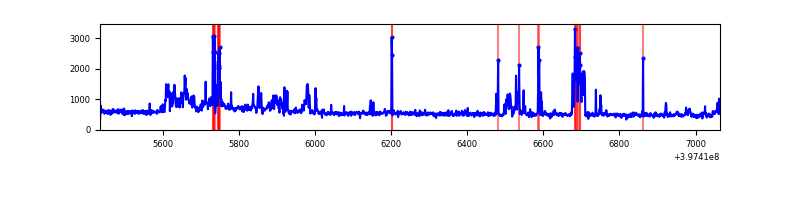 |
| C | 1630 | 1630 | 25 | 25 | 1.53% | 1.53% | 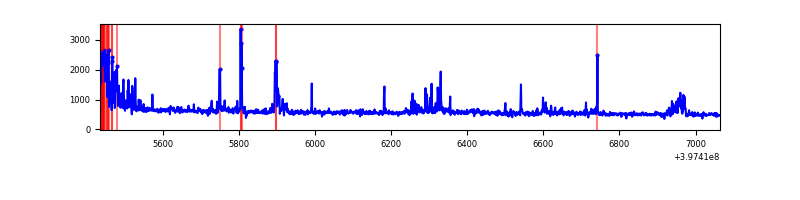 |
| D | 1630 | 1630 | 182 | 182 | 11.17% | 11.17% | 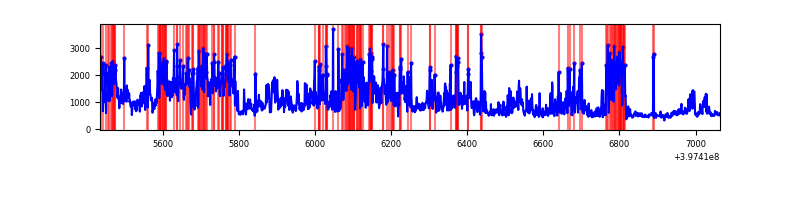 |
Top three noisy pixels from each quadrant. If the there are fewer than three noisy pixels in the level2.evt file, extra rows are filled as -1
| Pixel properties | Quadrant properties | ||||||
|---|---|---|---|---|---|---|---|
| Quadrant | DetID | PixID | Counts | Sigma | Mean | Median | Sigma |
| A | 10 | 83 | 107086 | 2362.64 | 216 | 211 | 45.2 |
| A | 9 | 143 | 7282 | 156.31 | 216 | 211 | 45.2 |
| A | 0 | 230 | 3684 | 76.77 | 216 | 211 | 45.2 |
| B | 5 | 184 | 151220 | 3621.16 | 212 | 207 | 41.7 |
| B | 5 | 172 | 53818 | 1285.54 | 212 | 207 | 41.7 |
| B | 0 | 186 | 12000 | 282.79 | 212 | 207 | 41.7 |
| C | 0 | 10 | 82960 | 1667.95 | 209 | 211 | 49.6 |
| C | 15 | 214 | 71215 | 1431.21 | 209 | 211 | 49.6 |
| C | 1 | 23 | 57638 | 1157.54 | 209 | 211 | 49.6 |
| D | 6 | 112 | 297102 | 5959.43 | 201 | 197 | 49.8 |
| D | 2 | 249 | 219045 | 4392.68 | 201 | 197 | 49.8 |
| D | 1 | 52 | 210155 | 4214.24 | 201 | 197 | 49.8 |
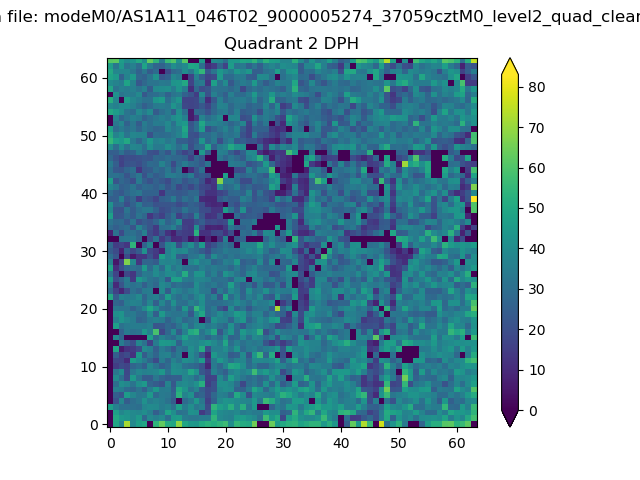
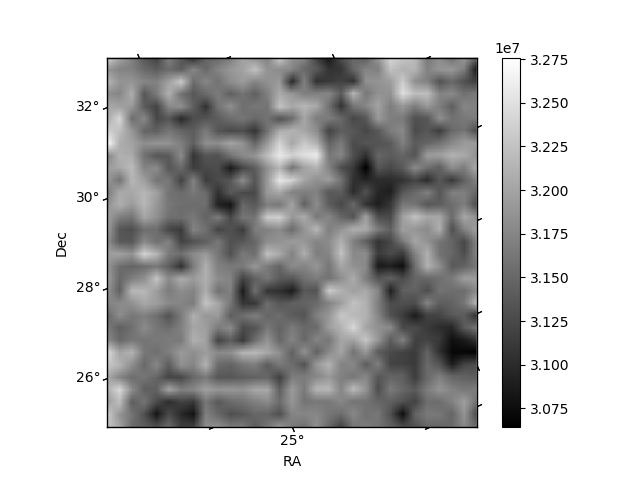
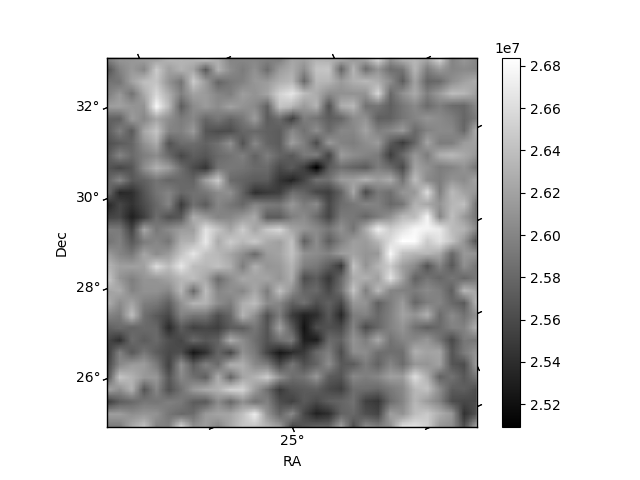
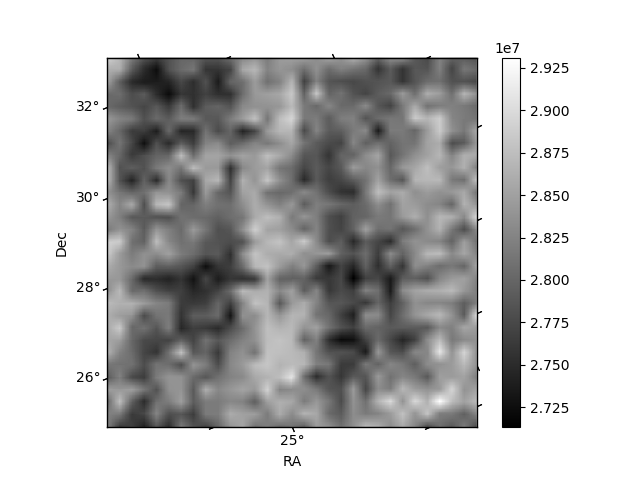
Histogram calculated using DETX and DETY for each event in the final _common_clean file
| Quadrant A |  |
 |
Quadrant B |
|---|---|---|---|
| Quadrant D | 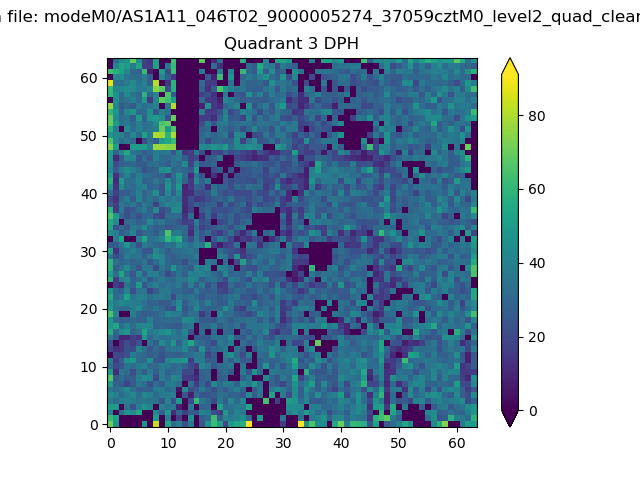 |
 |
Quadrant C |
| Plot type | Count rate plots | Images |
|---|---|---|
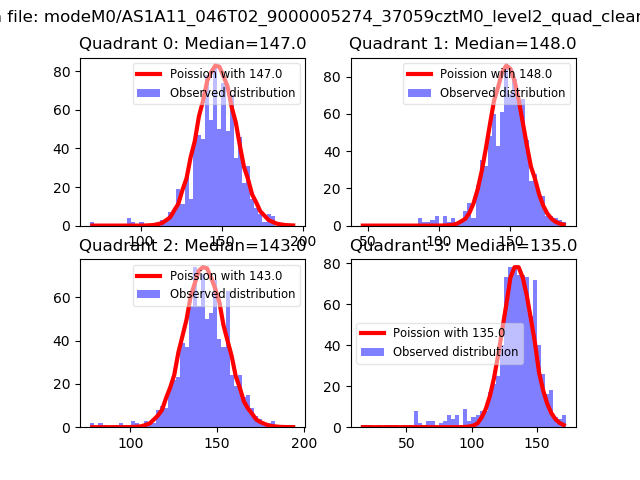
| Comparison with Poisson distribution Blue bars denote a histogram of data divided into 1 sec bins. Red curve is a Poisson curve with rate = median count rate of data. |
 |
 |
| Quadrant-wise count rates Data is divided into 100 sec bins |
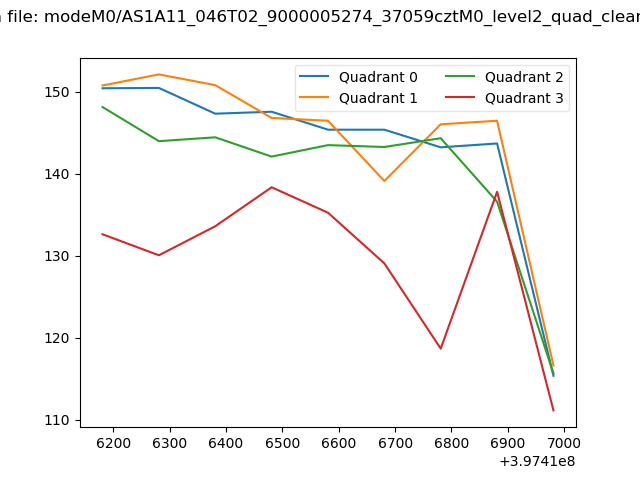 |
|
| Module-wise count rates for Quadrant A Data is divided into 100 sec bins |
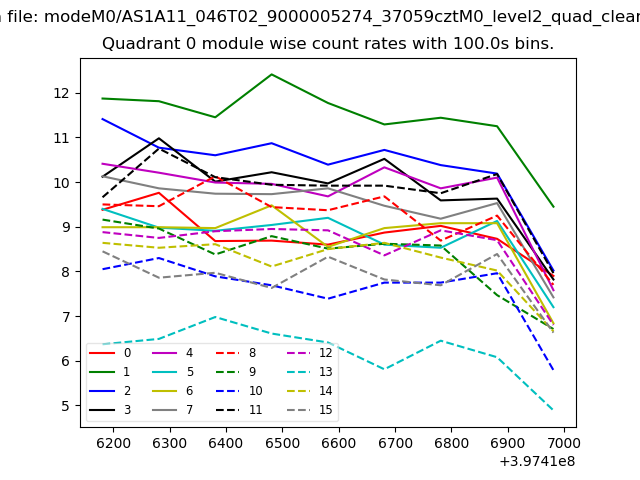 |
 |
| Module-wise count rates for Quadrant B Data is divided into 100 sec bins |
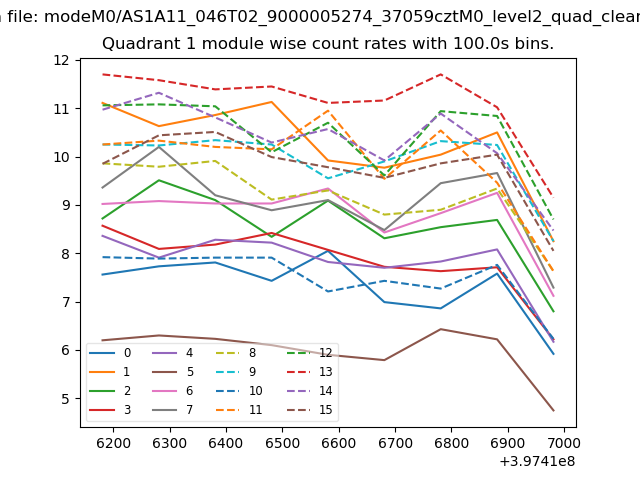 |
 |
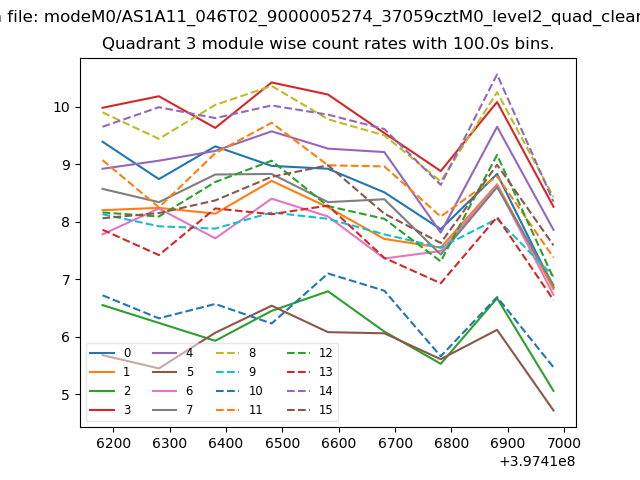
| Module-wise count rates for Quadrant C Data is divided into 100 sec bins |
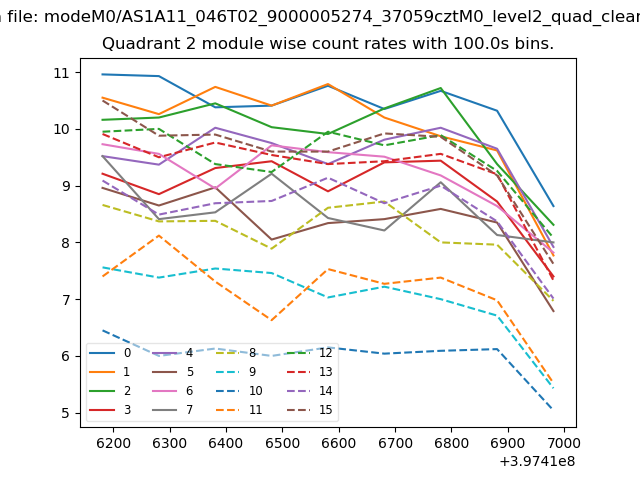 |
 |
| Module-wise count rates for Quadrant D Data is divided into 100 sec bins |
 |
 |
| Parameter | Plot |
|---|---|
| CZT HV Monitor | 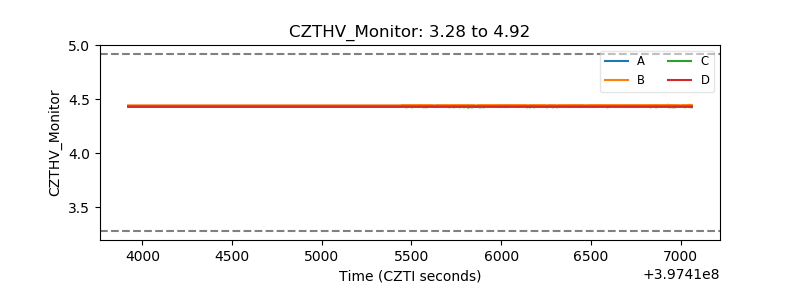 |
| D_VDD | 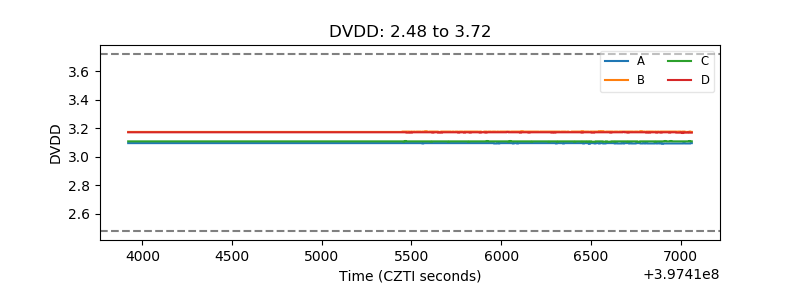 |
| Temperature 1 | 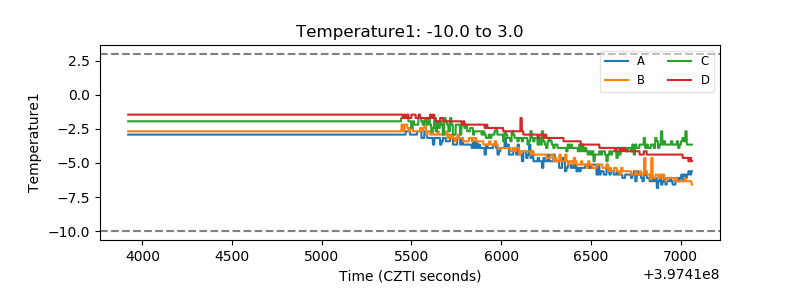 |
| Veto HV Monitor | 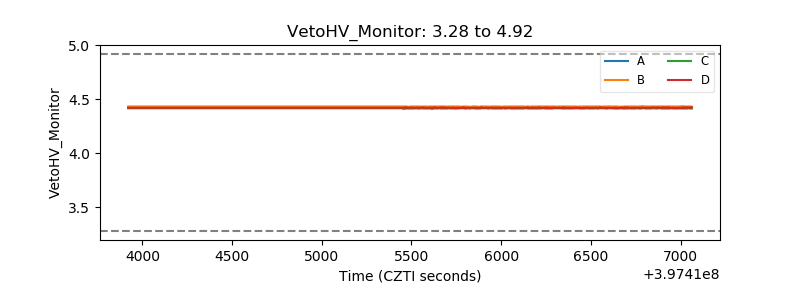 |
| Veto LLD | 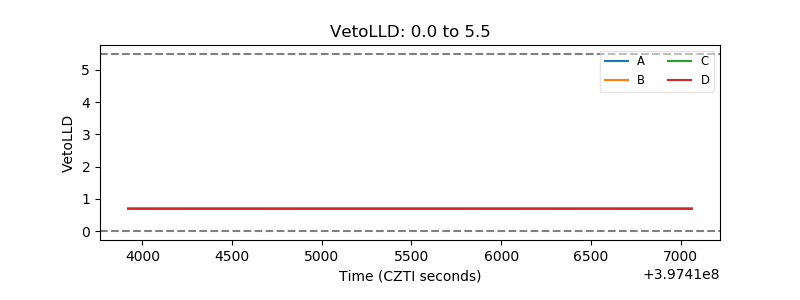 |
| Alpha Counter | 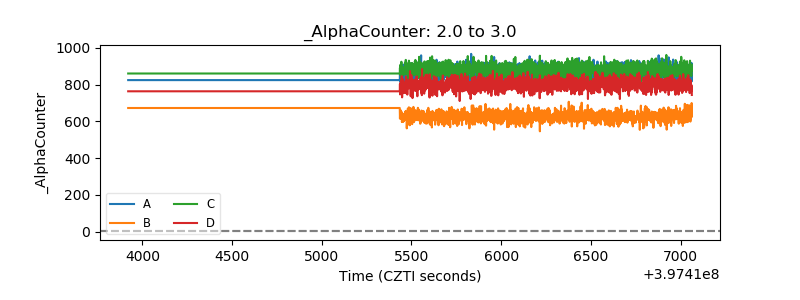 |
| _CPM_Rate | 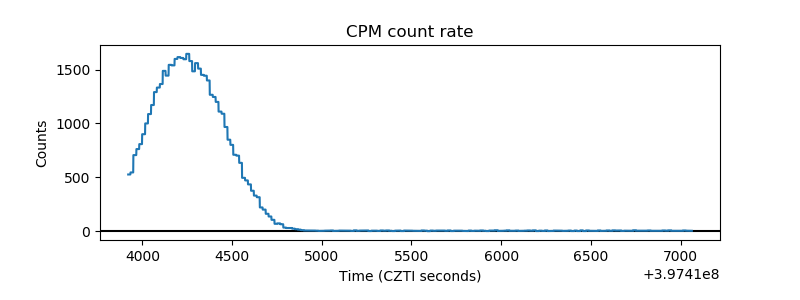 |
| CZT Counter | 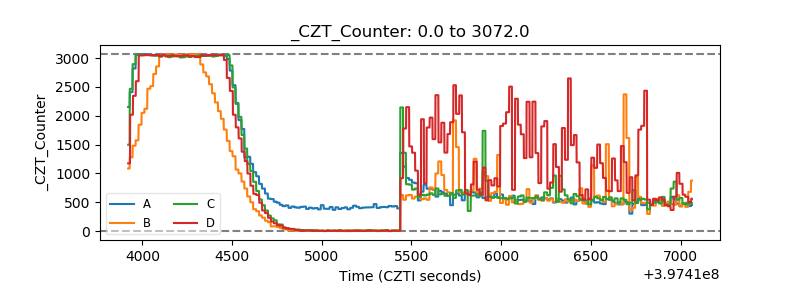 |
| +2.5 Volts monitor | 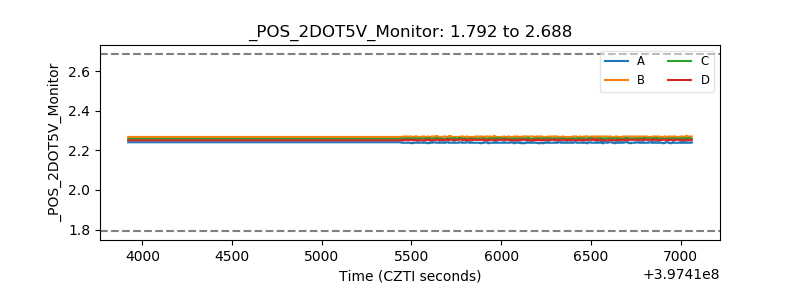 |
| +5 Volts monitor | 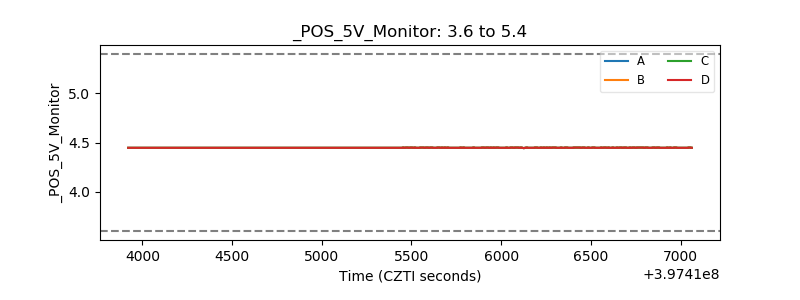 |
| _ROLL_ROT | 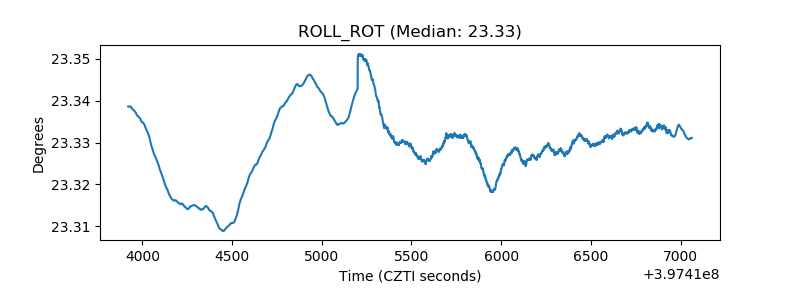 |
| _Roll_DEC | 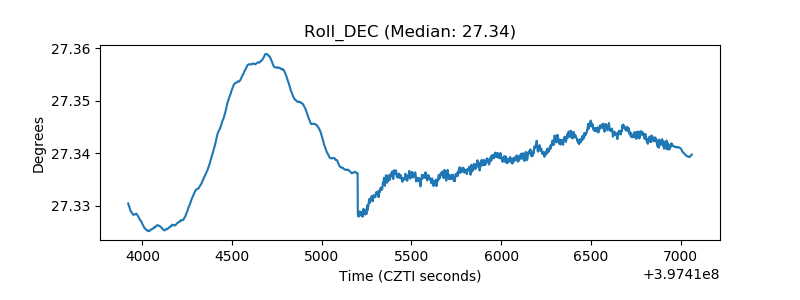 |
| _Roll_RA | 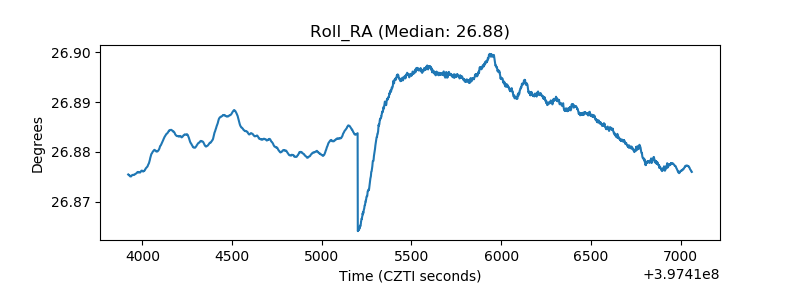 |
| Veto Counter | 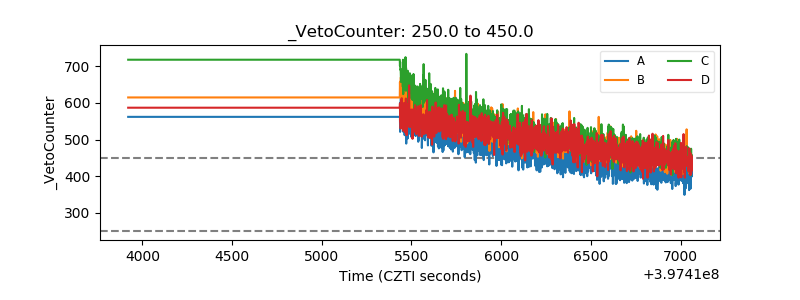 |