| Param | Original file | Final file |
|---|---|---|
| Filename | modeM0/AS1A11_083T04_9000005272cztM0_level2.fits | modeM0/AS1A11_083T04_9000005272cztM0_level2_quad_clean.evt |
| Size (bytes) | 184,423,680 | 207,423,360 |
| Size | 175.9 MB | 197.8 MB |
| Events in quadrant A | 1,145,934 | 1,325,694 |
| Events in quadrant B | 1,086,002 | 1,309,553 |
| Events in quadrant C | 1,104,072 | 1,227,886 |
| Events in quadrant D | 917,204 | 1,087,067 |
| Mode M9 | |||
|---|---|---|---|
| Quadrant | BADHDUFLAG | Total packets | Discarded packets |
| A | 0 | 96 | 0 |
| B | 0 | 96 | 0 |
| C | 0 | 96 | 0 |
| D | 0 | 96 | 0 |
| Mode SS | |||
|---|---|---|---|
| Quadrant | BADHDUFLAG | Total packets | Discarded packets |
| A | 0 | 394 | 0 |
| B | 0 | 394 | 0 |
| C | 0 | 394 | 0 |
| D | 0 | 394 | 0 |
| Mode M0 | |||
|---|---|---|---|
| Quadrant | BADHDUFLAG | Total packets | Discarded packets |
| A | 0 | 41646 | 0 |
| B | 0 | 48968 | 0 |
| C | 0 | 52754 | 0 |
| D | 0 | 62111 | 0 |
| Quadrant | Total seconds | Saturated seconds | Saturation percentage |
|---|---|---|---|
| A | 19330 | 55 | 0.284532% |
| B | 19330 | 565 | 2.922918% |
| C | 19330 | 571 | 2.953958% |
| D | 19330 | 2299 | 11.893430% |
Noise dominated data is calculated using 1-second bins in cleaned event files. If a bin has >2000 counts, and if more than 50% of those come from <1% of pixels, then it is considered to be noise-dominated and hence unusable.
| Quadrant | # 1 sec bins | Bins with >0 counts | Bins with >2000 counts | High rate bins dominated by noise | Noise dominated (total time) | Noise dominated (detector-on time) | Marked lightcurve |
|---|---|---|---|---|---|---|---|
| A | 28834 | 19330 | 0 | 0 | 0.00% | 0.00% | 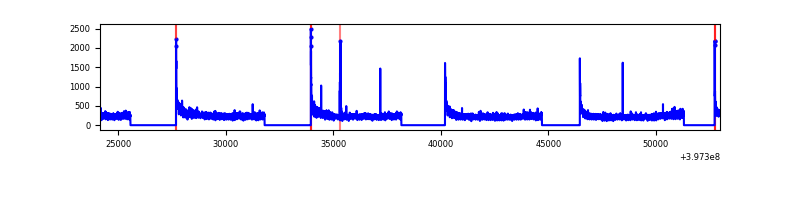 |
| B | 28834 | 19329 | 0 | 0 | 0.00% | 0.00% |  |
| C | 28834 | 19326 | 0 | 0 | 0.00% | 0.00% |  |
| D | 28834 | 19282 | 0 | 0 | 0.00% | 0.00% |  |
Top three noisy pixels from each quadrant. If the there are fewer than three noisy pixels in the level2.evt file, extra rows are filled as -1
| Pixel properties | Quadrant properties | ||||||
|---|---|---|---|---|---|---|---|
| Quadrant | DetID | PixID | Counts | Sigma | Mean | Median | Sigma |
| A | 7 | 110 | 946 | 8.82 | 299 | 282 | 75.3 |
| A | 0 | 29 | 930 | 8.61 | 299 | 282 | 75.3 |
| A | 9 | 19 | 912 | 8.37 | 299 | 282 | 75.3 |
| B | 2 | 9 | 938 | 11.21 | 287 | 274 | 59.2 |
| B | 3 | 80 | 792 | 8.75 | 287 | 274 | 59.2 |
| B | 2 | 8 | 782 | 8.58 | 287 | 274 | 59.2 |
| C | 1 | 81 | 892 | 8.02 | 292 | 276 | 76.8 |
| C | 1 | 80 | 892 | 8.02 | 292 | 276 | 76.8 |
| C | 3 | 203 | 827 | 7.17 | 292 | 276 | 76.8 |
| D | 10 | 113 | 717 | 6.65 | 263 | 240 | 71.7 |
| D | 4 | 160 | 714 | 6.61 | 263 | 240 | 71.7 |
| D | 6 | 62 | 673 | 6.04 | 263 | 240 | 71.7 |
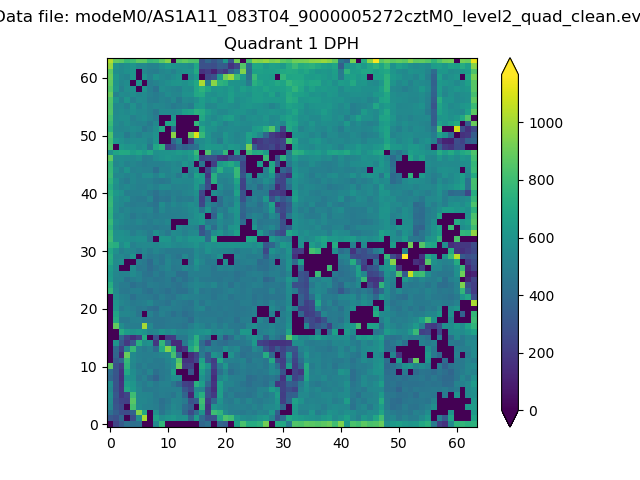
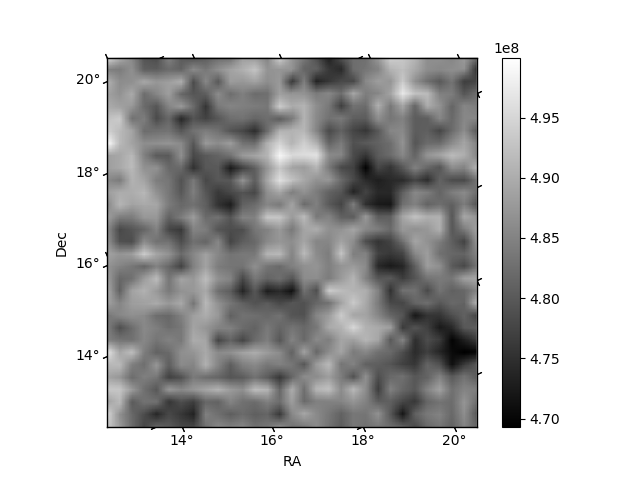
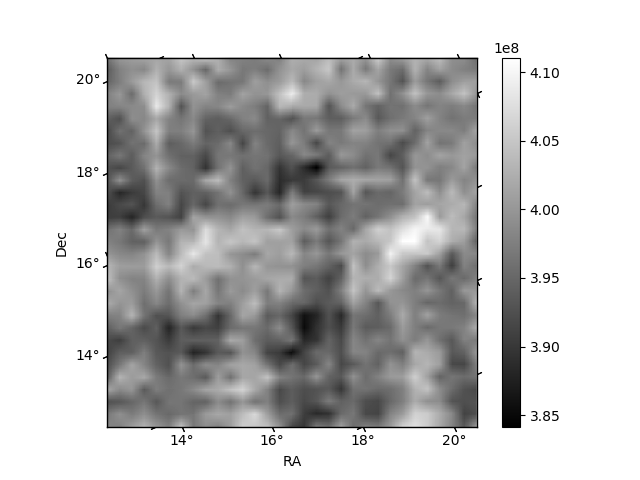
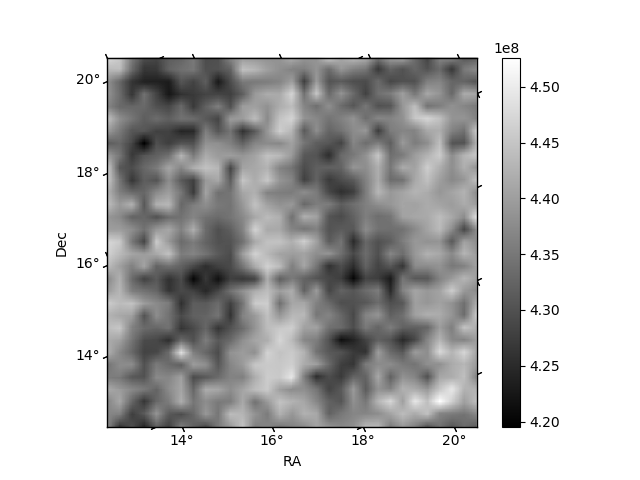
Histogram calculated using DETX and DETY for each event in the final _common_clean file
| Quadrant A |  |
 |
Quadrant B |
|---|---|---|---|
| Quadrant D | 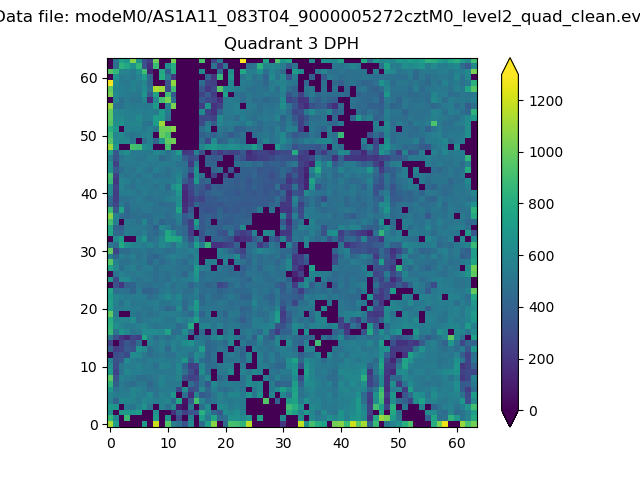 |
 |
Quadrant C |
| Plot type | Count rate plots | Images |
|---|---|---|
| Comparison with Poisson distribution Blue bars denote a histogram of data divided into 1 sec bins. Red curve is a Poisson curve with rate = median count rate of data. |
 |
 |
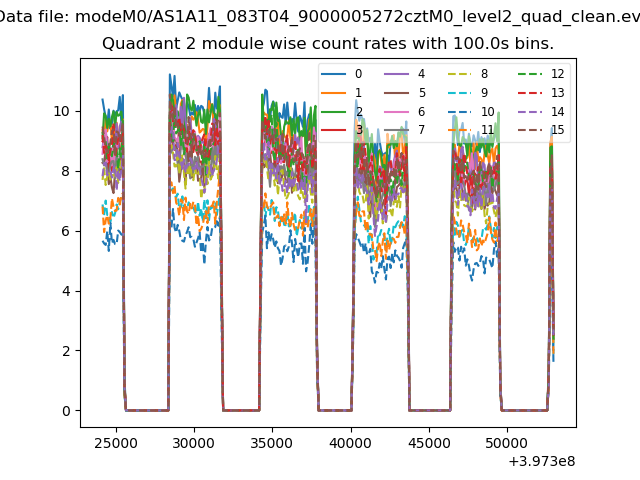
| Quadrant-wise count rates Data is divided into 100 sec bins |
 |
|
| Module-wise count rates for Quadrant A Data is divided into 100 sec bins |
 |
 |
| Module-wise count rates for Quadrant B Data is divided into 100 sec bins |
 |
 |
| Module-wise count rates for Quadrant C Data is divided into 100 sec bins |
 |
 |
| Module-wise count rates for Quadrant D Data is divided into 100 sec bins |
 |
 |
| Parameter | Plot |
|---|---|
| CZT HV Monitor | 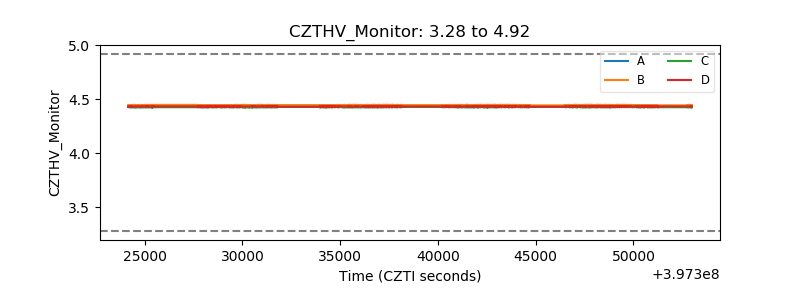 |
| D_VDD | 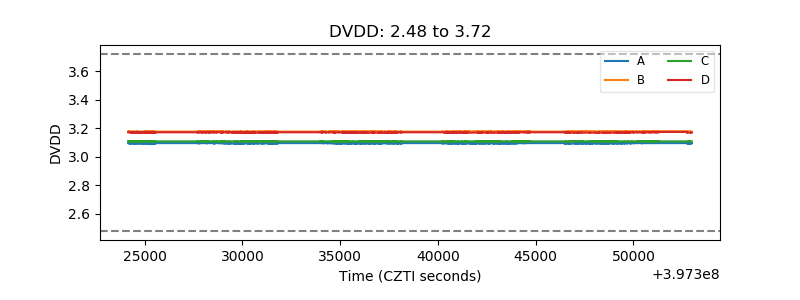 |
| Temperature 1 |  |
| Veto HV Monitor |  |
| Veto LLD |  |
| Alpha Counter |  |
| _CPM_Rate | 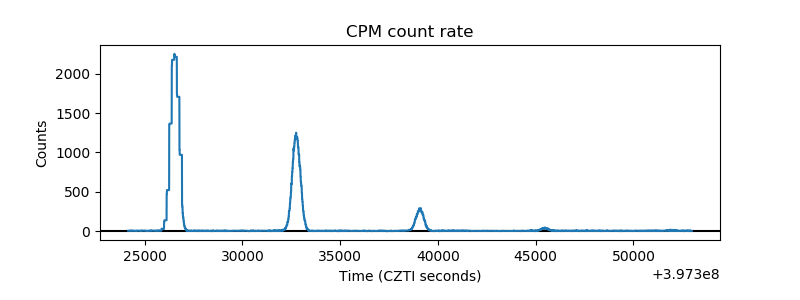 |
| CZT Counter |  |
| +2.5 Volts monitor | 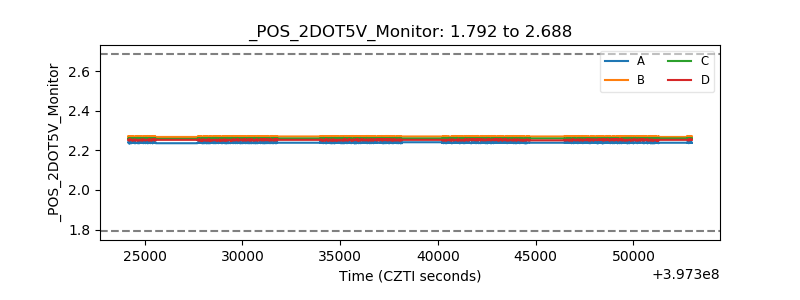 |
| +5 Volts monitor | 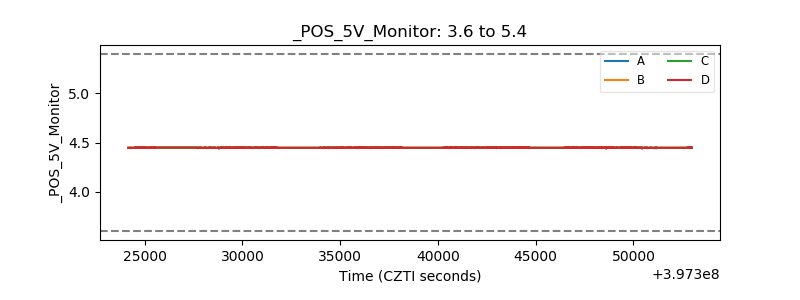 |
| _ROLL_ROT |  |
| _Roll_DEC |  |
| _Roll_RA |  |
| Veto Counter |  |