| Param | Original file | Final file |
|---|---|---|
| Filename | modeM0/AS1A11_083T04_9000005272_37043cztM0_level2.evt | modeM0/AS1A11_083T04_9000005272_37043cztM0_level2_quad_clean.evt |
| Size (bytes) | 187,853,760 | 31,000,320 |
| Size | 179.2 MB | 29.6 MB |
| Events in quadrant A | 1,260,349 | 198,394 |
| Events in quadrant B | 1,432,901 | 200,591 |
| Events in quadrant C | 1,511,343 | 192,421 |
| Events in quadrant D | 1,332,751 | 187,455 |
| Mode M9 | |||
|---|---|---|---|
| Quadrant | BADHDUFLAG | Total packets | Discarded packets |
| A | 0 | 21 | 0 |
| B | 0 | 21 | 0 |
| C | 0 | 21 | 0 |
| D | 0 | 21 | 0 |
| Mode SS | |||
|---|---|---|---|
| Quadrant | BADHDUFLAG | Total packets | Discarded packets |
| A | 0 | 46 | 0 |
| B | 0 | 46 | 0 |
| C | 0 | 46 | 0 |
| D | 0 | 46 | 0 |
| Mode M0 | |||
|---|---|---|---|
| Quadrant | BADHDUFLAG | Total packets | Discarded packets |
| A | 0 | 5114 | 2 |
| B | 0 | 5717 | 1 |
| C | 0 | 5990 | 1 |
| D | 0 | 5402 | 1 |
| Quadrant | Total seconds | Saturated seconds | Saturation percentage |
|---|---|---|---|
| A | 2205 | 19 | 0.861678% |
| B | 2205 | 55 | 2.494331% |
| C | 2205 | 44 | 1.995465% |
| D | 2205 | 26 | 1.179138% |
Noise dominated data is calculated using 1-second bins in cleaned event files. If a bin has >2000 counts, and if more than 50% of those come from <1% of pixels, then it is considered to be noise-dominated and hence unusable.
| Quadrant | # 1 sec bins | Bins with >0 counts | Bins with >2000 counts | High rate bins dominated by noise | Noise dominated (total time) | Noise dominated (detector-on time) | Marked lightcurve |
|---|---|---|---|---|---|---|---|
| A | 4328 | 2206 | 8 | 8 | 0.18% | 0.36% | 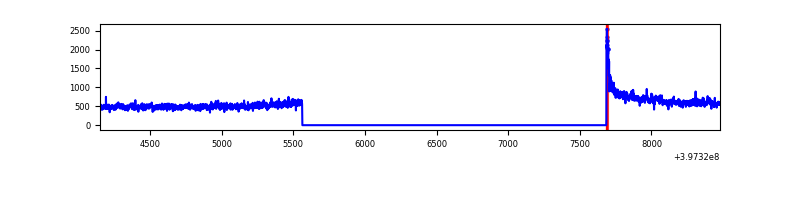 |
| B | 4328 | 2206 | 28 | 28 | 0.65% | 1.27% | 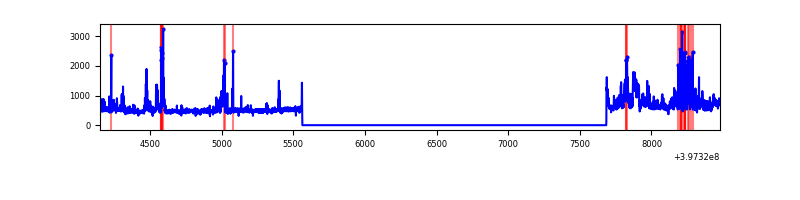 |
| C | 4328 | 2206 | 39 | 39 | 0.90% | 1.77% | 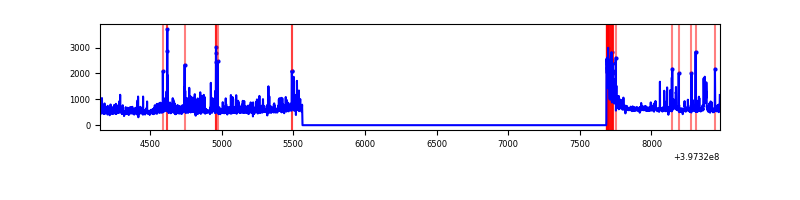 |
| D | 4328 | 2206 | 21 | 21 | 0.49% | 0.95% | 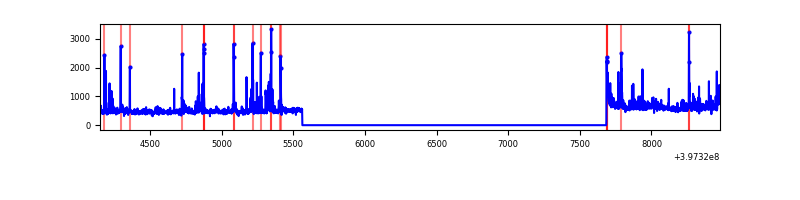 |
Top three noisy pixels from each quadrant. If the there are fewer than three noisy pixels in the level2.evt file, extra rows are filled as -1
| Pixel properties | Quadrant properties | ||||||
|---|---|---|---|---|---|---|---|
| Quadrant | DetID | PixID | Counts | Sigma | Mean | Median | Sigma |
| A | 10 | 83 | 116507 | 1995.88 | 281 | 277 | 58.2 |
| A | 11 | 254 | 51309 | 876.31 | 281 | 277 | 58.2 |
| A | 13 | 254 | 3212 | 50.4 | 281 | 277 | 58.2 |
| B | 0 | 213 | 67937 | 1236.45 | 279 | 273 | 54.7 |
| B | 4 | 81 | 58750 | 1068.57 | 279 | 273 | 54.7 |
| B | 5 | 184 | 58286 | 1060.1 | 279 | 273 | 54.7 |
| C | 0 | 10 | 227478 | 3535.48 | 271 | 273 | 64.3 |
| C | 14 | 254 | 95219 | 1477.43 | 271 | 273 | 64.3 |
| C | 15 | 214 | 95075 | 1475.19 | 271 | 273 | 64.3 |
| D | 2 | 250 | 118173 | 1733.86 | 273 | 265 | 68.0 |
| D | 12 | 233 | 51386 | 751.74 | 273 | 265 | 68.0 |
| D | 12 | 235 | 45483 | 664.94 | 273 | 265 | 68.0 |
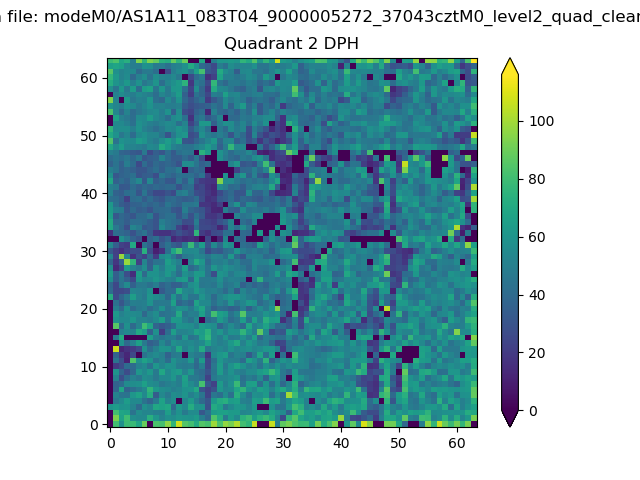
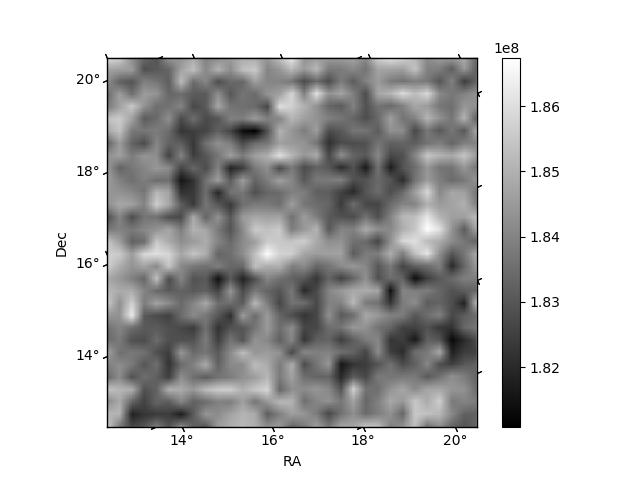
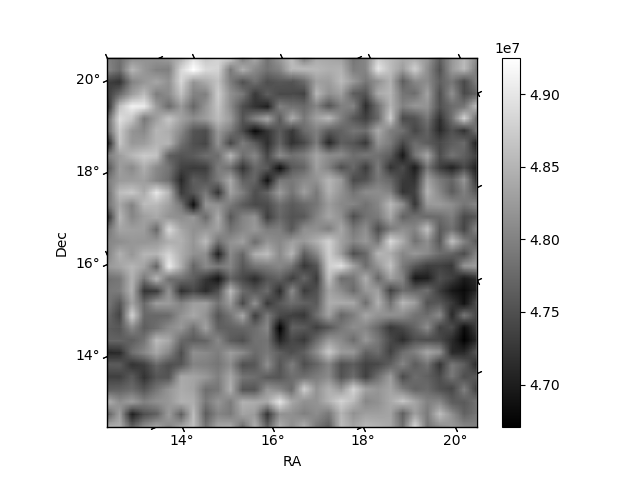
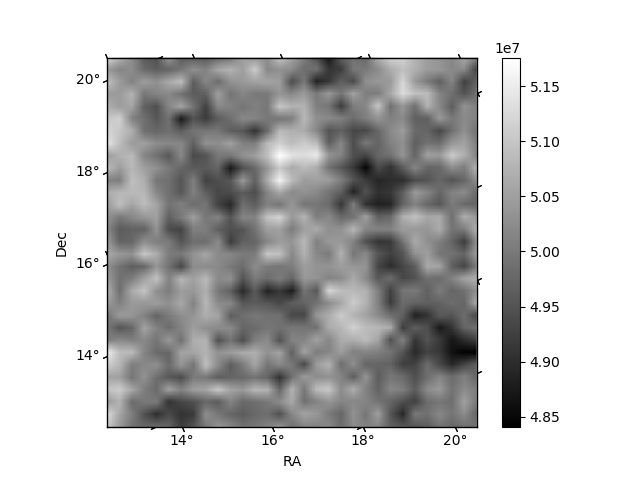
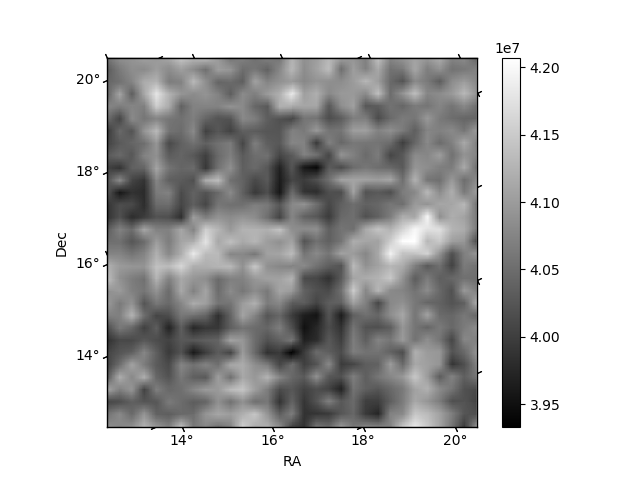
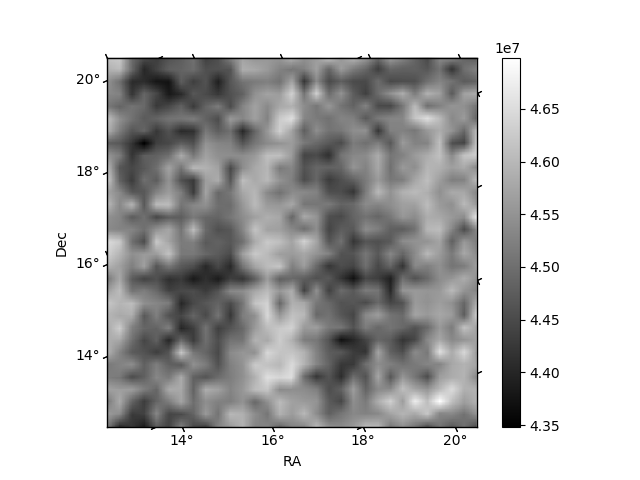
Histogram calculated using DETX and DETY for each event in the final _common_clean file
| Quadrant A | 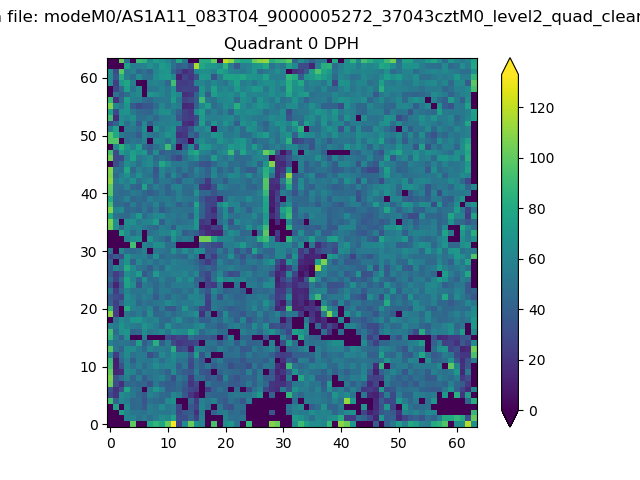 |
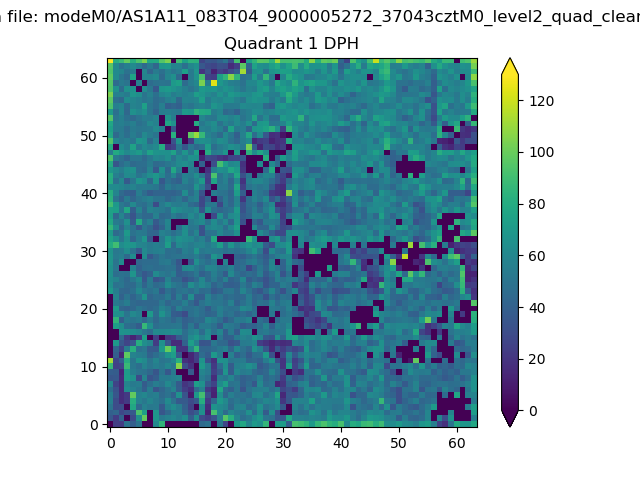 |
Quadrant B |
|---|---|---|---|
| Quadrant D | 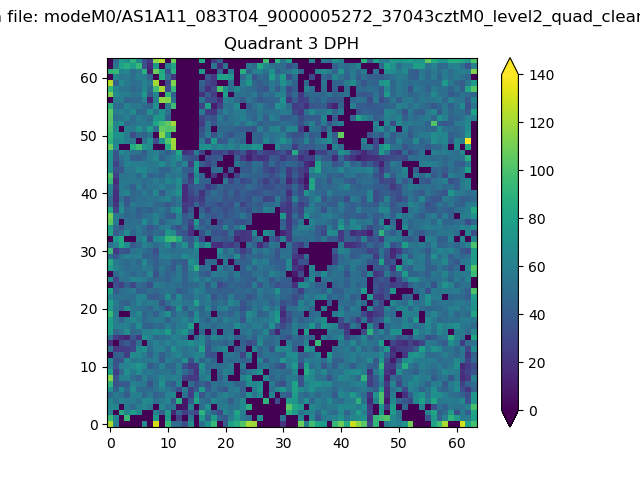 |
 |
Quadrant C |
| Plot type | Count rate plots | Images |
|---|---|---|
| Comparison with Poisson distribution Blue bars denote a histogram of data divided into 1 sec bins. Red curve is a Poisson curve with rate = median count rate of data. |
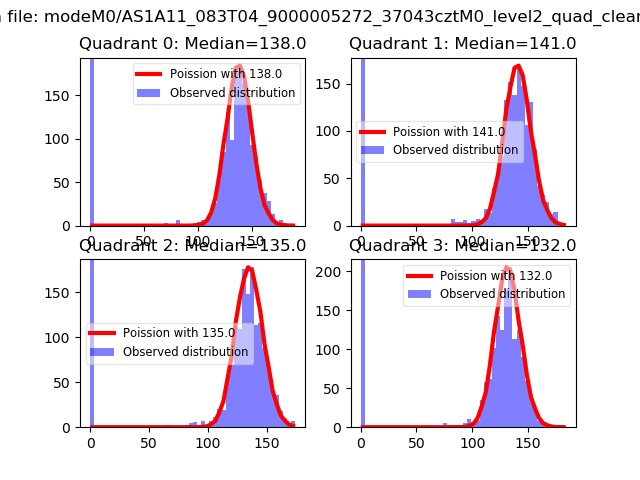 |
 |
| Quadrant-wise count rates Data is divided into 100 sec bins |
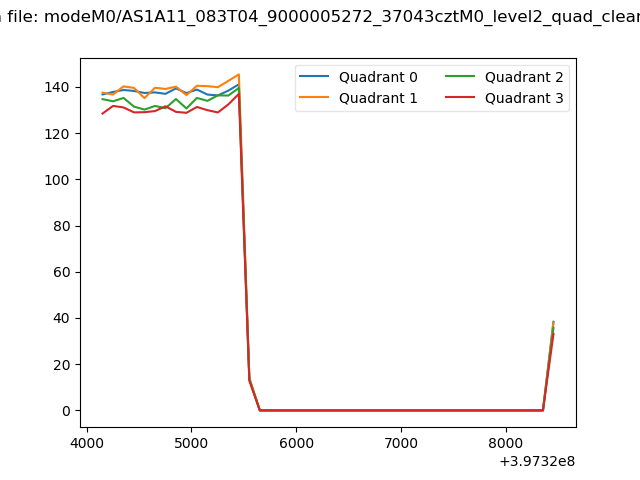 |
|
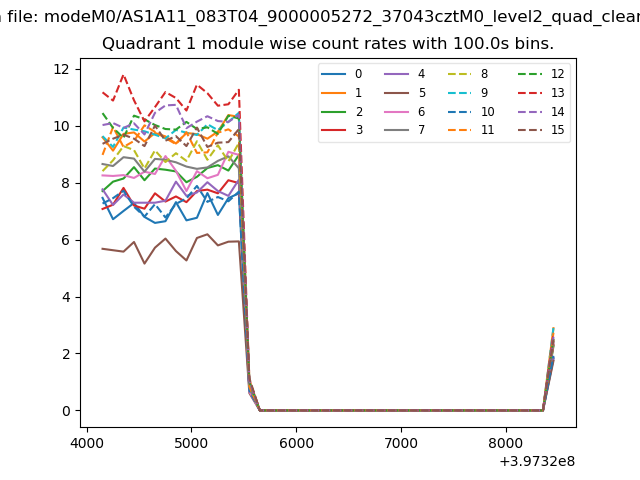
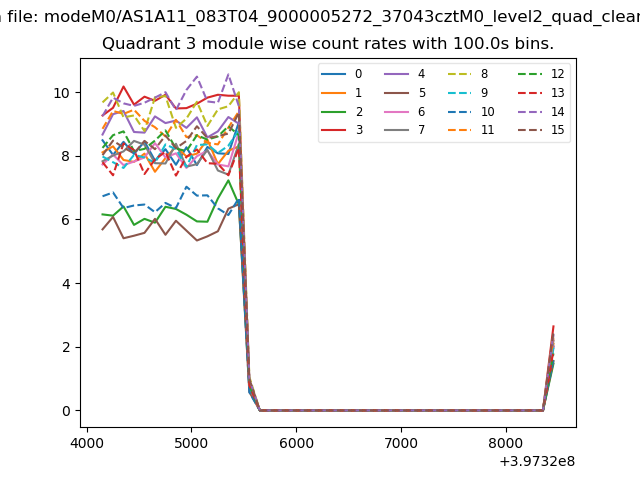
| Module-wise count rates for Quadrant A Data is divided into 100 sec bins |
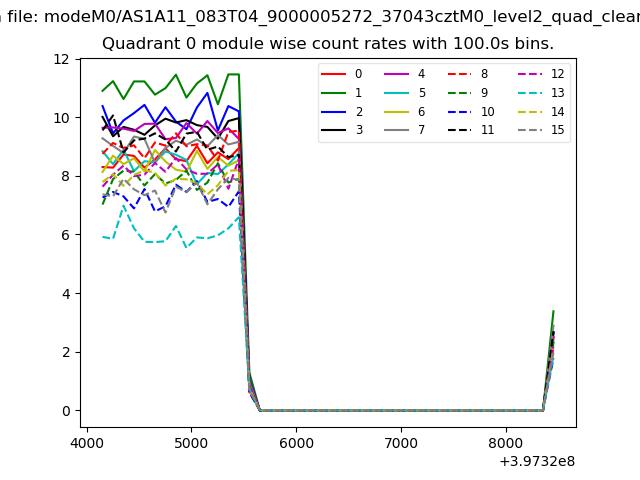 |
 |
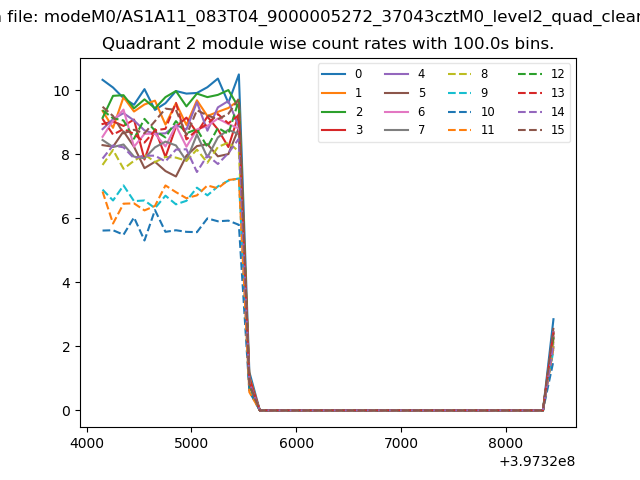
| Module-wise count rates for Quadrant B Data is divided into 100 sec bins |
 |
 |
| Module-wise count rates for Quadrant C Data is divided into 100 sec bins |
 |
 |
| Module-wise count rates for Quadrant D Data is divided into 100 sec bins |
 |
 |
| Parameter | Plot |
|---|---|
| CZT HV Monitor | 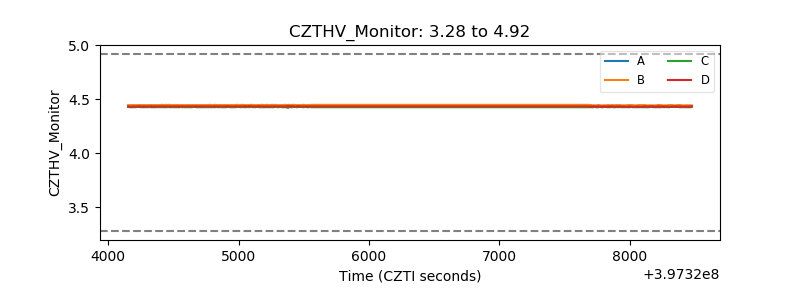 |
| D_VDD | 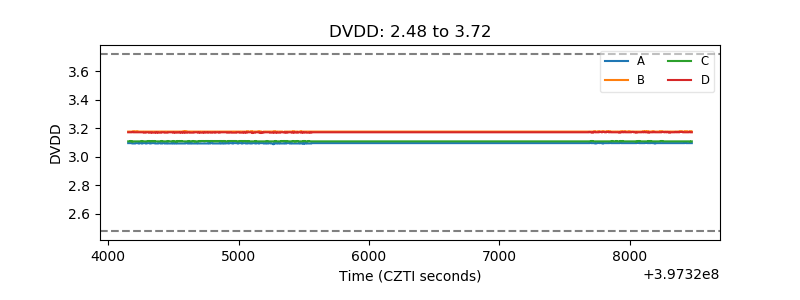 |
| Temperature 1 | 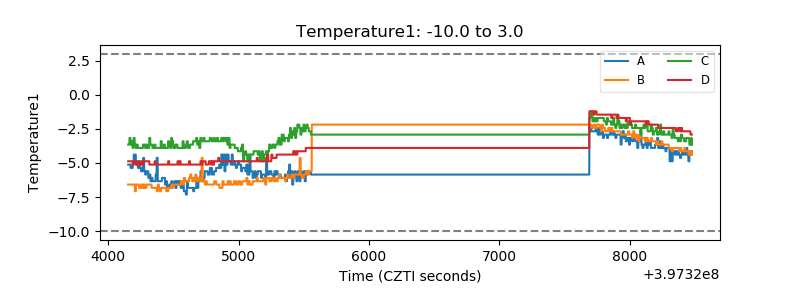 |
| Veto HV Monitor | 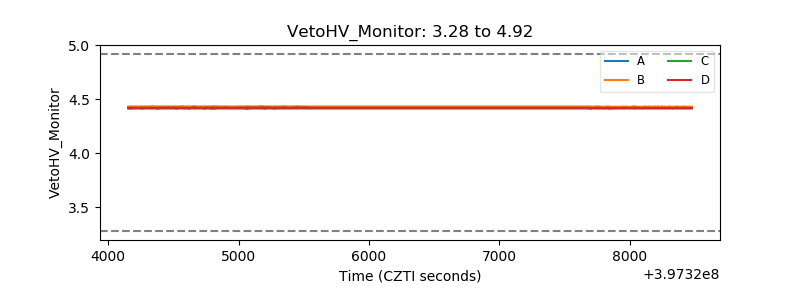 |
| Veto LLD | 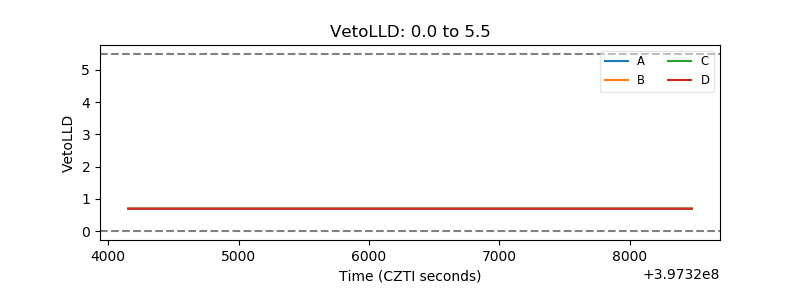 |
| Alpha Counter | 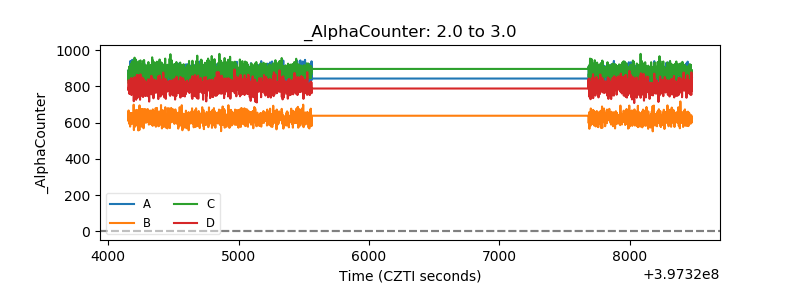 |
| _CPM_Rate | 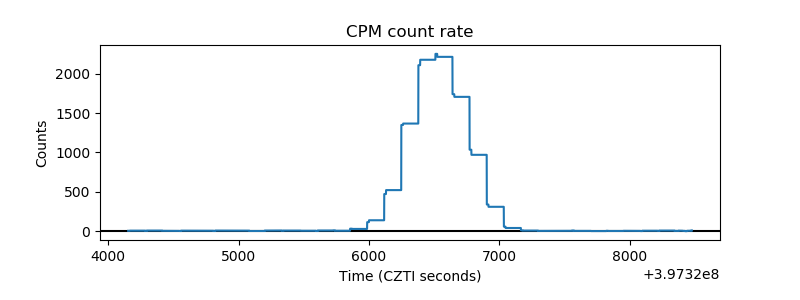 |
| CZT Counter | 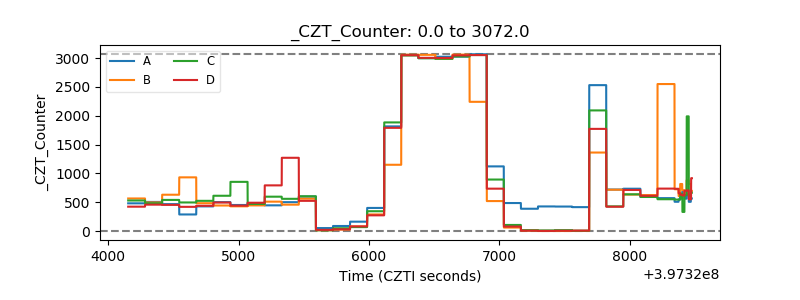 |
| +2.5 Volts monitor | 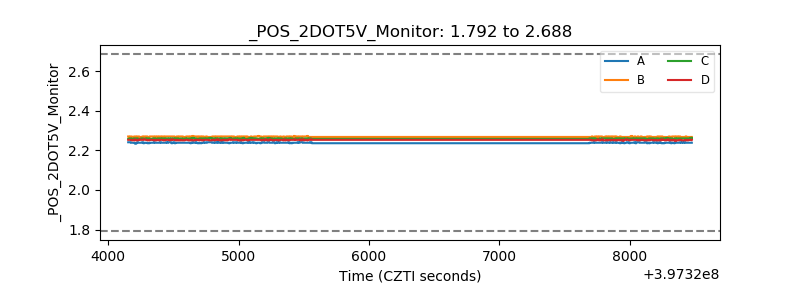 |
| +5 Volts monitor | 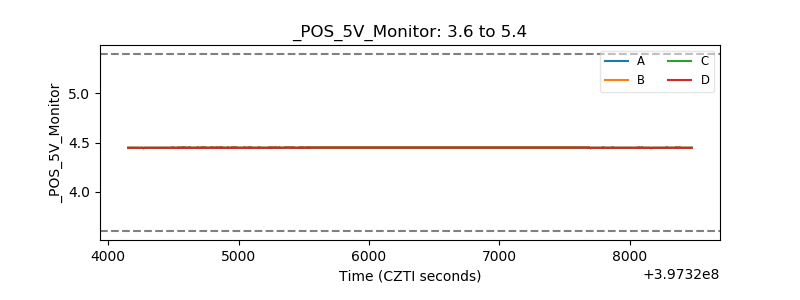 |
| _ROLL_ROT | 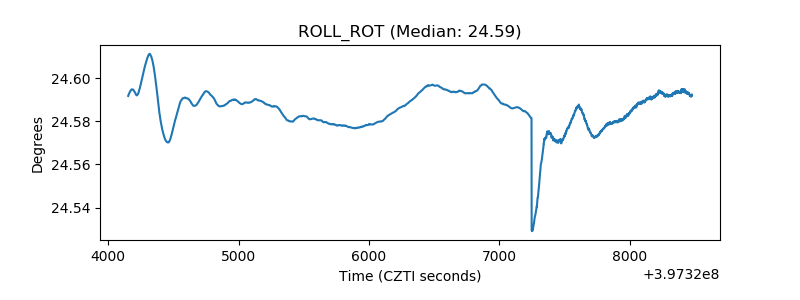 |
| _Roll_DEC | 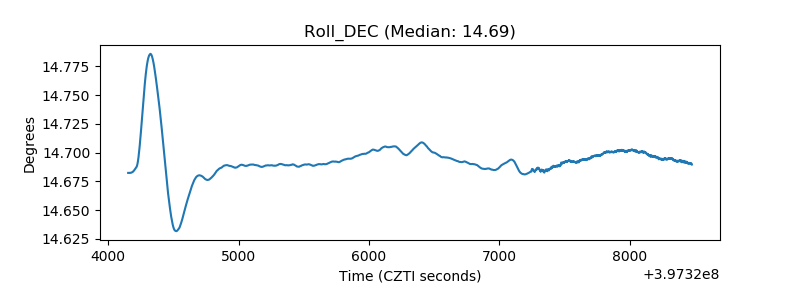 |
| _Roll_RA | 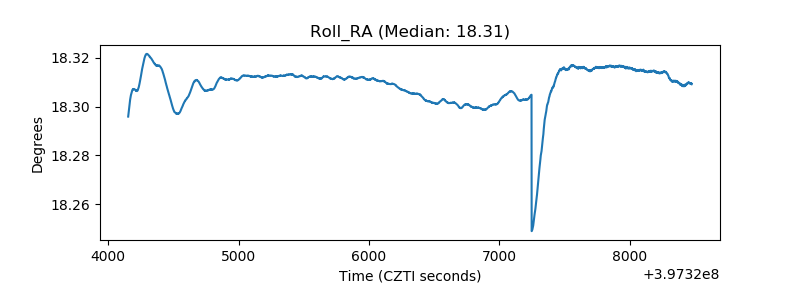 |
| Veto Counter | 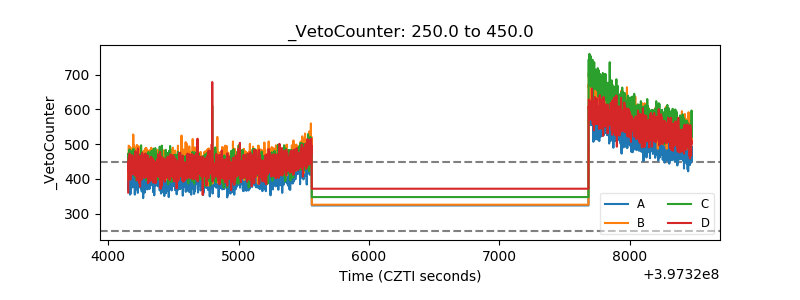 |