| Param | Original file | Final file |
|---|---|---|
| Filename | modeM0/AS1A11_083T04_9000005272_37044cztM0_level2.evt | modeM0/AS1A11_083T04_9000005272_37044cztM0_level2_quad_clean.evt |
| Size (bytes) | 426,150,720 | 80,150,400 |
| Size | 406.4 MB | 76.4 MB |
| Events in quadrant A | 2,736,528 | 532,272 |
| Events in quadrant B | 3,490,001 | 530,529 |
| Events in quadrant C | 3,377,680 | 521,552 |
| Events in quadrant D | 2,968,539 | 498,510 |
| Mode M9 | |||
|---|---|---|---|
| Quadrant | BADHDUFLAG | Total packets | Discarded packets |
| A | 0 | 23 | 0 |
| B | 0 | 23 | 0 |
| C | 0 | 23 | 0 |
| D | 0 | 24 | 0 |
| Mode SS | |||
|---|---|---|---|
| Quadrant | BADHDUFLAG | Total packets | Discarded packets |
| A | 0 | 100 | 0 |
| B | 0 | 100 | 0 |
| C | 0 | 100 | 0 |
| D | 0 | 100 | 0 |
| Mode M0 | |||
|---|---|---|---|
| Quadrant | BADHDUFLAG | Total packets | Discarded packets |
| A | 0 | 11181 | 3 |
| B | 0 | 13676 | 2 |
| C | 0 | 13199 | 2 |
| D | 0 | 12083 | 2 |
| Quadrant | Total seconds | Saturated seconds | Saturation percentage |
|---|---|---|---|
| A | 4909 | 32 | 0.651864% |
| B | 4909 | 161 | 3.279690% |
| C | 4909 | 141 | 2.872275% |
| D | 4909 | 54 | 1.100020% |
Noise dominated data is calculated using 1-second bins in cleaned event files. If a bin has >2000 counts, and if more than 50% of those come from <1% of pixels, then it is considered to be noise-dominated and hence unusable.
| Quadrant | # 1 sec bins | Bins with >0 counts | Bins with >2000 counts | High rate bins dominated by noise | Noise dominated (total time) | Noise dominated (detector-on time) | Marked lightcurve |
|---|---|---|---|---|---|---|---|
| A | 7062 | 4910 | 15 | 15 | 0.21% | 0.31% | 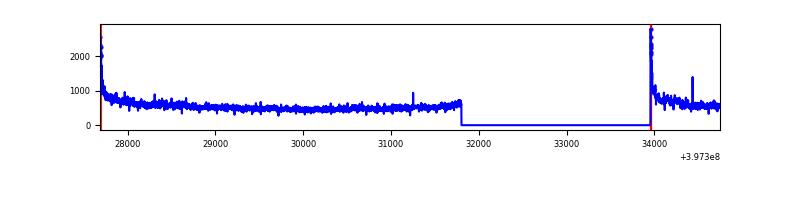 |
| B | 7062 | 4910 | 116 | 116 | 1.64% | 2.36% | 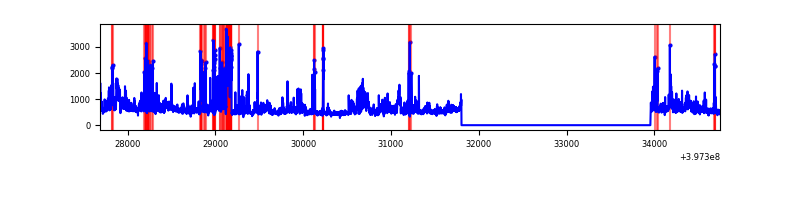 |
| C | 7062 | 4910 | 113 | 113 | 1.60% | 2.30% | 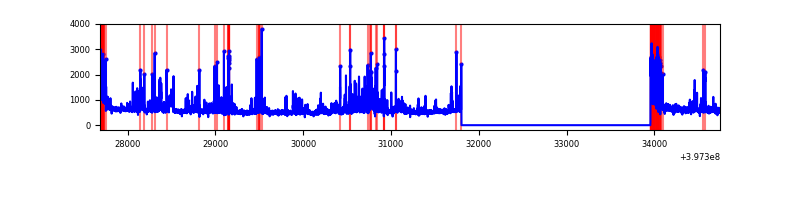 |
| D | 7062 | 4910 | 28 | 28 | 0.40% | 0.57% | 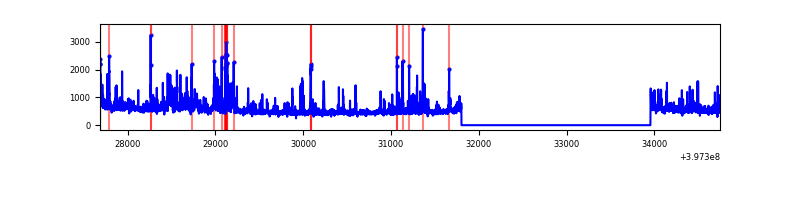 |
Top three noisy pixels from each quadrant. If the there are fewer than three noisy pixels in the level2.evt file, extra rows are filled as -1
| Pixel properties | Quadrant properties | ||||||
|---|---|---|---|---|---|---|---|
| Quadrant | DetID | PixID | Counts | Sigma | Mean | Median | Sigma |
| A | 10 | 83 | 245425 | 2008.14 | 612 | 603 | 121.9 |
| A | 11 | 254 | 114602 | 935.07 | 612 | 603 | 121.9 |
| A | 13 | 254 | 6977 | 52.28 | 612 | 603 | 121.9 |
| B | 0 | 229 | 382158 | 3295.98 | 607 | 593 | 115.8 |
| B | 5 | 184 | 203794 | 1755.26 | 607 | 593 | 115.8 |
| B | 0 | 213 | 163221 | 1404.79 | 607 | 593 | 115.8 |
| C | 0 | 10 | 279006 | 2016.34 | 597 | 606 | 138.1 |
| C | 0 | 207 | 228987 | 1654.08 | 597 | 606 | 138.1 |
| C | 15 | 214 | 208116 | 1502.91 | 597 | 606 | 138.1 |
| D | 2 | 250 | 190639 | 1305.02 | 597 | 582 | 145.6 |
| D | 2 | 153 | 89148 | 608.14 | 597 | 582 | 145.6 |
| D | 12 | 233 | 87206 | 594.8 | 597 | 582 | 145.6 |
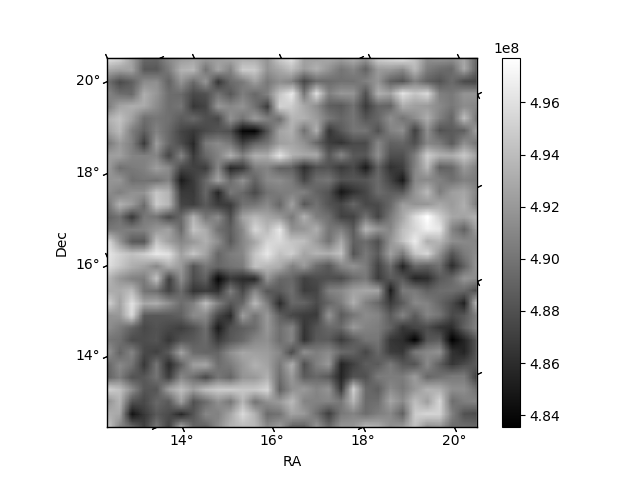
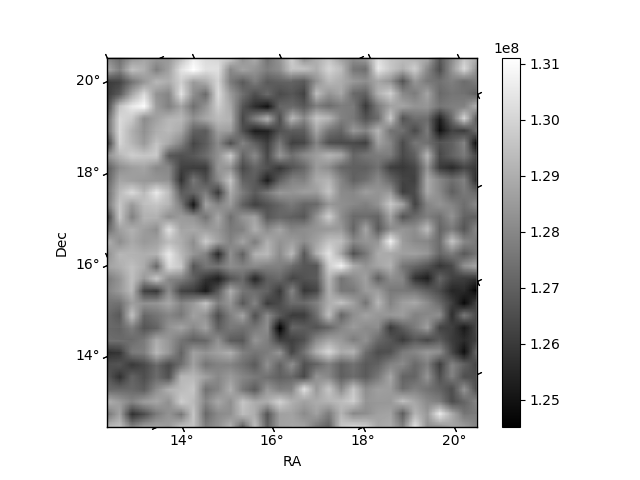
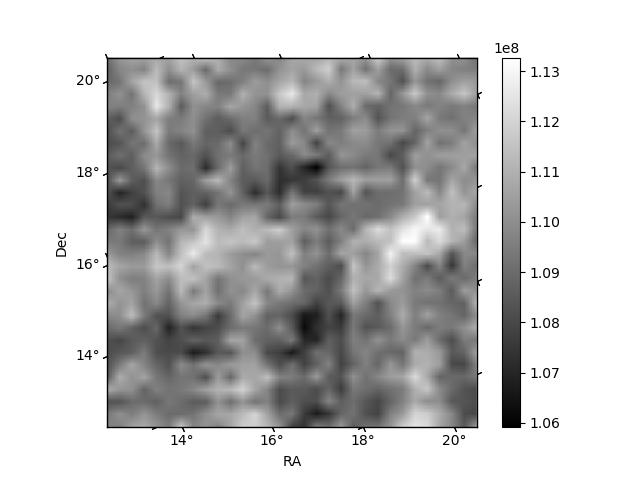
Histogram calculated using DETX and DETY for each event in the final _common_clean file
| Quadrant A | 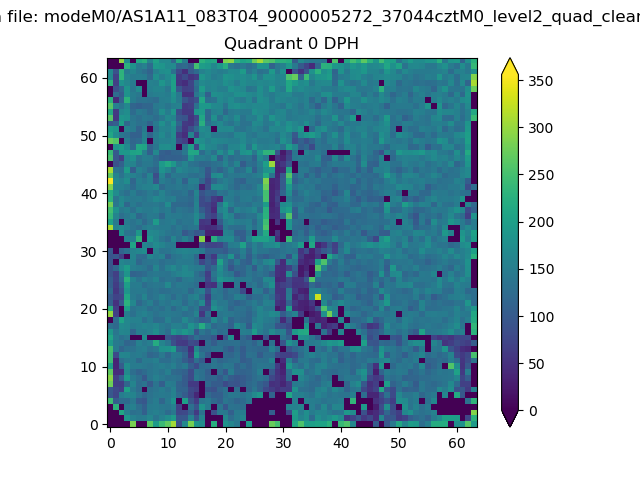 |
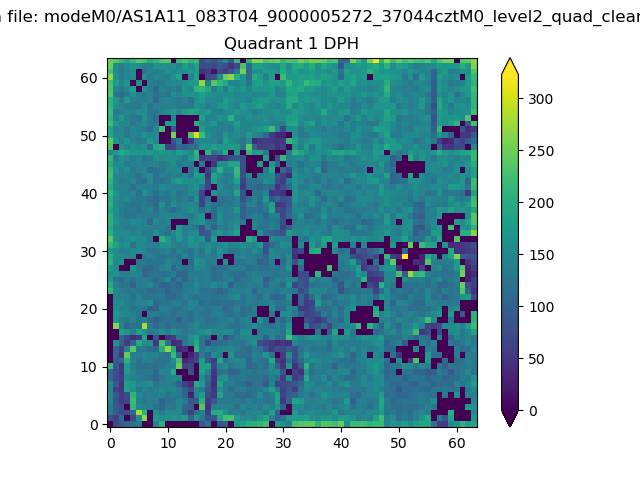 |
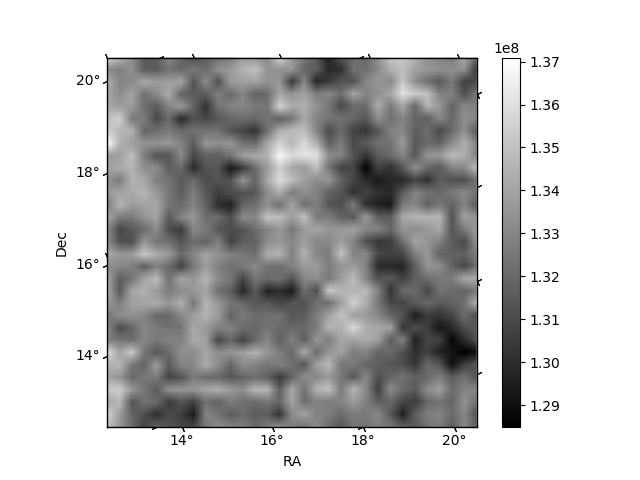
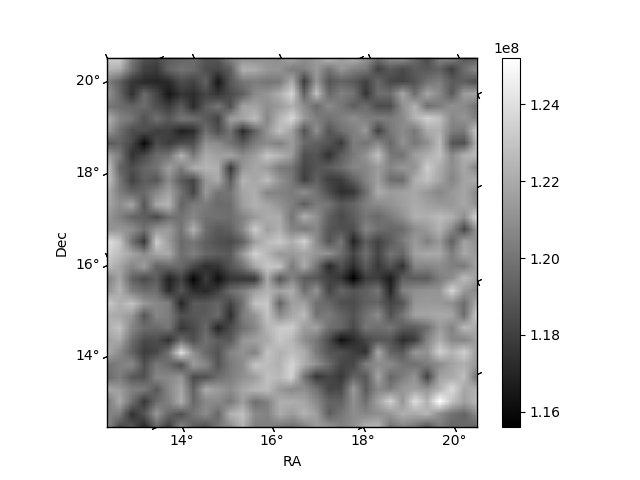
Quadrant B |
|---|---|---|---|
| Quadrant D | 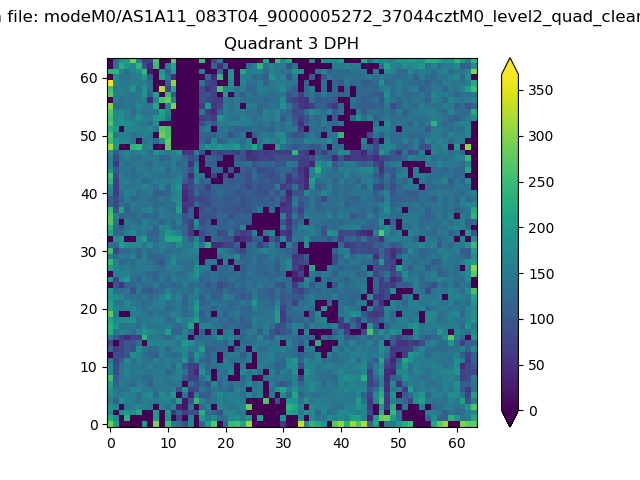 |
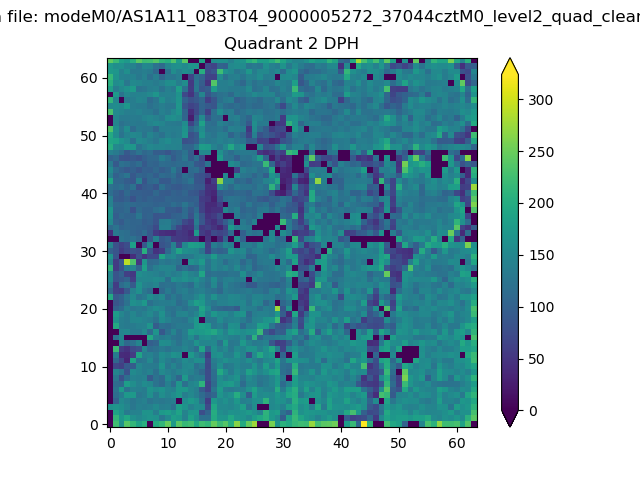 |
Quadrant C |
| Plot type | Count rate plots | Images |
|---|---|---|
| Comparison with Poisson distribution Blue bars denote a histogram of data divided into 1 sec bins. Red curve is a Poisson curve with rate = median count rate of data. |
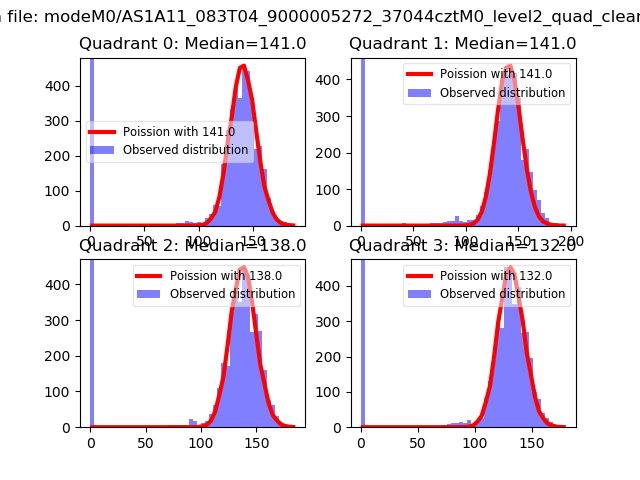 |
 |
| Quadrant-wise count rates Data is divided into 100 sec bins |
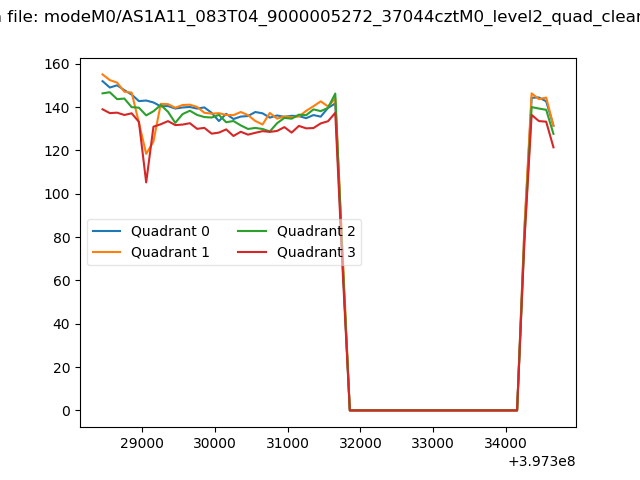 |
|
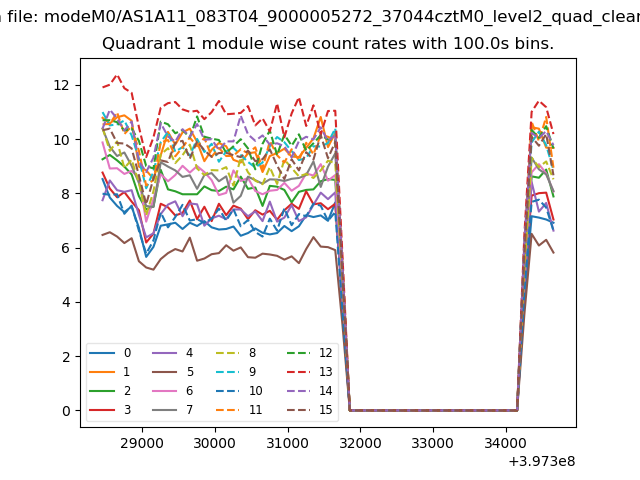
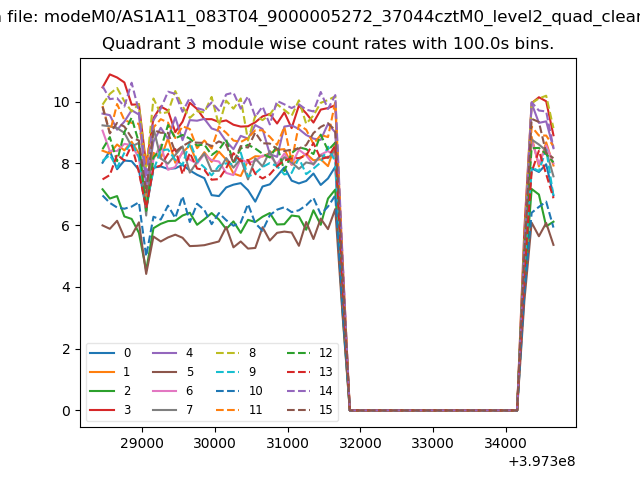
| Module-wise count rates for Quadrant A Data is divided into 100 sec bins |
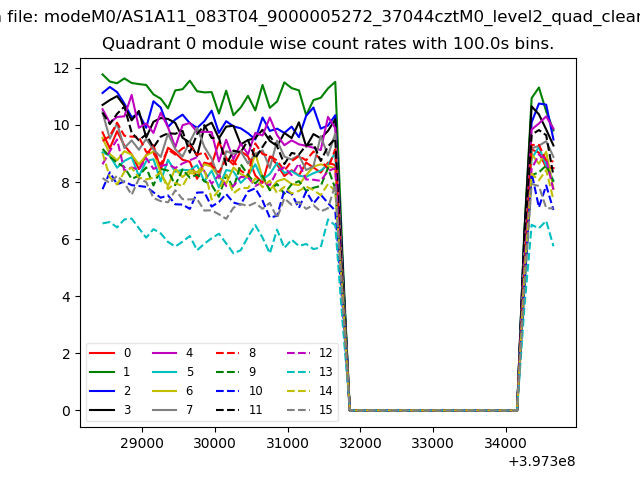 |
 |
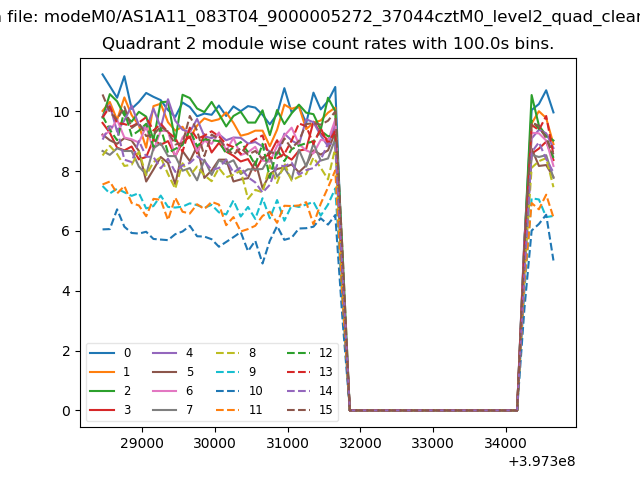
| Module-wise count rates for Quadrant B Data is divided into 100 sec bins |
 |
 |
| Module-wise count rates for Quadrant C Data is divided into 100 sec bins |
 |
 |
| Module-wise count rates for Quadrant D Data is divided into 100 sec bins |
 |
 |
| Parameter | Plot |
|---|---|
| CZT HV Monitor | 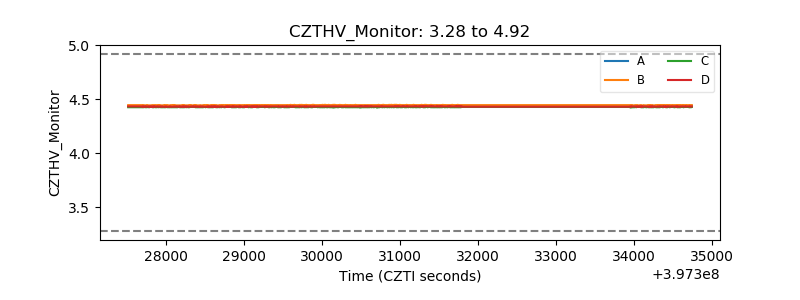 |
| D_VDD | 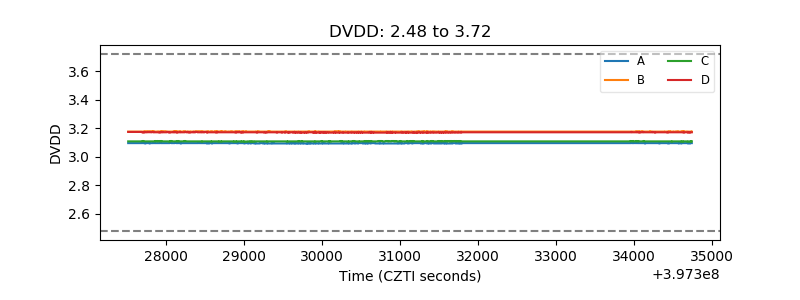 |
| Temperature 1 | 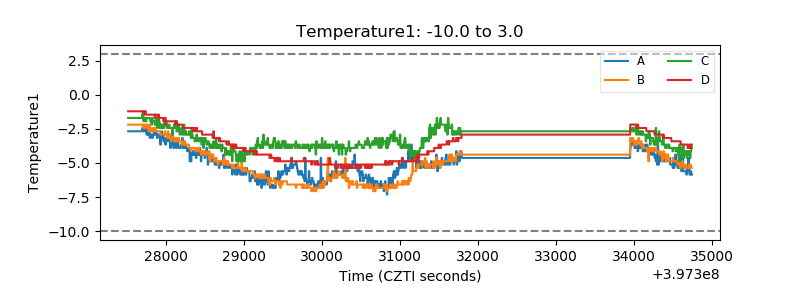 |
| Veto HV Monitor | 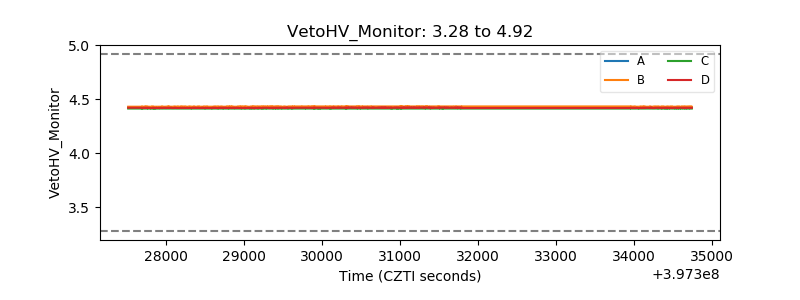 |
| Veto LLD | 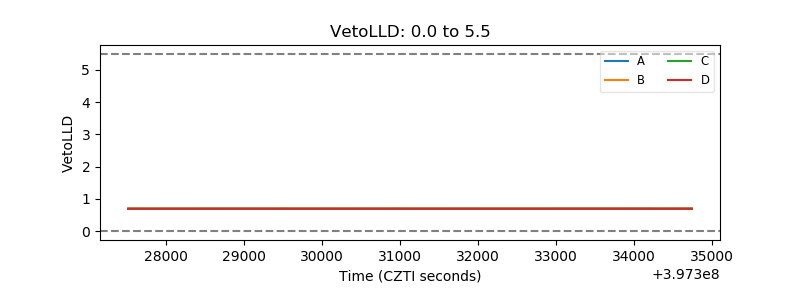 |
| Alpha Counter | 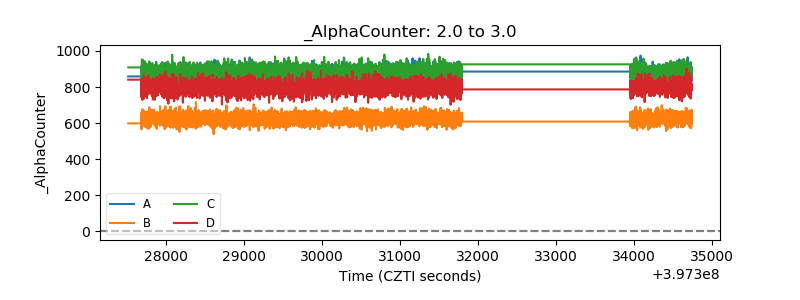 |
| _CPM_Rate | 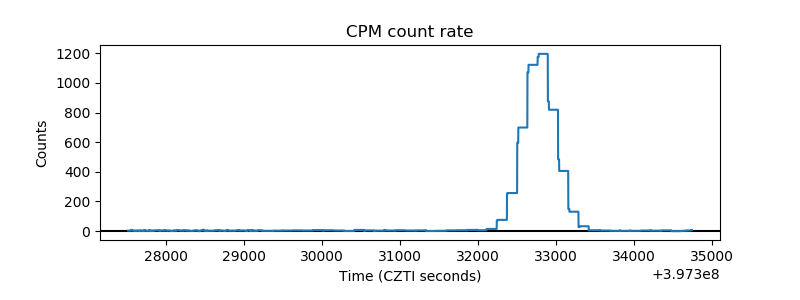 |
| CZT Counter | 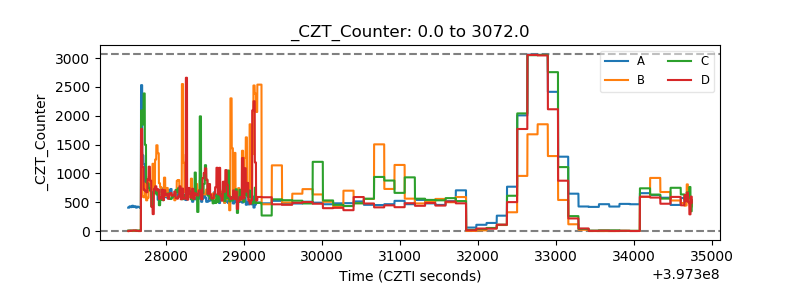 |
| +2.5 Volts monitor | 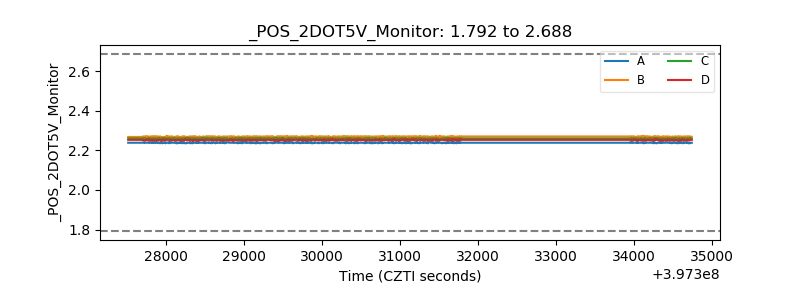 |
| +5 Volts monitor | 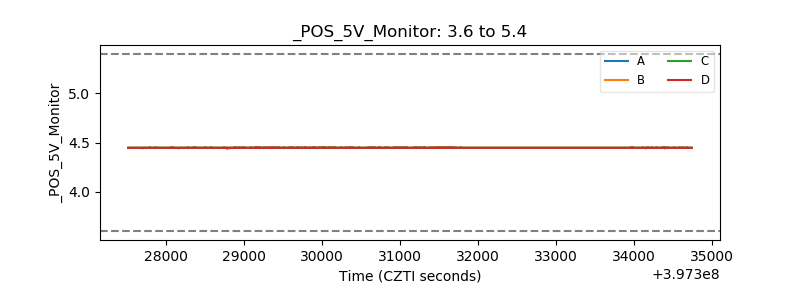 |
| _ROLL_ROT | 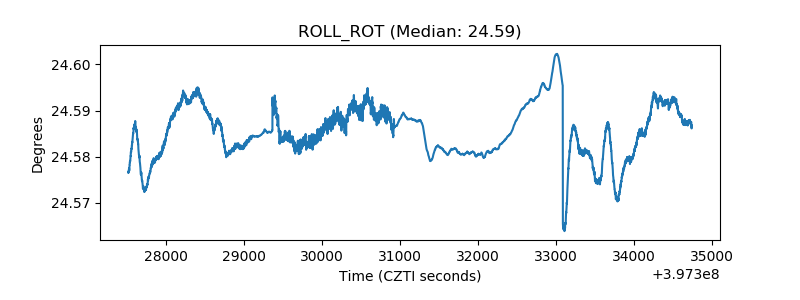 |
| _Roll_DEC | 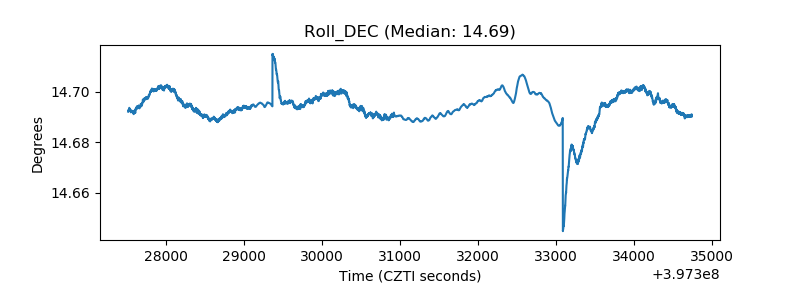 |
| _Roll_RA | 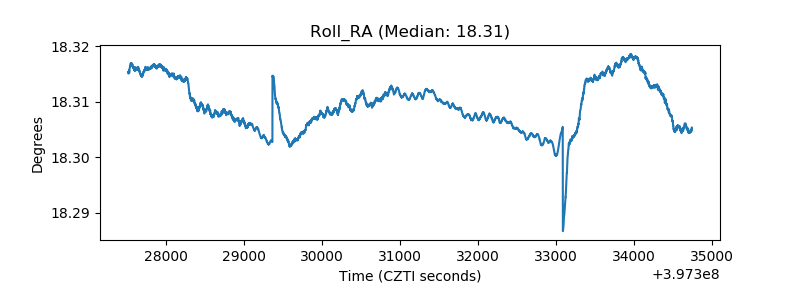 |
| Veto Counter | 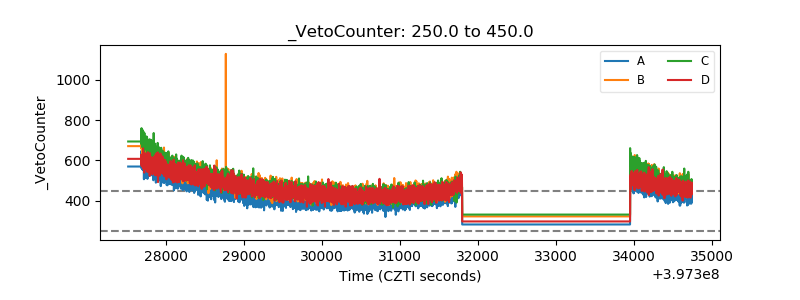 |