| Param | Original file | Final file |
|---|---|---|
| Filename | modeM0/AS1A11_083T04_9000005272_37046cztM0_level2.evt | modeM0/AS1A11_083T04_9000005272_37046cztM0_level2_quad_clean.evt |
| Size (bytes) | 520,750,080 | 81,550,080 |
| Size | 496.6 MB | 77.8 MB |
| Events in quadrant A | 2,705,423 | 547,908 |
| Events in quadrant B | 3,233,801 | 545,857 |
| Events in quadrant C | 4,457,666 | 521,188 |
| Events in quadrant D | 5,013,433 | 481,528 |
| Mode M9 | |||
|---|---|---|---|
| Quadrant | BADHDUFLAG | Total packets | Discarded packets |
| A | 0 | 28 | 0 |
| B | 0 | 28 | 0 |
| C | 0 | 28 | 0 |
| D | 0 | 29 | 0 |
| Mode SS | |||
|---|---|---|---|
| Quadrant | BADHDUFLAG | Total packets | Discarded packets |
| A | 0 | 108 | 0 |
| B | 0 | 108 | 0 |
| C | 0 | 108 | 0 |
| D | 0 | 108 | 0 |
| Mode M0 | |||
|---|---|---|---|
| Quadrant | BADHDUFLAG | Total packets | Discarded packets |
| A | 0 | 11414 | 3 |
| B | 0 | 13071 | 2 |
| C | 0 | 16682 | 2 |
| D | 0 | 18562 | 2 |
| Quadrant | Total seconds | Saturated seconds | Saturation percentage |
|---|---|---|---|
| A | 5324 | 12 | 0.225394% |
| B | 5324 | 166 | 3.117956% |
| C | 5324 | 309 | 5.803907% |
| D | 5324 | 691 | 12.978963% |
Noise dominated data is calculated using 1-second bins in cleaned event files. If a bin has >2000 counts, and if more than 50% of those come from <1% of pixels, then it is considered to be noise-dominated and hence unusable.
| Quadrant | # 1 sec bins | Bins with >0 counts | Bins with >2000 counts | High rate bins dominated by noise | Noise dominated (total time) | Noise dominated (detector-on time) | Marked lightcurve |
|---|---|---|---|---|---|---|---|
| A | 7088 | 5325 | 2 | 2 | 0.03% | 0.04% | 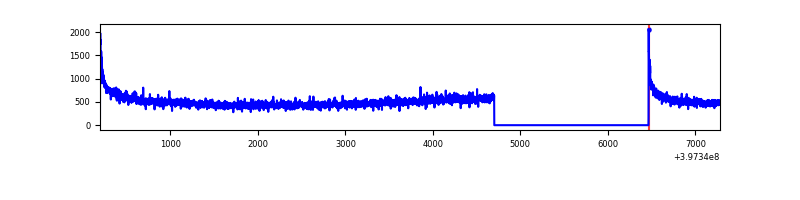 |
| B | 7088 | 5325 | 138 | 138 | 1.95% | 2.59% | 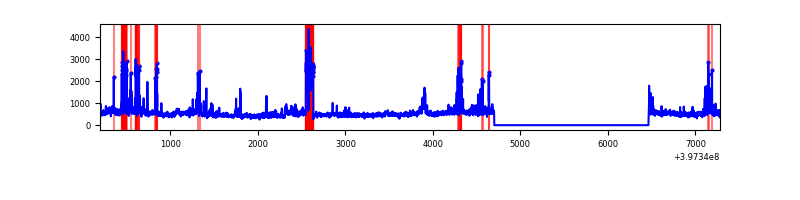 |
| C | 7088 | 5325 | 302 | 302 | 4.26% | 5.67% | 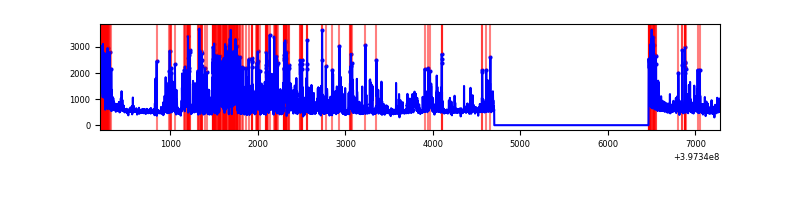 |
| D | 7088 | 5325 | 625 | 625 | 8.82% | 11.74% | 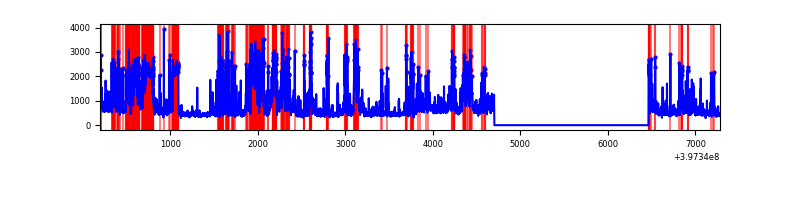 |
Top three noisy pixels from each quadrant. If the there are fewer than three noisy pixels in the level2.evt file, extra rows are filled as -1
| Pixel properties | Quadrant properties | ||||||
|---|---|---|---|---|---|---|---|
| Quadrant | DetID | PixID | Counts | Sigma | Mean | Median | Sigma |
| A | 10 | 83 | 249231 | 2010.77 | 612 | 600 | 123.6 |
| A | 11 | 254 | 84487 | 678.42 | 612 | 600 | 123.6 |
| A | 13 | 254 | 7572 | 56.39 | 612 | 600 | 123.6 |
| B | 0 | 229 | 421187 | 3626.63 | 603 | 587 | 116.0 |
| B | 5 | 172 | 126637 | 1086.87 | 603 | 587 | 116.0 |
| B | 0 | 213 | 75254 | 643.82 | 603 | 587 | 116.0 |
| C | 14 | 254 | 1078106 | 7802.27 | 586 | 590 | 138.1 |
| C | 0 | 10 | 546850 | 3955.45 | 586 | 590 | 138.1 |
| C | 0 | 207 | 255322 | 1844.51 | 586 | 590 | 138.1 |
| D | 12 | 17 | 2072224 | 14890.08 | 567 | 552 | 139.1 |
| D | 2 | 250 | 188357 | 1349.84 | 567 | 552 | 139.1 |
| D | 2 | 153 | 182616 | 1308.58 | 567 | 552 | 139.1 |
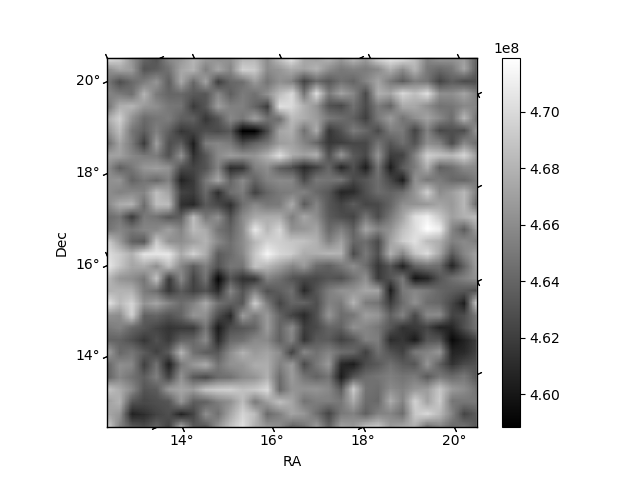
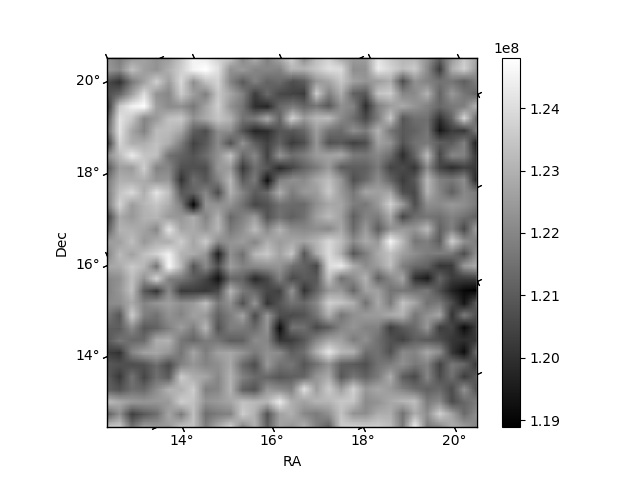
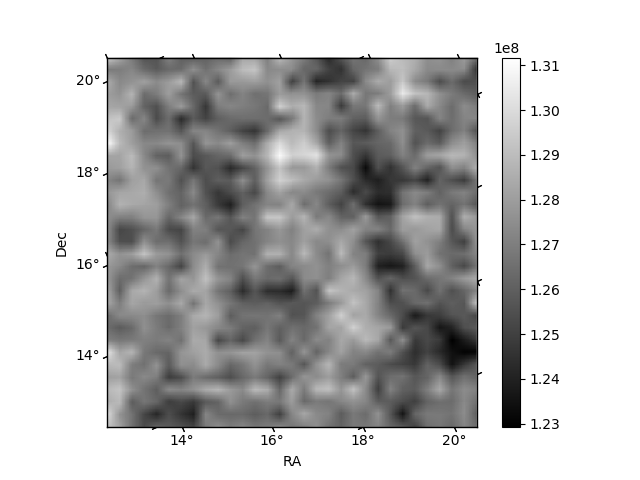
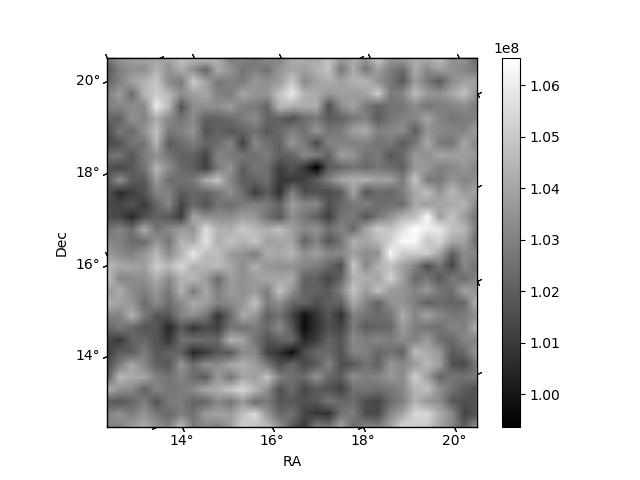
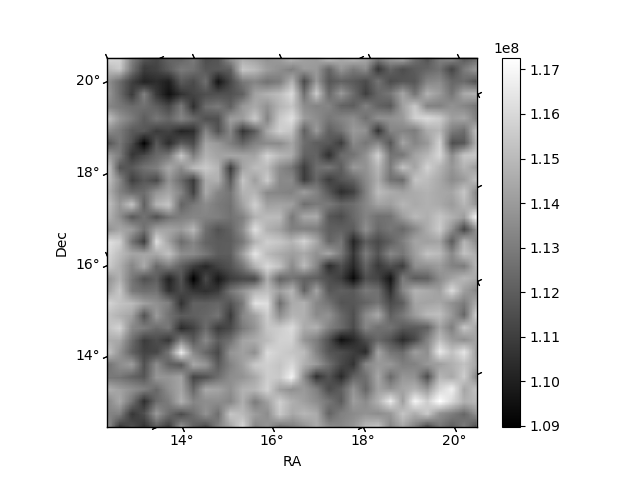
Histogram calculated using DETX and DETY for each event in the final _common_clean file
| Quadrant A | 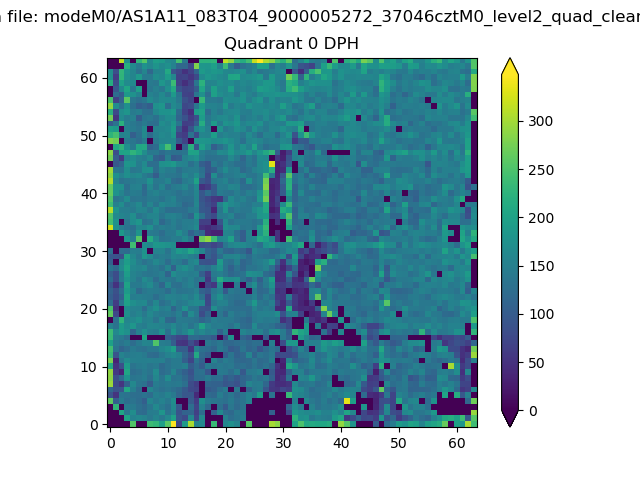 |
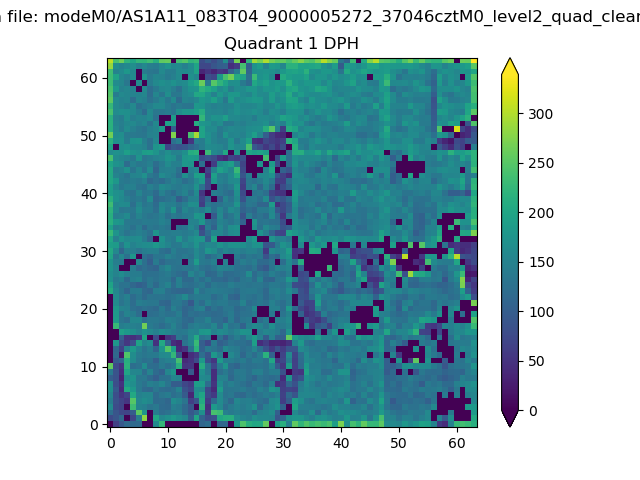 |
Quadrant B |
|---|---|---|---|
| Quadrant D | 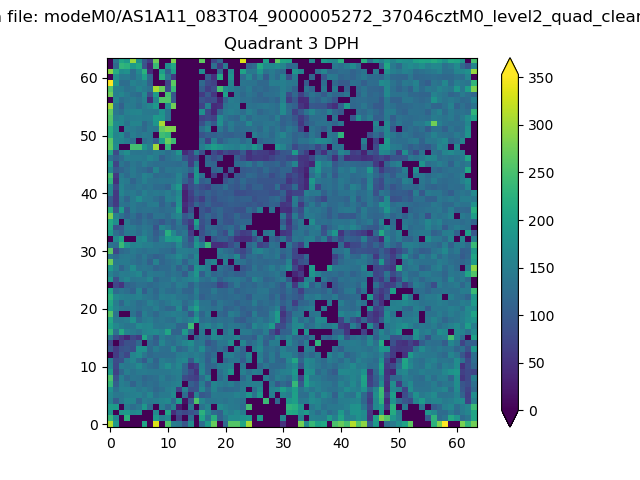 |
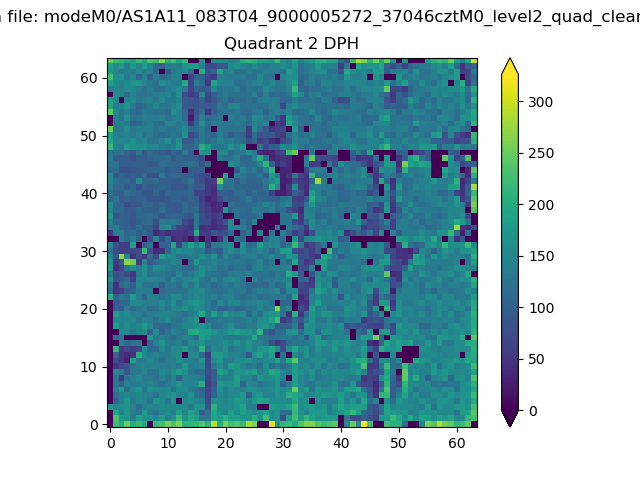 |
Quadrant C |
| Plot type | Count rate plots | Images |
|---|---|---|
| Comparison with Poisson distribution Blue bars denote a histogram of data divided into 1 sec bins. Red curve is a Poisson curve with rate = median count rate of data. |
 |
 |
| Quadrant-wise count rates Data is divided into 100 sec bins |
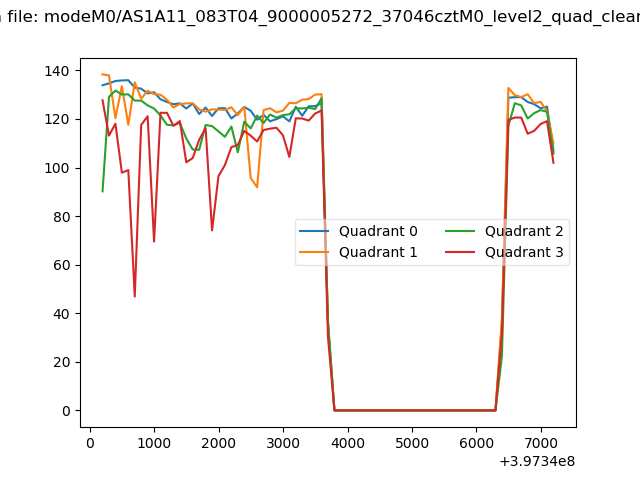 |
|
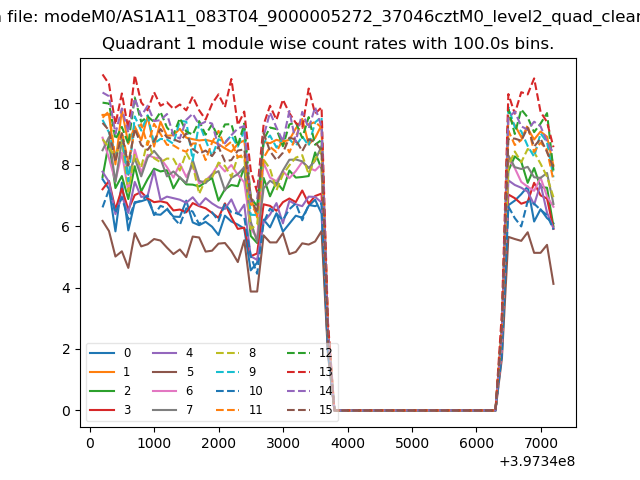
| Module-wise count rates for Quadrant A Data is divided into 100 sec bins |
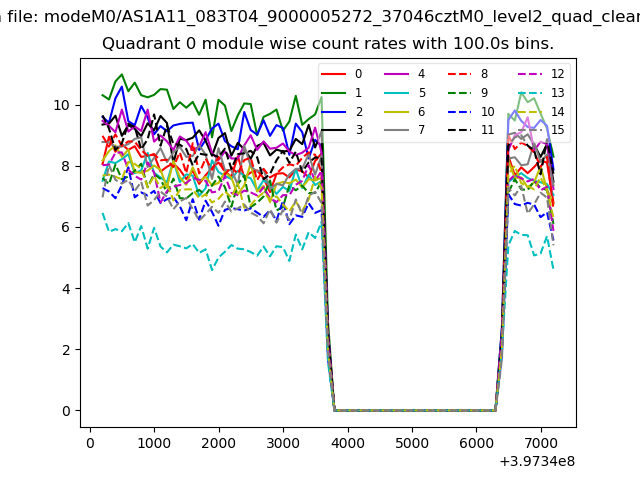 |
 |
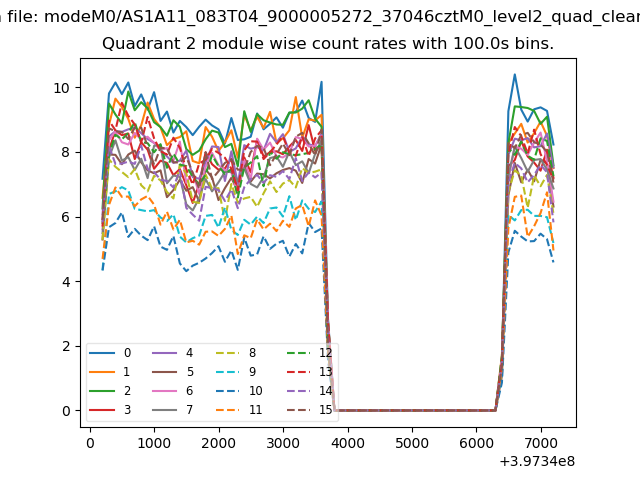
| Module-wise count rates for Quadrant B Data is divided into 100 sec bins |
 |
 |
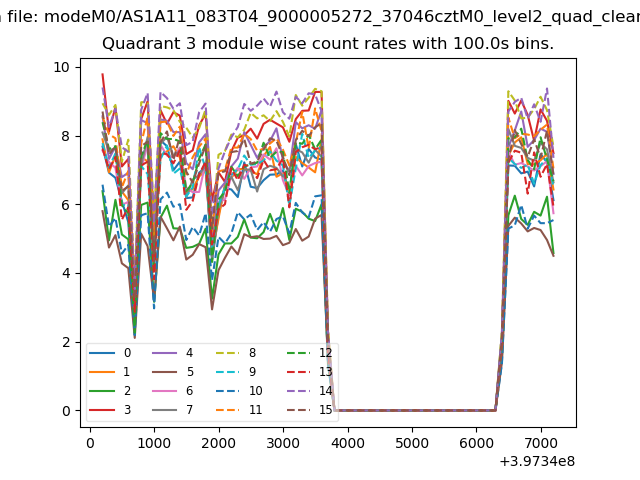
| Module-wise count rates for Quadrant C Data is divided into 100 sec bins |
 |
 |
| Module-wise count rates for Quadrant D Data is divided into 100 sec bins |
 |
 |
| Parameter | Plot |
|---|---|
| CZT HV Monitor | 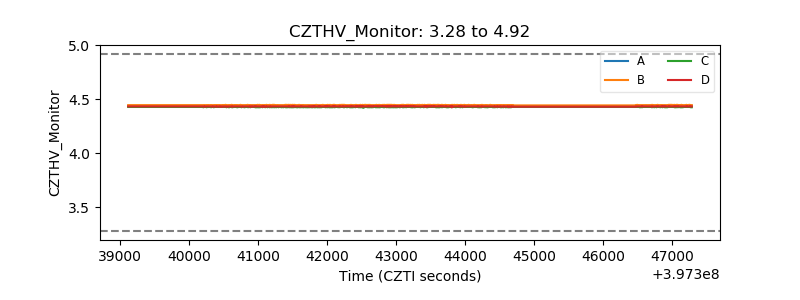 |
| D_VDD | 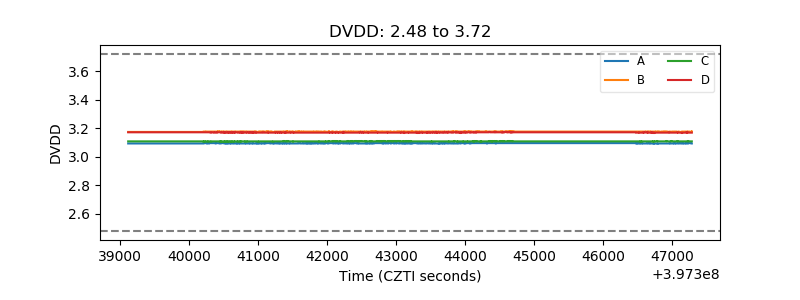 |
| Temperature 1 | 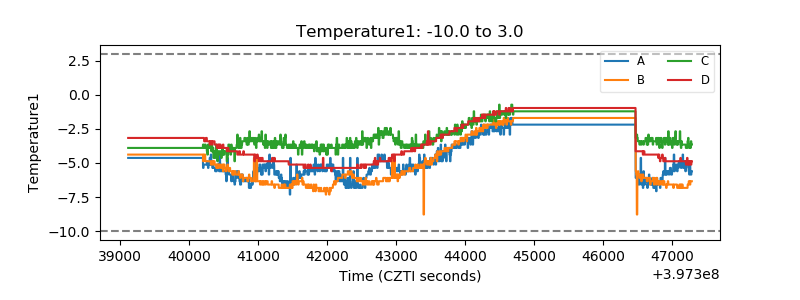 |
| Veto HV Monitor | 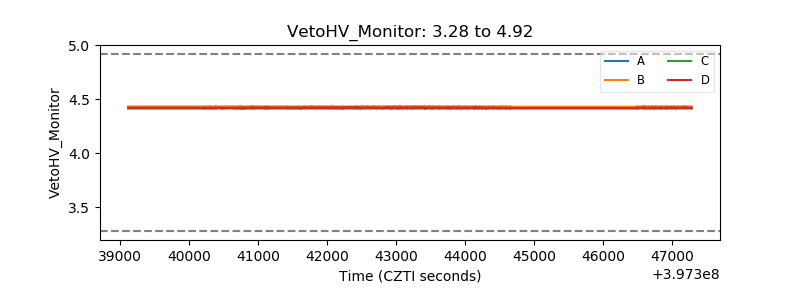 |
| Veto LLD | 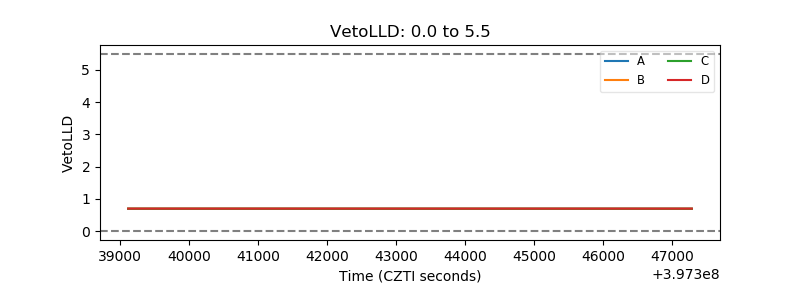 |
| Alpha Counter | 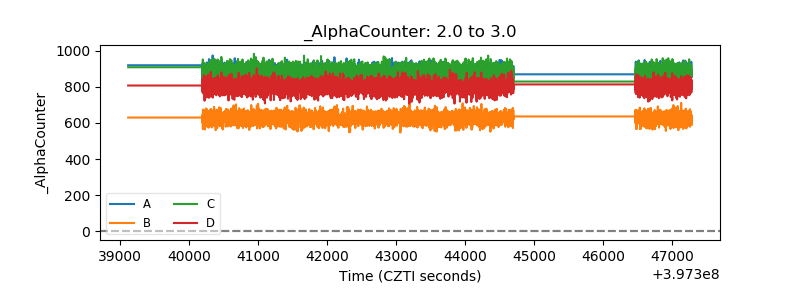 |
| _CPM_Rate | 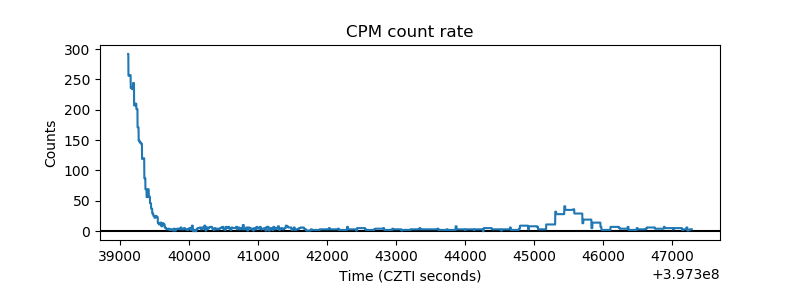 |
| CZT Counter | 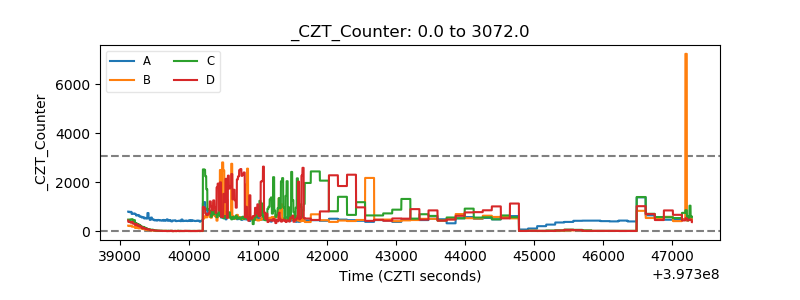 |
| +2.5 Volts monitor |  |
| +5 Volts monitor | 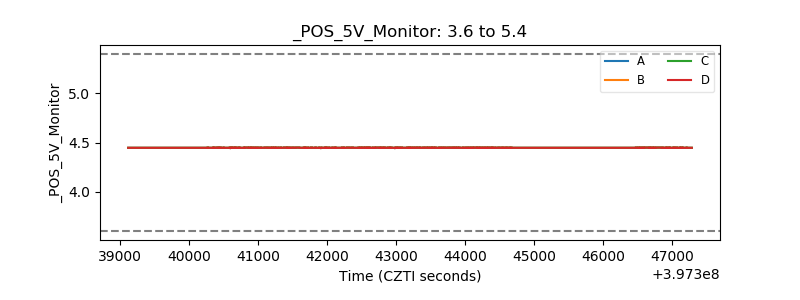 |
| _ROLL_ROT | 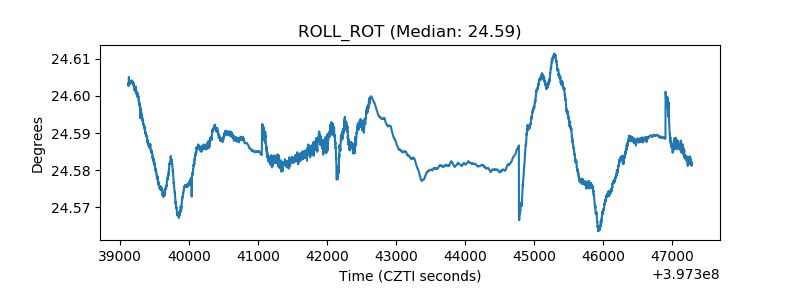 |
| _Roll_DEC | 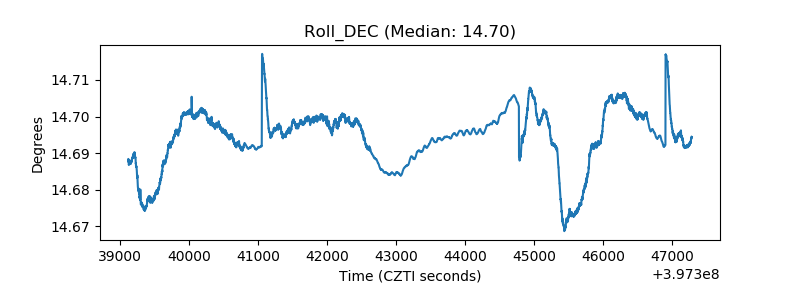 |
| _Roll_RA | 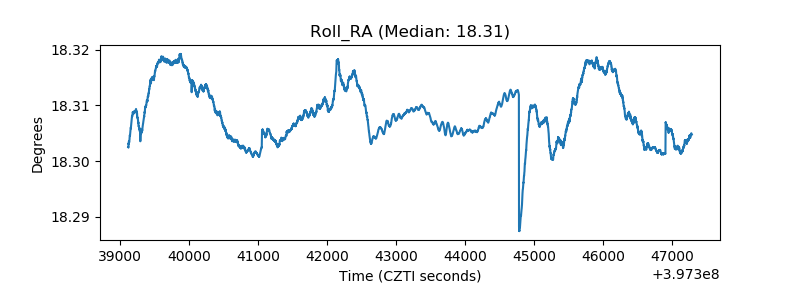 |
| Veto Counter | 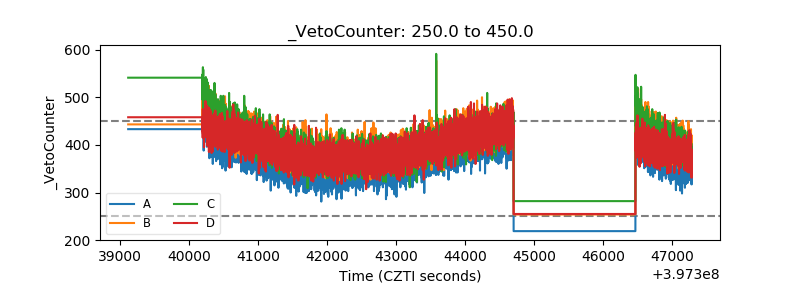 |