| Param | Original file | Final file |
|---|---|---|
| Filename | modeM0/AS1A11_083T04_9000005272_37048cztM0_level2.evt | modeM0/AS1A11_083T04_9000005272_37048cztM0_level2_quad_clean.evt |
| Size (bytes) | 505,114,560 | 63,930,240 |
| Size | 481.7 MB | 61.0 MB |
| Events in quadrant A | 2,593,658 | 405,317 |
| Events in quadrant B | 3,048,667 | 409,766 |
| Events in quadrant C | 3,225,963 | 398,744 |
| Events in quadrant D | 6,084,353 | 365,551 |
| Mode M9 | |||
|---|---|---|---|
| Quadrant | BADHDUFLAG | Total packets | Discarded packets |
| A | 0 | 28 | 0 |
| B | 0 | 28 | 0 |
| C | 0 | 28 | 0 |
| D | 0 | 29 | 0 |
| Mode SS | |||
|---|---|---|---|
| Quadrant | BADHDUFLAG | Total packets | Discarded packets |
| A | 0 | 102 | 0 |
| B | 0 | 102 | 0 |
| C | 0 | 102 | 0 |
| D | 0 | 102 | 0 |
| Mode M0 | |||
|---|---|---|---|
| Quadrant | BADHDUFLAG | Total packets | Discarded packets |
| A | 0 | 11046 | 2 |
| B | 0 | 12546 | 2 |
| C | 0 | 13005 | 2 |
| D | 0 | 21623 | 2 |
| Quadrant | Total seconds | Saturated seconds | Saturation percentage |
|---|---|---|---|
| A | 5087 | 13 | 0.255553% |
| B | 5087 | 147 | 2.889719% |
| C | 5087 | 90 | 1.769216% |
| D | 5087 | 1411 | 27.737370% |
Noise dominated data is calculated using 1-second bins in cleaned event files. If a bin has >2000 counts, and if more than 50% of those come from <1% of pixels, then it is considered to be noise-dominated and hence unusable.
| Quadrant | # 1 sec bins | Bins with >0 counts | Bins with >2000 counts | High rate bins dominated by noise | Noise dominated (total time) | Noise dominated (detector-on time) | Marked lightcurve |
|---|---|---|---|---|---|---|---|
| A | 6519 | 5088 | 7 | 7 | 0.11% | 0.14% | 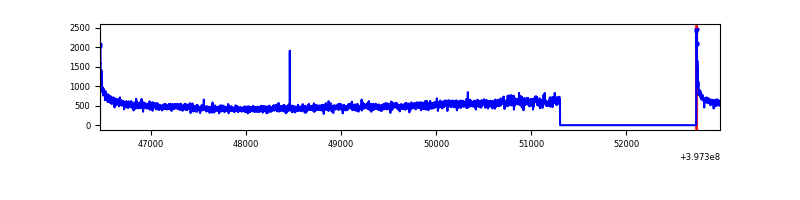 |
| B | 6519 | 5088 | 90 | 90 | 1.38% | 1.77% | 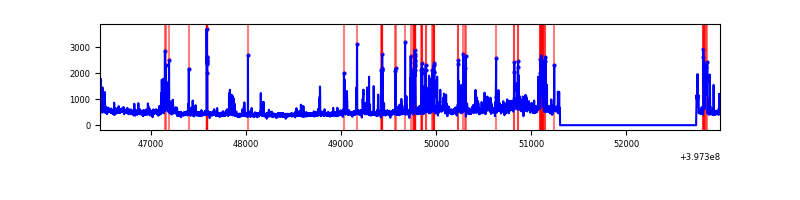 |
| C | 6519 | 5088 | 56 | 56 | 0.86% | 1.10% | 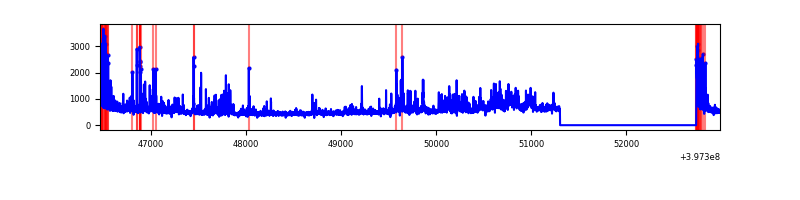 |
| D | 6519 | 5088 | 1133 | 1133 | 17.38% | 22.27% | 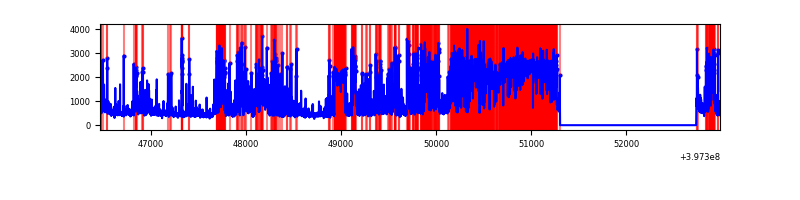 |
Top three noisy pixels from each quadrant. If the there are fewer than three noisy pixels in the level2.evt file, extra rows are filled as -1
| Pixel properties | Quadrant properties | ||||||
|---|---|---|---|---|---|---|---|
| Quadrant | DetID | PixID | Counts | Sigma | Mean | Median | Sigma |
| A | 10 | 83 | 236850 | 1998.75 | 581 | 570 | 118.2 |
| A | 11 | 254 | 97034 | 816.01 | 581 | 570 | 118.2 |
| A | 13 | 254 | 7685 | 60.19 | 581 | 570 | 118.2 |
| B | 5 | 184 | 231398 | 2052.27 | 574 | 559 | 112.5 |
| B | 5 | 172 | 142424 | 1261.25 | 574 | 559 | 112.5 |
| B | 0 | 229 | 114997 | 1017.41 | 574 | 559 | 112.5 |
| C | 14 | 254 | 323115 | 2430.01 | 562 | 565 | 132.7 |
| C | 0 | 10 | 280562 | 2109.43 | 562 | 565 | 132.7 |
| C | 15 | 214 | 215113 | 1616.35 | 562 | 565 | 132.7 |
| D | 12 | 17 | 3678148 | 30743.21 | 480 | 467 | 119.6 |
| D | 1 | 47 | 153642 | 1280.45 | 480 | 467 | 119.6 |
| D | 2 | 250 | 88714 | 737.69 | 480 | 467 | 119.6 |
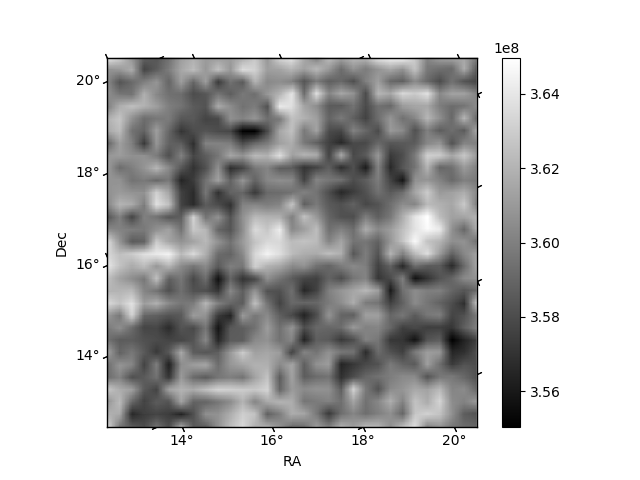
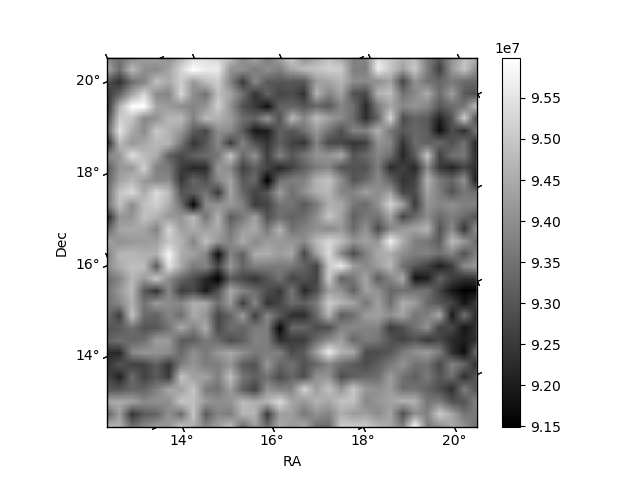
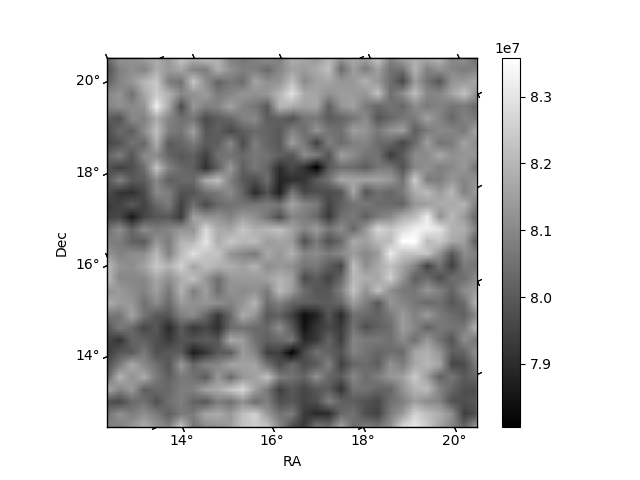
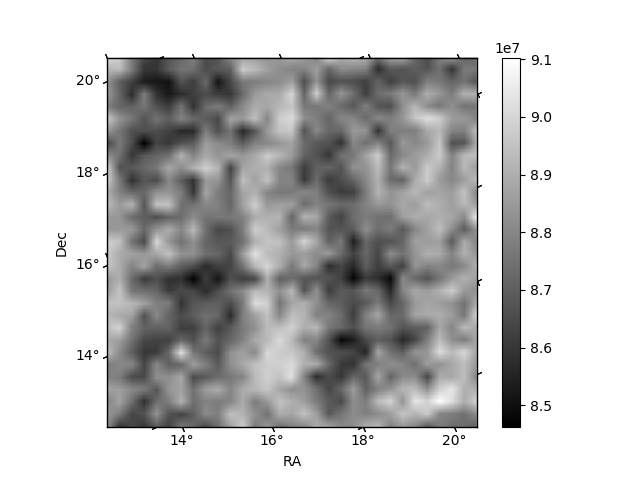
Histogram calculated using DETX and DETY for each event in the final _common_clean file
| Quadrant A | 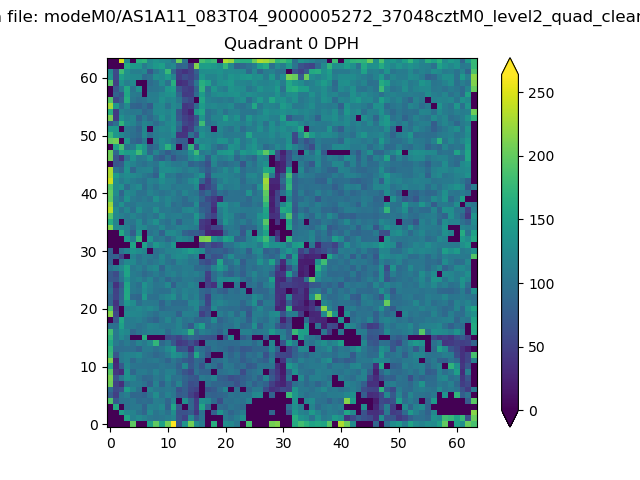 |
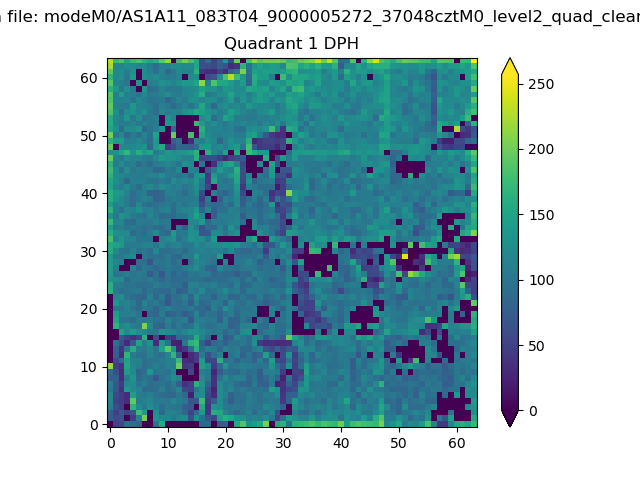 |
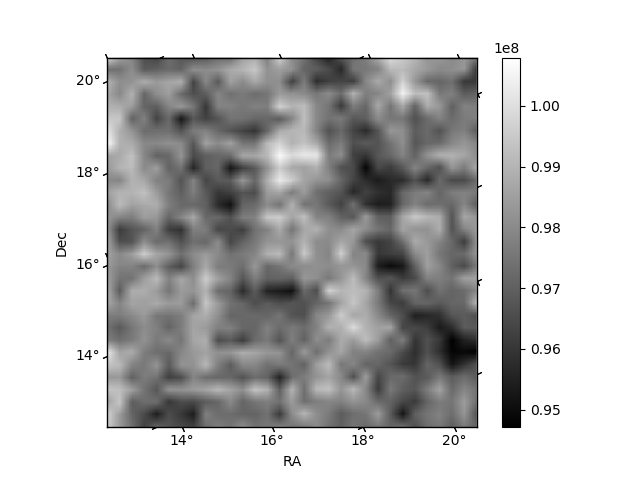
Quadrant B |
|---|---|---|---|
| Quadrant D | 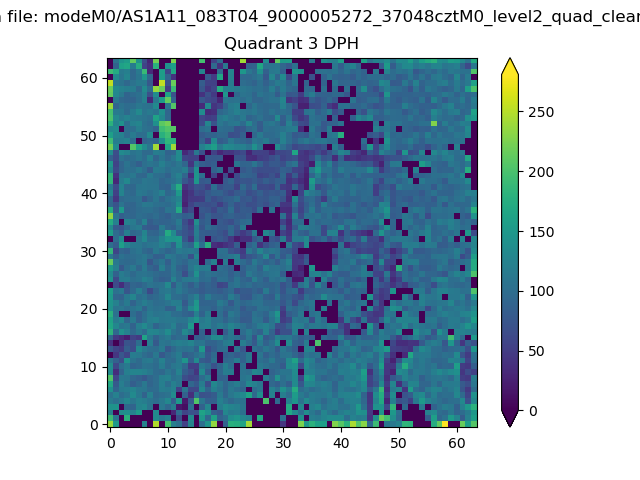 |
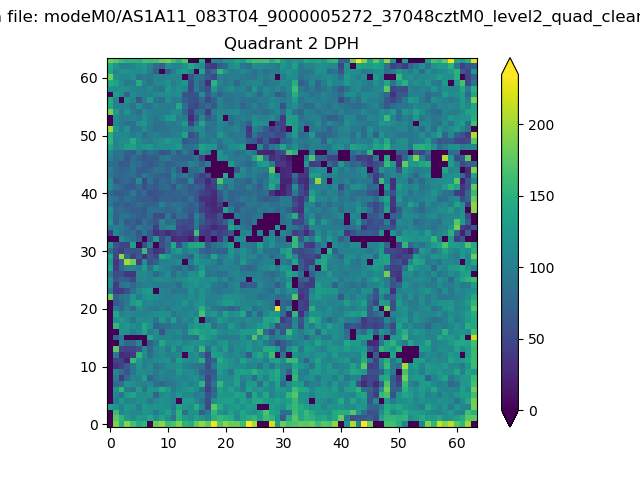 |
Quadrant C |
| Plot type | Count rate plots | Images |
|---|---|---|
| Comparison with Poisson distribution Blue bars denote a histogram of data divided into 1 sec bins. Red curve is a Poisson curve with rate = median count rate of data. |
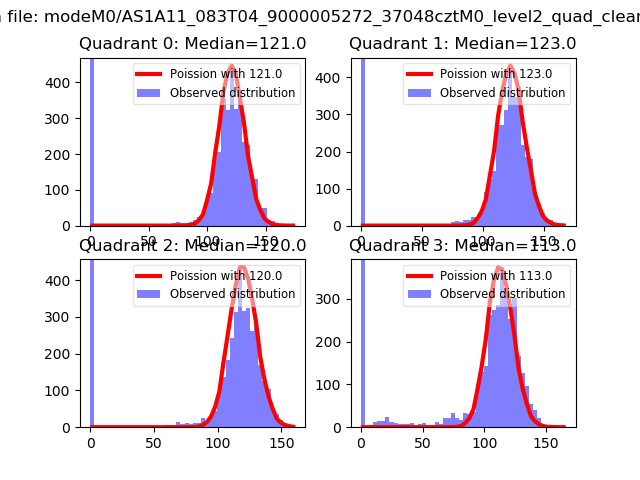 |
 |
| Quadrant-wise count rates Data is divided into 100 sec bins |
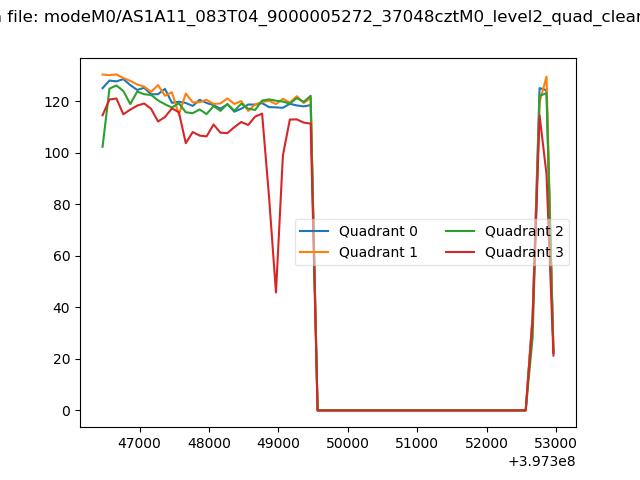 |
|
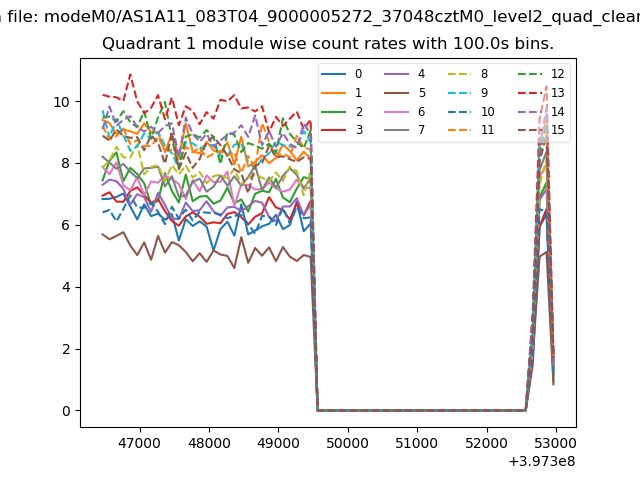
| Module-wise count rates for Quadrant A Data is divided into 100 sec bins |
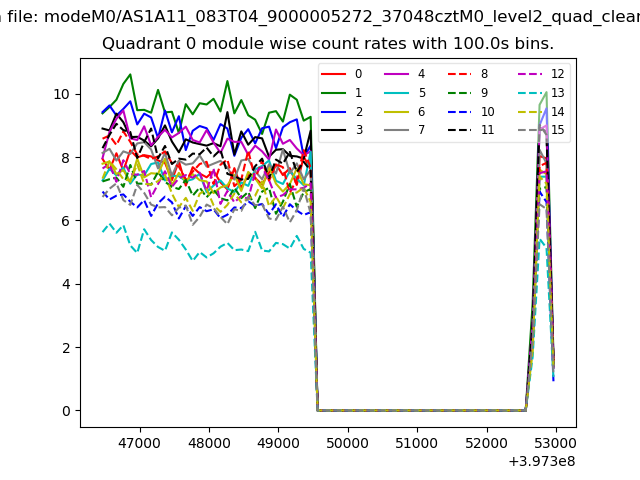 |
 |
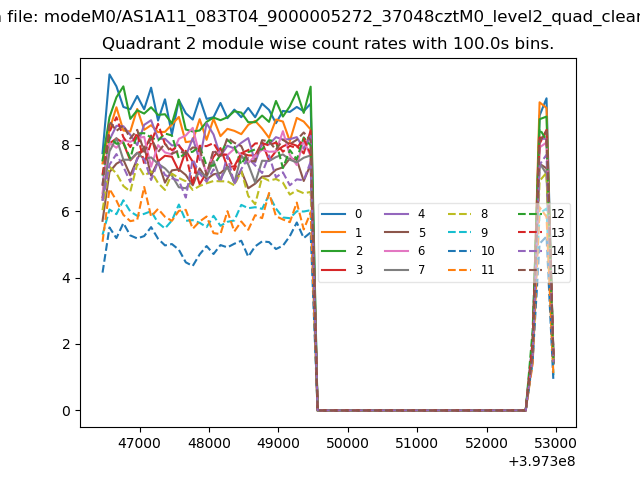
| Module-wise count rates for Quadrant B Data is divided into 100 sec bins |
 |
 |
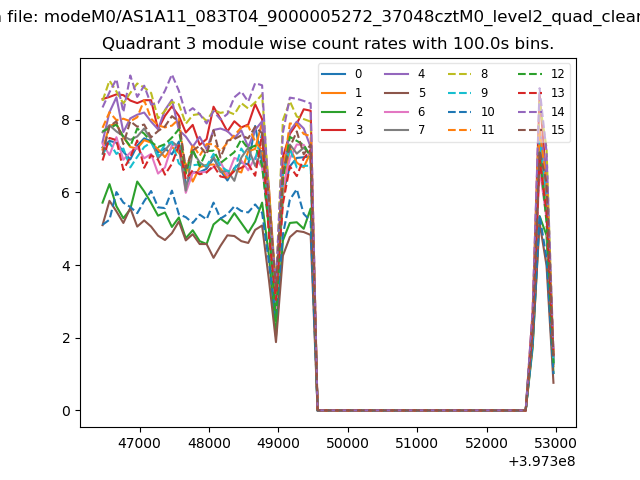
| Module-wise count rates for Quadrant C Data is divided into 100 sec bins |
 |
 |
| Module-wise count rates for Quadrant D Data is divided into 100 sec bins |
 |
 |
| Parameter | Plot |
|---|---|
| CZT HV Monitor | 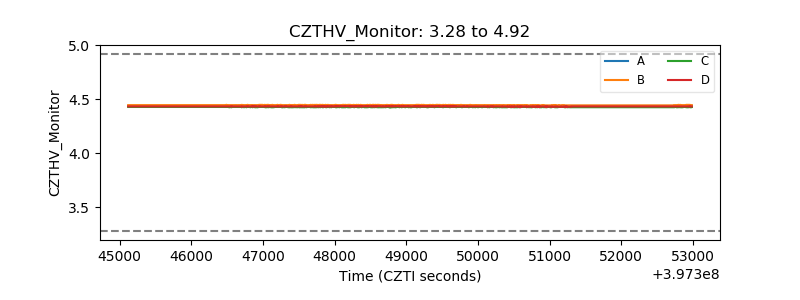 |
| D_VDD | 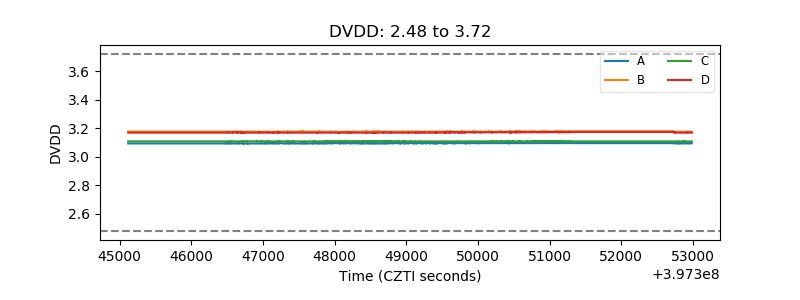 |
| Temperature 1 | 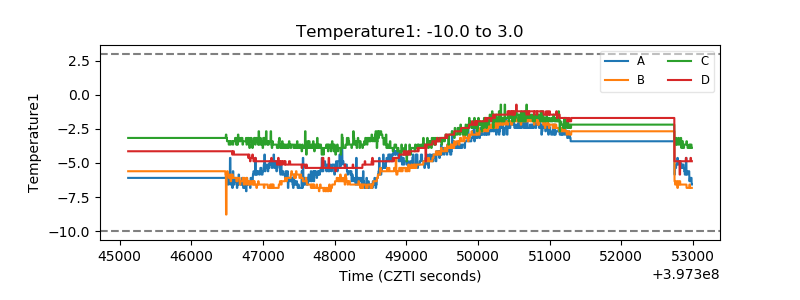 |
| Veto HV Monitor | 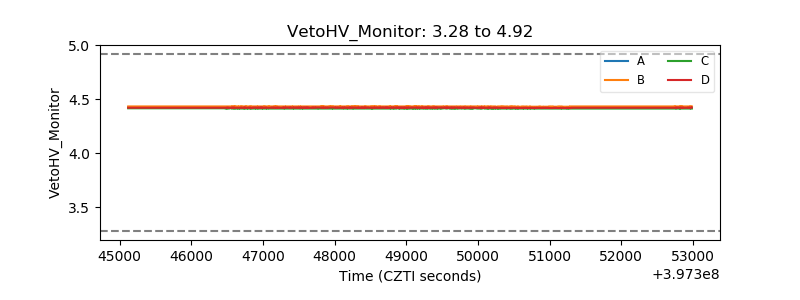 |
| Veto LLD | 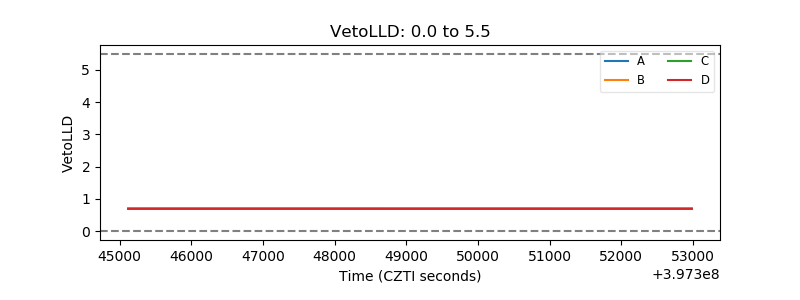 |
| Alpha Counter | 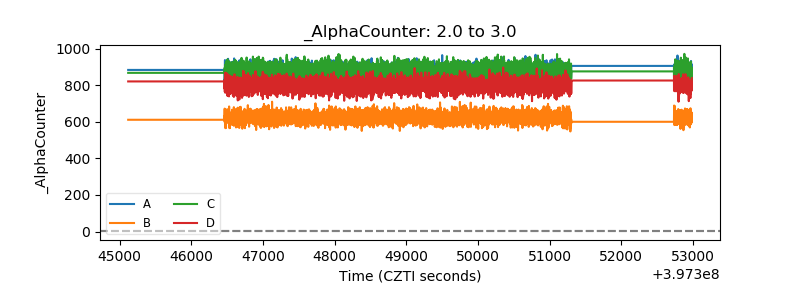 |
| _CPM_Rate | 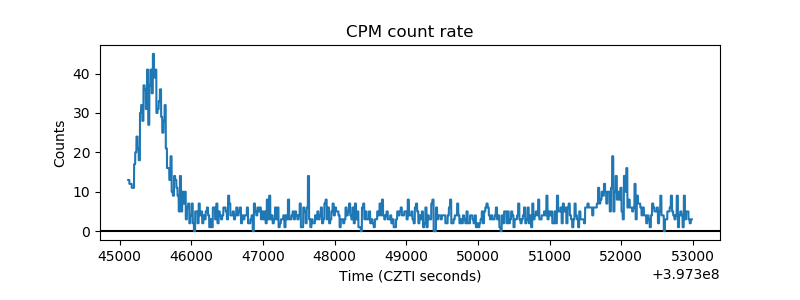 |
| CZT Counter | 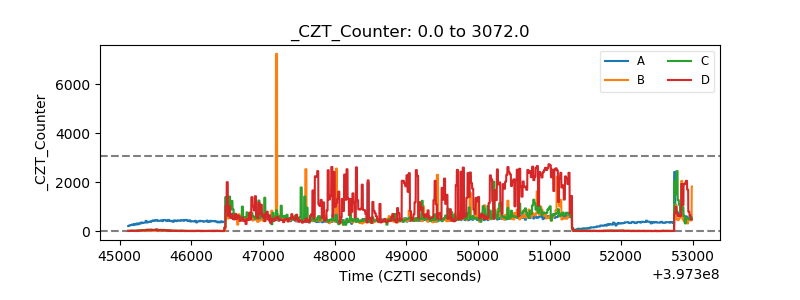 |
| +2.5 Volts monitor | 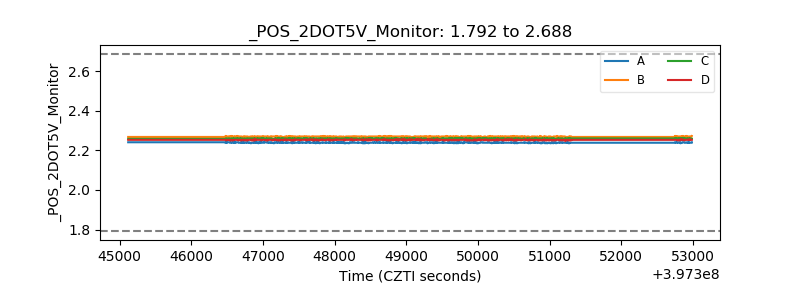 |
| +5 Volts monitor | 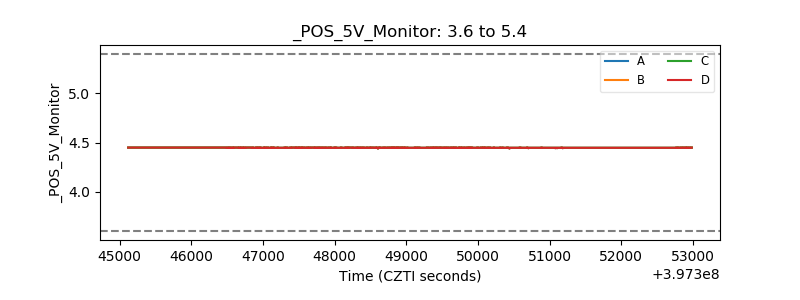 |
| _ROLL_ROT | 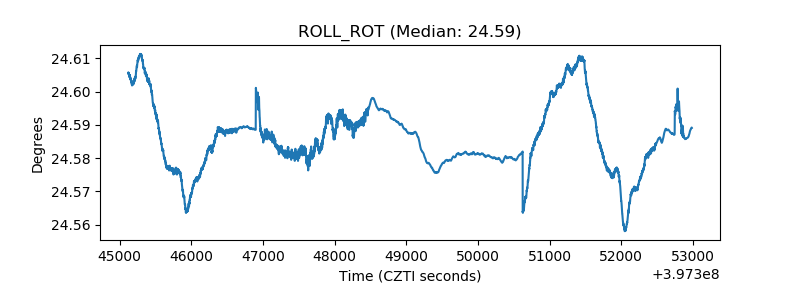 |
| _Roll_DEC | 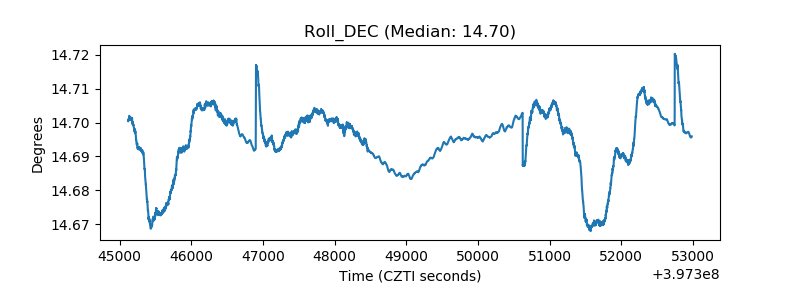 |
| _Roll_RA | 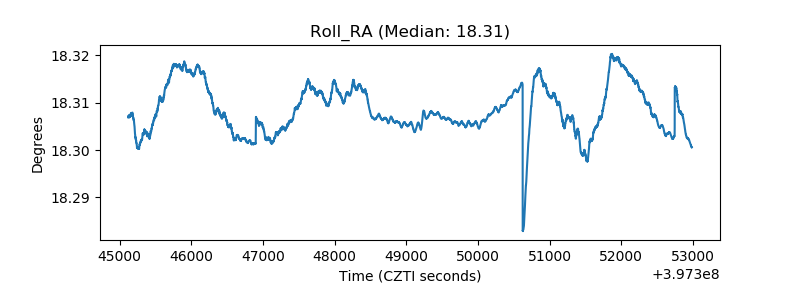 |
| Veto Counter | 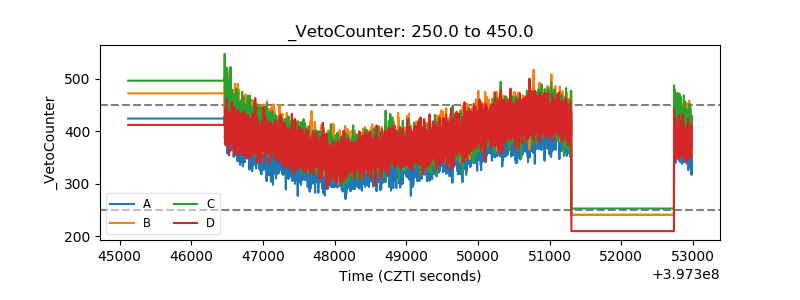 |