| Param | Original file | Final file |
|---|---|---|
| Filename | modeM0/AS1T05_044T01_9000005270cztM0_level2.fits | modeM0/AS1T05_044T01_9000005270cztM0_level2_quad_clean.evt |
| Size (bytes) | 184,285,440 | 154,166,400 |
| Size | 175.7 MB | 147.0 MB |
| Events in quadrant A | 1,156,008 | 912,448 |
| Events in quadrant B | 1,061,864 | 835,665 |
| Events in quadrant C | 1,101,934 | 832,357 |
| Events in quadrant D | 944,284 | 770,722 |
| Mode M0 | |||
|---|---|---|---|
| Quadrant | BADHDUFLAG | Total packets | Discarded packets |
| A | 0 | 42280 | 0 |
| B | 0 | 55136 | 0 |
| C | 0 | 46848 | 0 |
| D | 0 | 56023 | 0 |
| Mode SS | |||
|---|---|---|---|
| Quadrant | BADHDUFLAG | Total packets | Discarded packets |
| A | 0 | 394 | 0 |
| B | 0 | 394 | 0 |
| C | 0 | 394 | 0 |
| D | 0 | 394 | 0 |
| Mode M9 | |||
|---|---|---|---|
| Quadrant | BADHDUFLAG | Total packets | Discarded packets |
| A | 0 | 88 | 0 |
| B | 0 | 86 | 0 |
| C | 0 | 89 | 0 |
| D | 0 | 88 | 0 |
| Quadrant | Total seconds | Saturated seconds | Saturation percentage |
|---|---|---|---|
| A | 19106 | 51 | 0.266932% |
| B | 19107 | 1096 | 5.736118% |
| C | 19097 | 394 | 2.063151% |
| D | 19096 | 950 | 4.974864% |
Noise dominated data is calculated using 1-second bins in cleaned event files. If a bin has >2000 counts, and if more than 50% of those come from <1% of pixels, then it is considered to be noise-dominated and hence unusable.
| Quadrant | # 1 sec bins | Bins with >0 counts | Bins with >2000 counts | High rate bins dominated by noise | Noise dominated (total time) | Noise dominated (detector-on time) | Marked lightcurve |
|---|---|---|---|---|---|---|---|
| A | 28122 | 19115 | 0 | 0 | 0.00% | 0.00% |  |
| B | 28122 | 19113 | 0 | 0 | 0.00% | 0.00% | 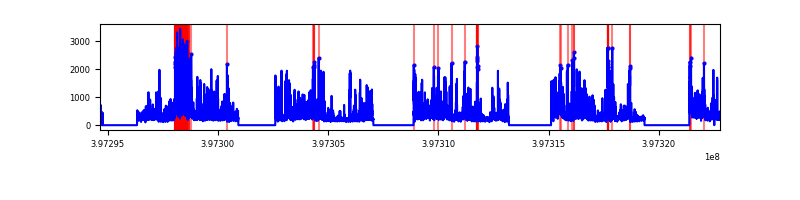 |
| C | 28122 | 19102 | 0 | 0 | 0.00% | 0.00% |  |
| D | 28122 | 19094 | 0 | 0 | 0.00% | 0.00% |  |
Top three noisy pixels from each quadrant. If the there are fewer than three noisy pixels in the level2.evt file, extra rows are filled as -1
| Pixel properties | Quadrant properties | ||||||
|---|---|---|---|---|---|---|---|
| Quadrant | DetID | PixID | Counts | Sigma | Mean | Median | Sigma |
| A | 7 | 110 | 955 | 8.87 | 302 | 285 | 75.6 |
| A | 0 | 29 | 918 | 8.38 | 302 | 285 | 75.6 |
| A | 9 | 19 | 899 | 8.13 | 302 | 285 | 75.6 |
| B | 2 | 9 | 849 | 10.24 | 282 | 271 | 56.4 |
| B | 3 | 80 | 834 | 9.98 | 282 | 271 | 56.4 |
| B | 3 | 17 | 777 | 8.97 | 282 | 271 | 56.4 |
| C | 1 | 81 | 948 | 8.87 | 291 | 275 | 75.8 |
| C | 1 | 80 | 925 | 8.57 | 291 | 275 | 75.8 |
| C | 3 | 202 | 829 | 7.3 | 291 | 275 | 75.8 |
| D | 7 | 3 | 737 | 6.59 | 270 | 248 | 74.2 |
| D | 4 | 160 | 729 | 6.48 | 270 | 248 | 74.2 |
| D | 12 | 6 | 707 | 6.19 | 270 | 248 | 74.2 |
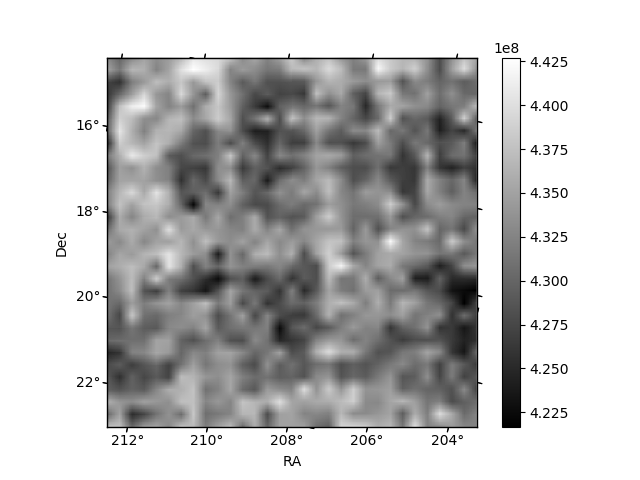
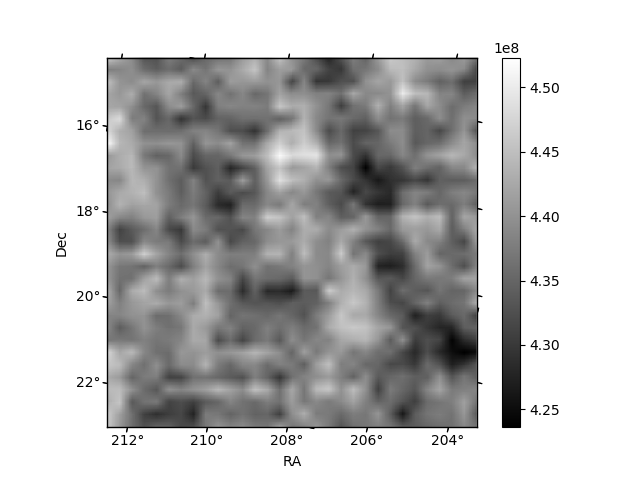
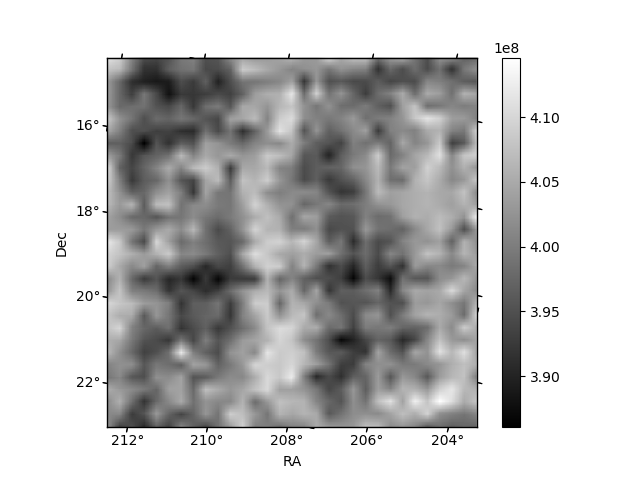
Histogram calculated using DETX and DETY for each event in the final _common_clean file
| Quadrant A | 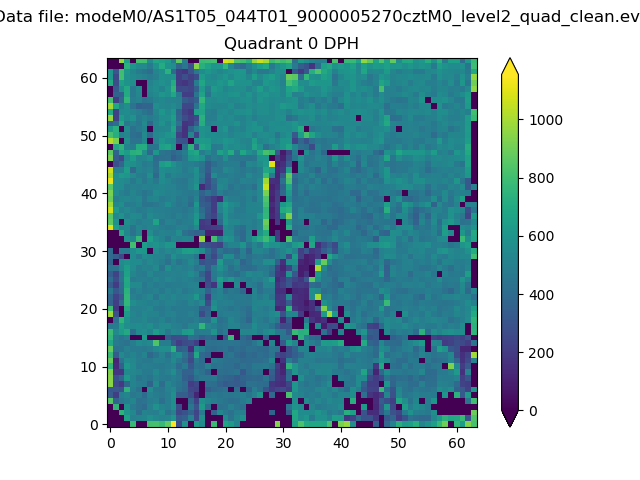 |
 |
Quadrant B |
|---|---|---|---|
| Quadrant D | 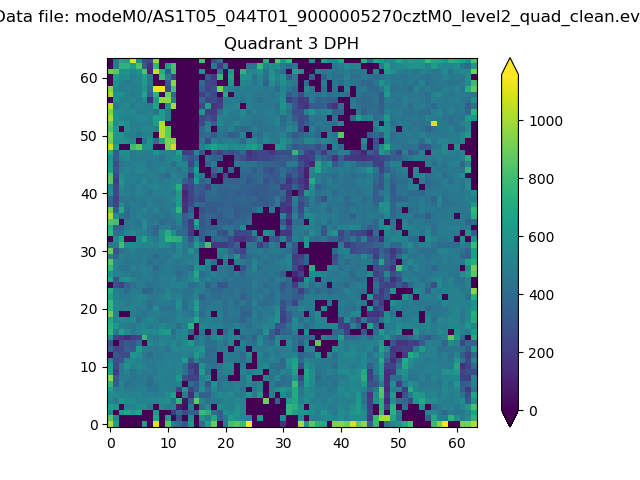 |
 |
Quadrant C |
| Plot type | Count rate plots | Images |
|---|---|---|
| Comparison with Poisson distribution Blue bars denote a histogram of data divided into 1 sec bins. Red curve is a Poisson curve with rate = median count rate of data. |
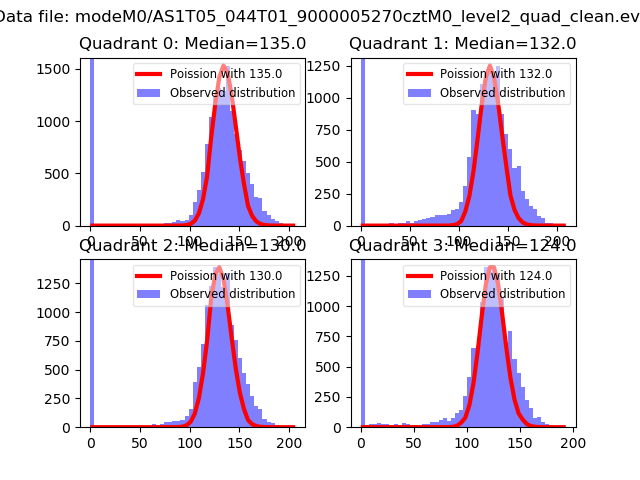 |
 |
| Quadrant-wise count rates Data is divided into 100 sec bins |
 |
|
| Module-wise count rates for Quadrant A Data is divided into 100 sec bins |
 |
 |
| Module-wise count rates for Quadrant B Data is divided into 100 sec bins |
 |
 |
| Module-wise count rates for Quadrant C Data is divided into 100 sec bins |
 |
 |
| Module-wise count rates for Quadrant D Data is divided into 100 sec bins |
 |
 |
| Parameter | Plot |
|---|---|
| CZT HV Monitor |  |
| D_VDD | 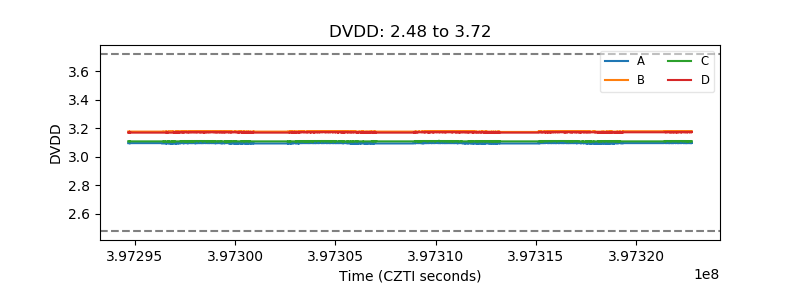 |
| Temperature 1 |  |
| Veto HV Monitor |  |
| Veto LLD | 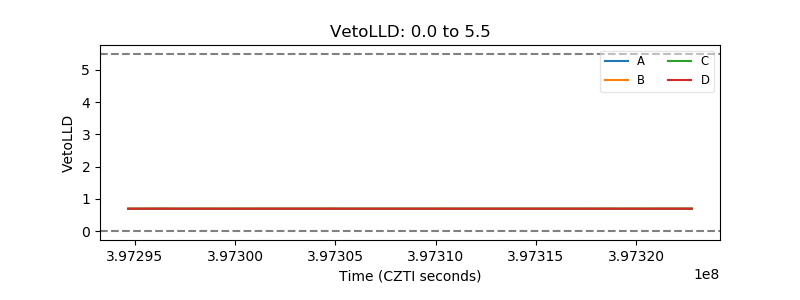 |
| Alpha Counter |  |
| _CPM_Rate |  |
| CZT Counter |  |
| +2.5 Volts monitor | 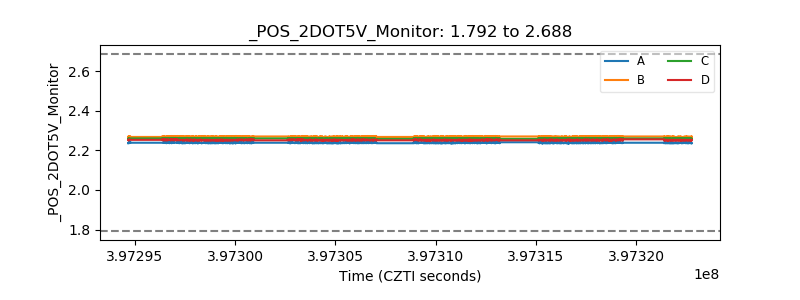 |
| +5 Volts monitor |  |
| _ROLL_ROT |  |
| _Roll_DEC | 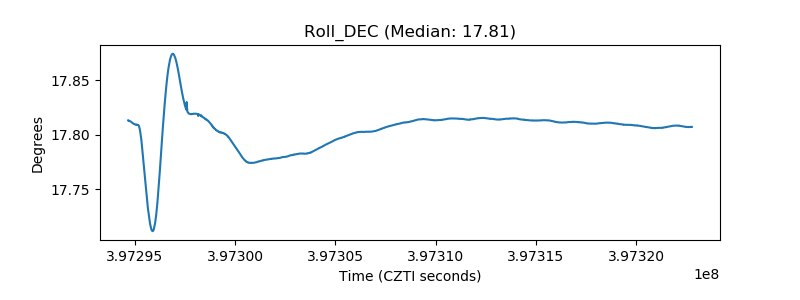 |
| _Roll_RA |  |
| Veto Counter |  |