| Param | Original file | Final file |
|---|---|---|
| Filename | modeM0/AS1T05_044T01_9000005270_37037cztM0_level2.evt | modeM0/AS1T05_044T01_9000005270_37037cztM0_level2_quad_clean.evt |
| Size (bytes) | 94,020,480 | 16,148,160 |
| Size | 89.7 MB | 15.4 MB |
| Events in quadrant A | 634,283 | 102,123 |
| Events in quadrant B | 726,899 | 104,203 |
| Events in quadrant C | 643,836 | 101,262 |
| Events in quadrant D | 764,060 | 96,303 |
| Mode M0 | |||
|---|---|---|---|
| Quadrant | BADHDUFLAG | Total packets | Discarded packets |
| A | 0 | 2579 | 28 |
| B | 0 | 2958 | 41 |
| C | 0 | 2573 | 49 |
| D | 0 | 3059 | 109 |
| Mode SS | |||
|---|---|---|---|
| Quadrant | BADHDUFLAG | Total packets | Discarded packets |
| A | 0 | 24 | 0 |
| B | 0 | 24 | 0 |
| C | 0 | 24 | 0 |
| D | 0 | 24 | 0 |
| Mode M9 | |||
|---|---|---|---|
| Quadrant | BADHDUFLAG | Total packets | Discarded packets |
| A | 0 | 16 | 1 |
| B | 0 | 16 | 3 |
| C | 0 | 16 | 0 |
| D | 0 | 16 | 1 |
| Quadrant | Total seconds | Saturated seconds | Saturation percentage |
|---|---|---|---|
| A | 1114 | 5 | 0.448833% |
| B | 1115 | 7 | 0.627803% |
| C | 1105 | 12 | 1.085973% |
| D | 1104 | 25 | 2.264493% |
Noise dominated data is calculated using 1-second bins in cleaned event files. If a bin has >2000 counts, and if more than 50% of those come from <1% of pixels, then it is considered to be noise-dominated and hence unusable.
| Quadrant | # 1 sec bins | Bins with >0 counts | Bins with >2000 counts | High rate bins dominated by noise | Noise dominated (total time) | Noise dominated (detector-on time) | Marked lightcurve |
|---|---|---|---|---|---|---|---|
| A | 2686 | 1124 | 0 | 0 | 0.00% | 0.00% | 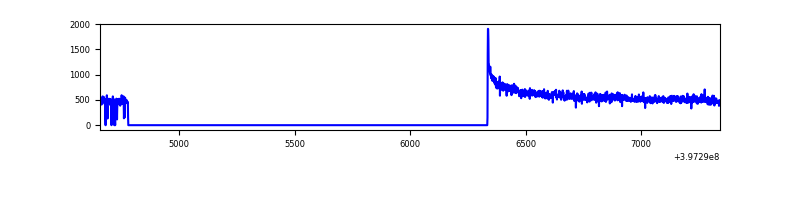 |
| B | 2686 | 1128 | 2 | 2 | 0.07% | 0.18% | 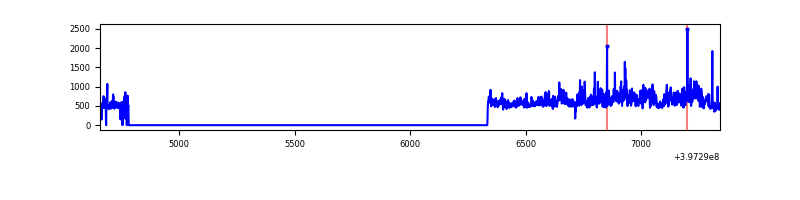 |
| C | 2686 | 1120 | 8 | 8 | 0.30% | 0.71% | 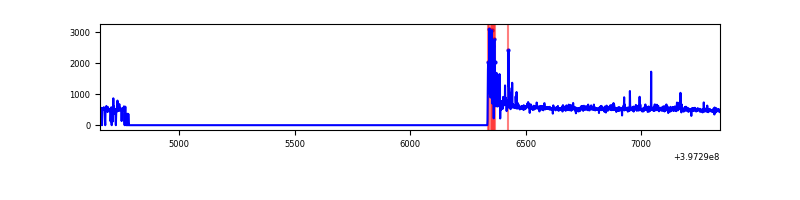 |
| D | 2686 | 1120 | 15 | 15 | 0.56% | 1.34% | 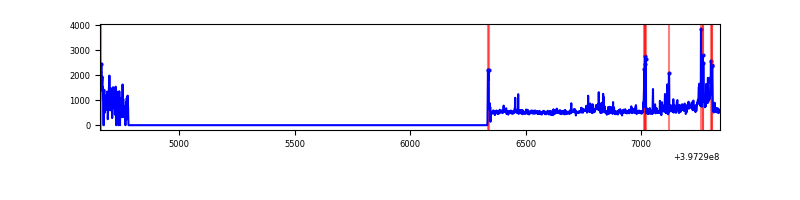 |
Top three noisy pixels from each quadrant. If the there are fewer than three noisy pixels in the level2.evt file, extra rows are filled as -1
| Pixel properties | Quadrant properties | ||||||
|---|---|---|---|---|---|---|---|
| Quadrant | DetID | PixID | Counts | Sigma | Mean | Median | Sigma |
| A | 10 | 83 | 82136 | 2672.49 | 141 | 138 | 30.7 |
| A | 13 | 6 | 3181 | 99.18 | 141 | 138 | 30.7 |
| A | 15 | 237 | 2319 | 71.08 | 141 | 138 | 30.7 |
| B | 0 | 190 | 143350 | 4892.36 | 138 | 134 | 29.3 |
| B | 5 | 172 | 29086 | 989.02 | 138 | 134 | 29.3 |
| B | 0 | 219 | 4898 | 162.74 | 138 | 134 | 29.3 |
| C | 15 | 214 | 51840 | 1564.31 | 133 | 133 | 33.1 |
| C | 0 | 10 | 38218 | 1152.2 | 133 | 133 | 33.1 |
| C | 0 | 207 | 27289 | 821.56 | 133 | 133 | 33.1 |
| D | 13 | 249 | 64696 | 1859.36 | 134 | 129 | 34.7 |
| D | 6 | 112 | 58843 | 1690.81 | 134 | 129 | 34.7 |
| D | 2 | 250 | 49276 | 1415.31 | 134 | 129 | 34.7 |
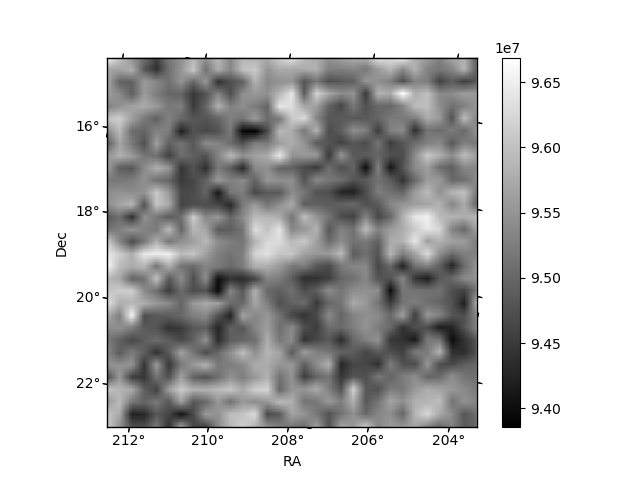
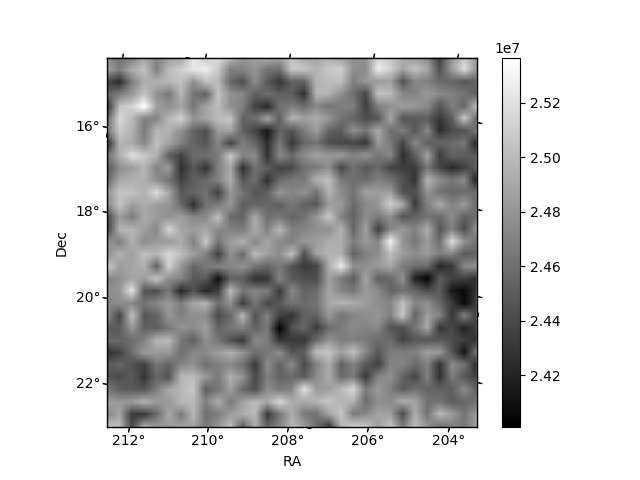
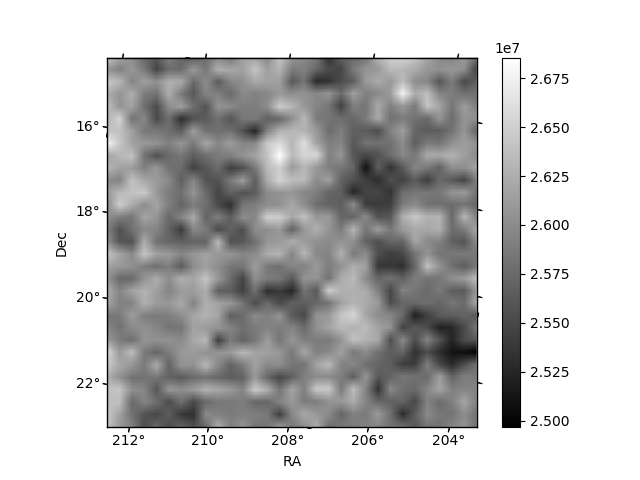
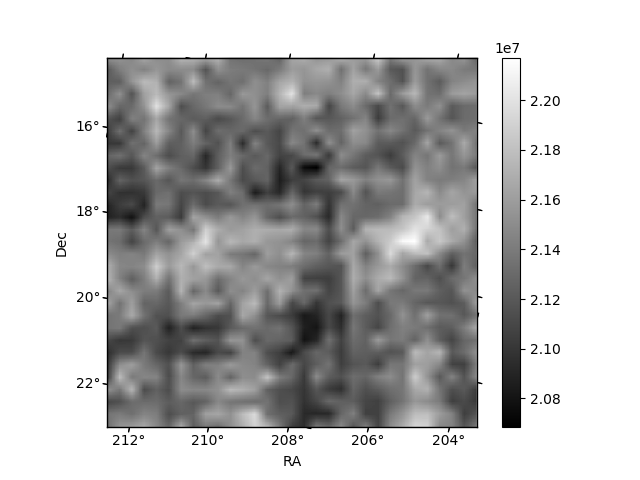
Histogram calculated using DETX and DETY for each event in the final _common_clean file
| Quadrant A | 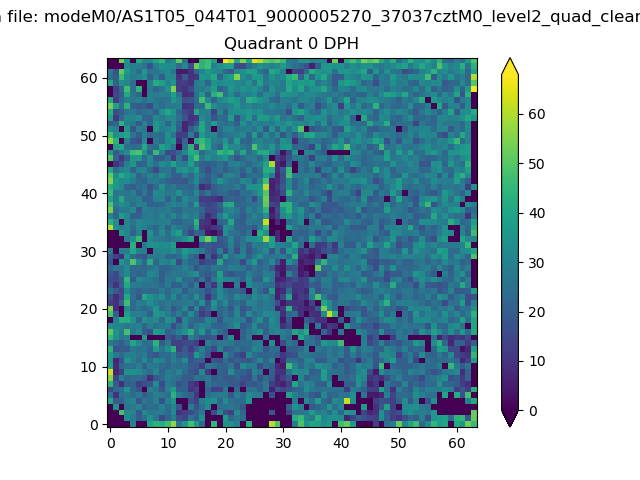 |
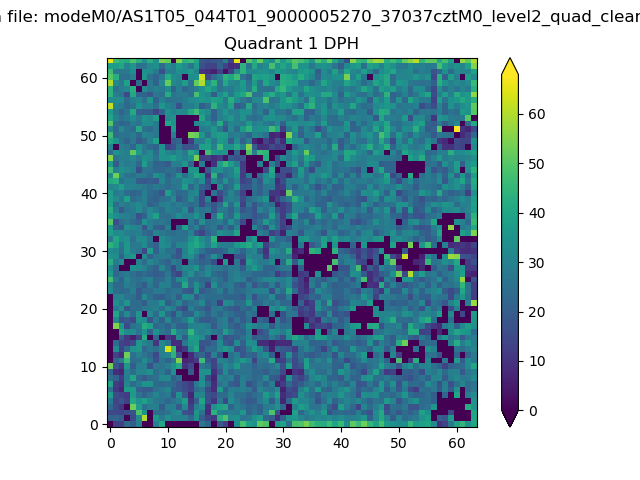 |
Quadrant B |
|---|---|---|---|
| Quadrant D | 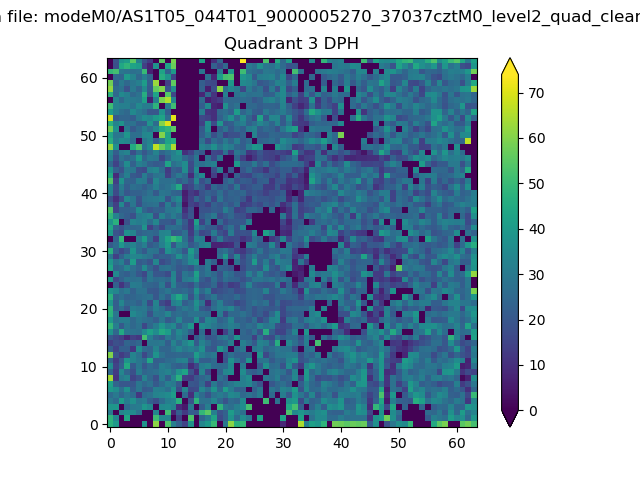 |
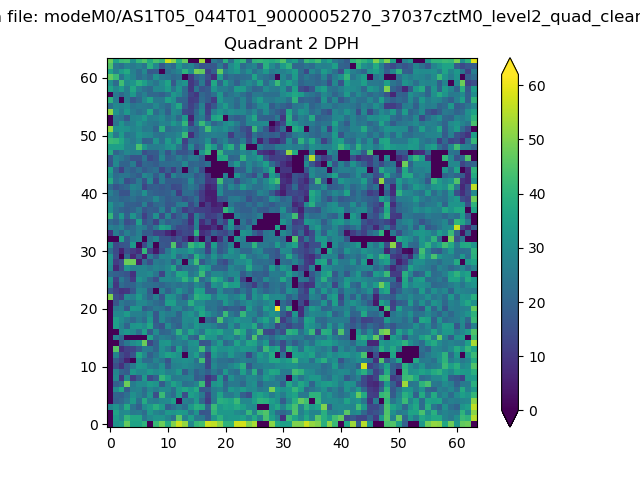 |
Quadrant C |
| Plot type | Count rate plots | Images |
|---|---|---|
| Comparison with Poisson distribution Blue bars denote a histogram of data divided into 1 sec bins. Red curve is a Poisson curve with rate = median count rate of data. |
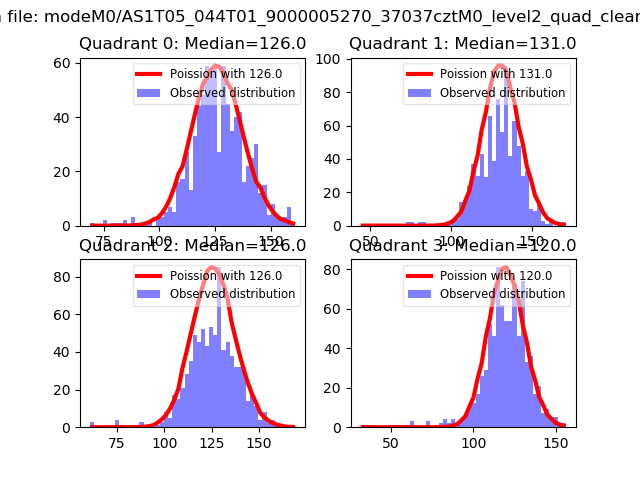 |
 |
| Quadrant-wise count rates Data is divided into 100 sec bins |
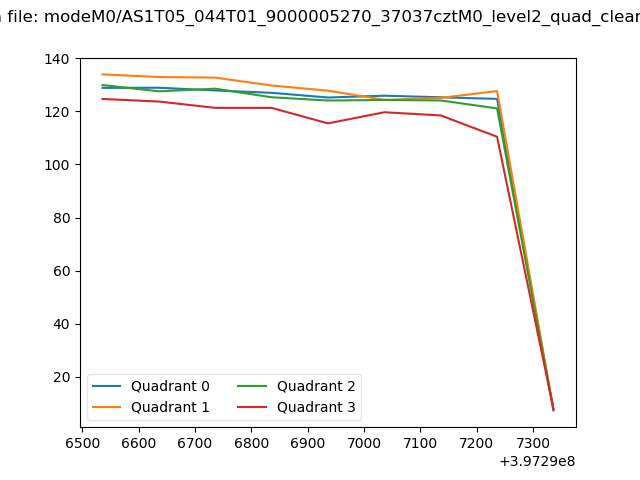 |
|
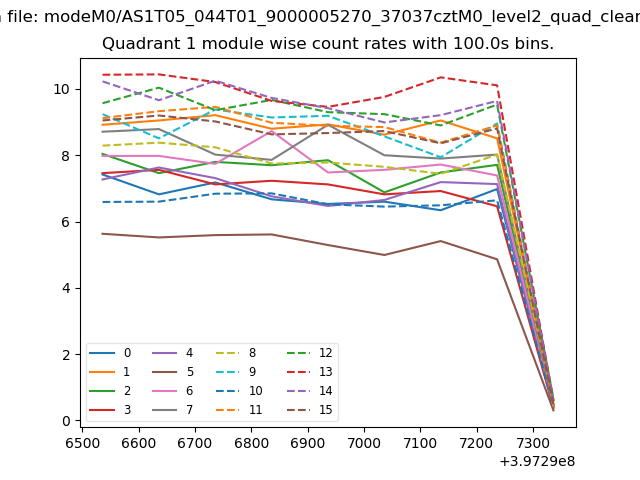
| Module-wise count rates for Quadrant A Data is divided into 100 sec bins |
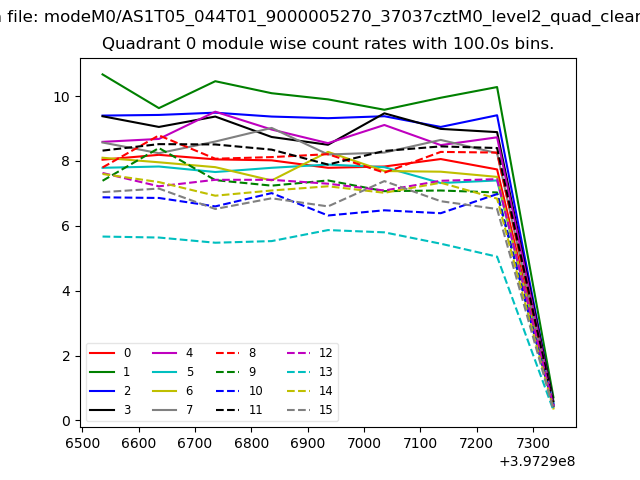 |
 |
| Module-wise count rates for Quadrant B Data is divided into 100 sec bins |
 |
 |
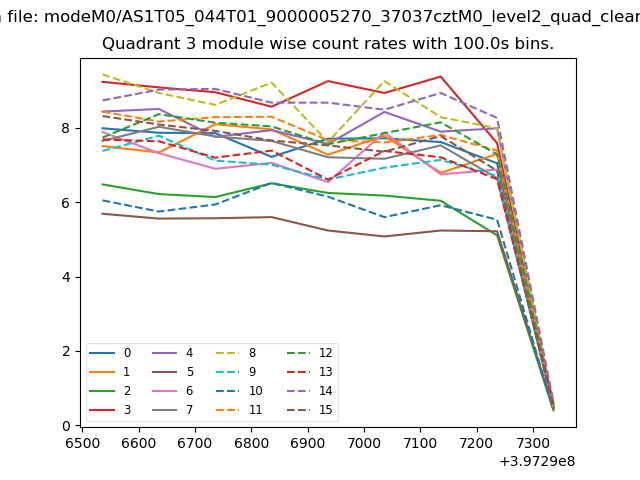
| Module-wise count rates for Quadrant C Data is divided into 100 sec bins |
 |
 |
| Module-wise count rates for Quadrant D Data is divided into 100 sec bins |
 |
 |
| Parameter | Plot |
|---|---|
| CZT HV Monitor | 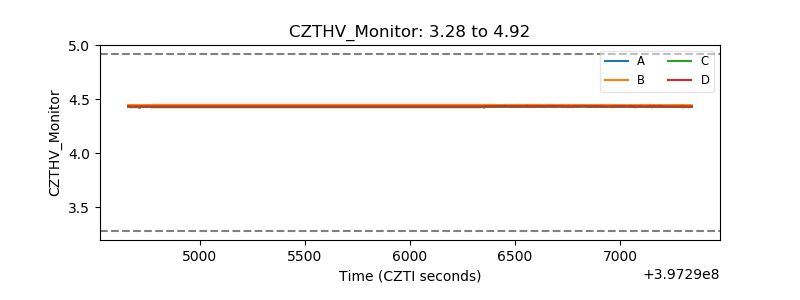 |
| D_VDD | 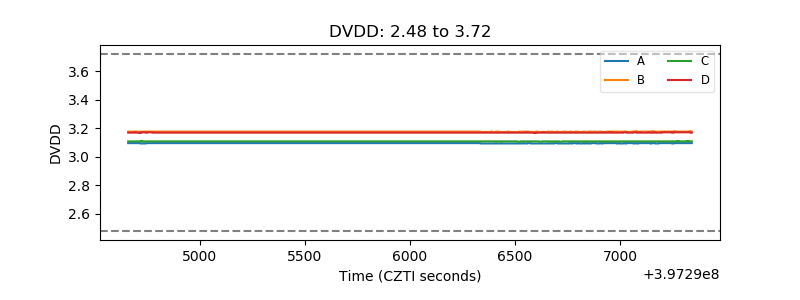 |
| Temperature 1 | 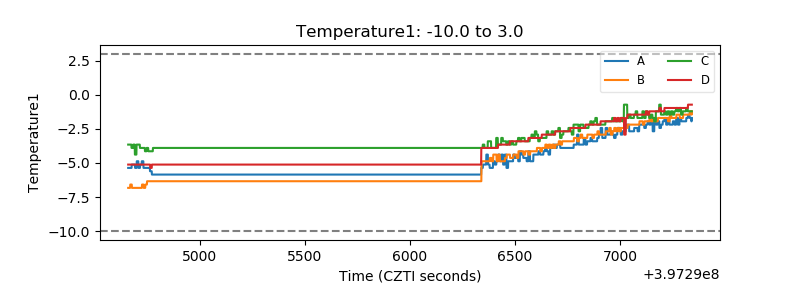 |
| Veto HV Monitor | 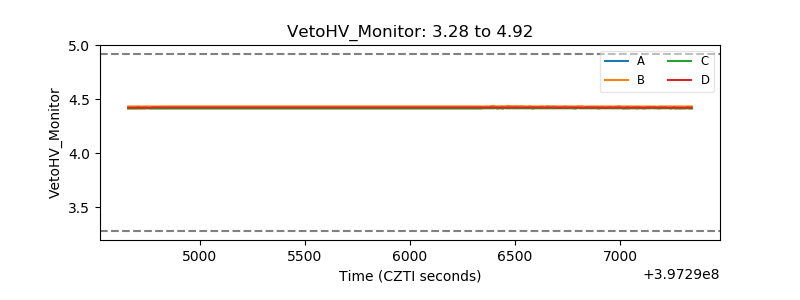 |
| Veto LLD | 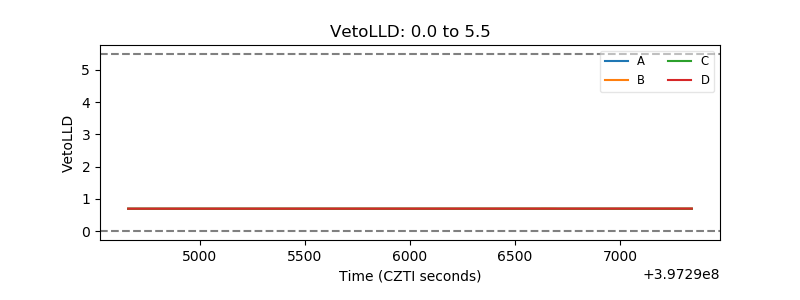 |
| Alpha Counter | 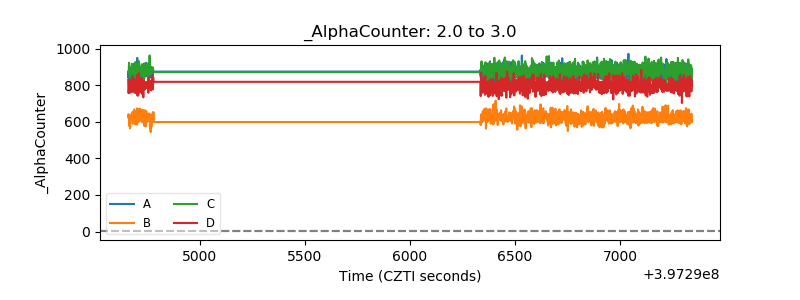 |
| _CPM_Rate | 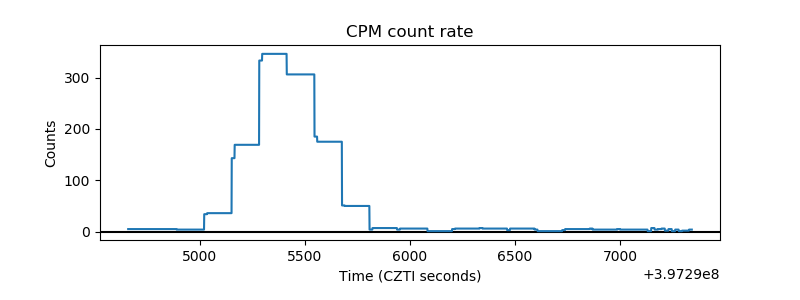 |
| CZT Counter | 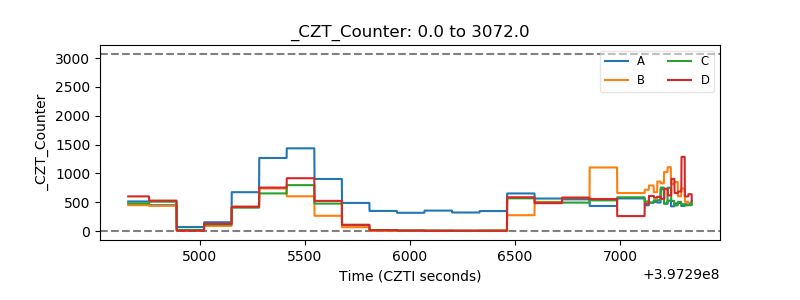 |
| +2.5 Volts monitor | 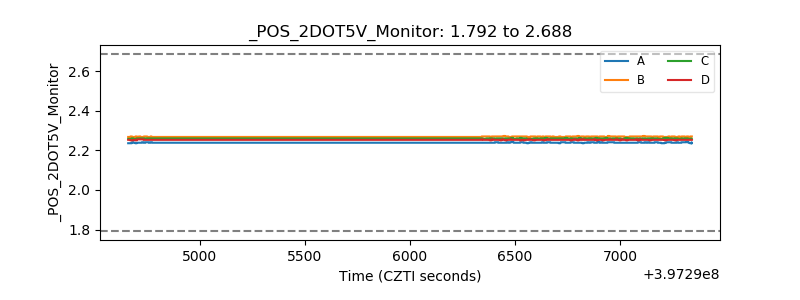 |
| +5 Volts monitor | 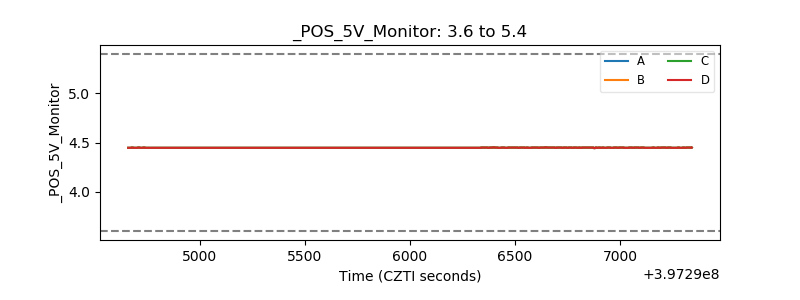 |
| _ROLL_ROT | 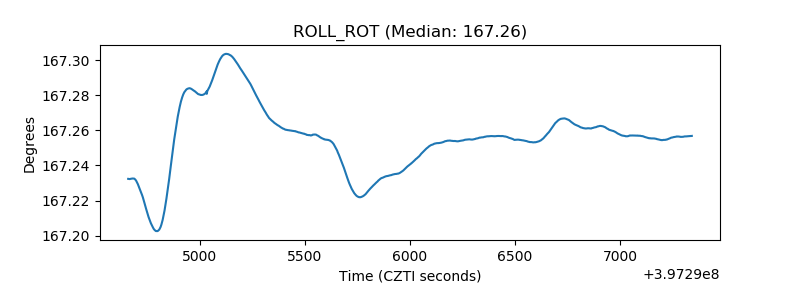 |
| _Roll_DEC | 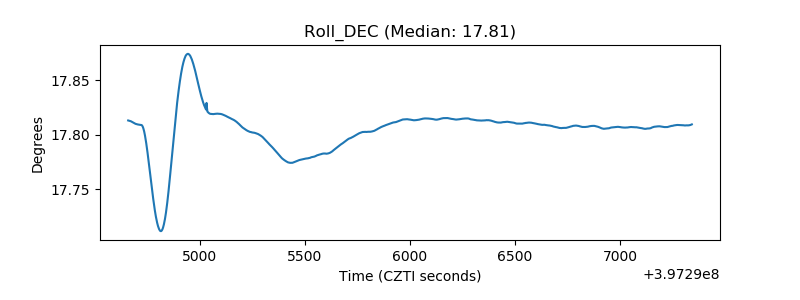 |
| _Roll_RA | 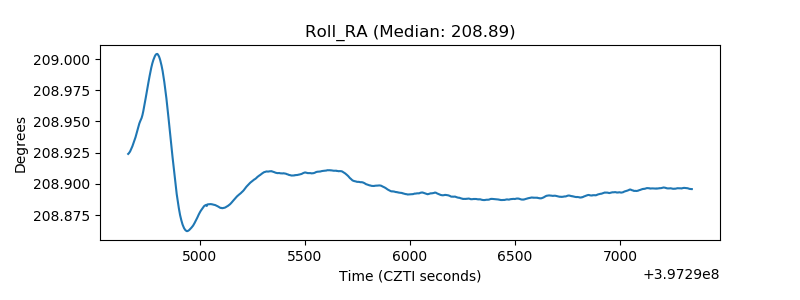 |
| Veto Counter | 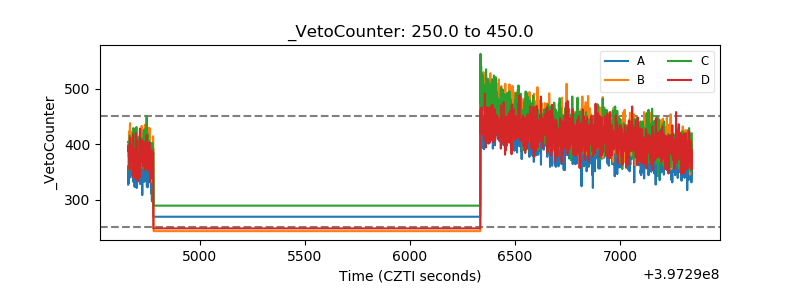 |