| Param | Original file | Final file |
|---|---|---|
| Filename | modeM0/AS1T05_044T01_9000005270_37038cztM0_level2.evt | modeM0/AS1T05_044T01_9000005270_37038cztM0_level2_quad_clean.evt |
| Size (bytes) | 500,235,840 | 89,605,440 |
| Size | 477.1 MB | 85.5 MB |
| Events in quadrant A | 2,910,988 | 599,513 |
| Events in quadrant B | 4,785,398 | 572,875 |
| Events in quadrant C | 3,230,128 | 586,459 |
| Events in quadrant D | 3,834,797 | 554,263 |
| Mode M0 | |||
|---|---|---|---|
| Quadrant | BADHDUFLAG | Total packets | Discarded packets |
| A | 0 | 12209 | 3 |
| B | 0 | 18024 | 2 |
| C | 0 | 12987 | 2 |
| D | 0 | 15042 | 2 |
| Mode SS | |||
|---|---|---|---|
| Quadrant | BADHDUFLAG | Total packets | Discarded packets |
| A | 0 | 118 | 0 |
| B | 0 | 118 | 0 |
| C | 0 | 118 | 0 |
| D | 0 | 118 | 0 |
| Mode M9 | |||
|---|---|---|---|
| Quadrant | BADHDUFLAG | Total packets | Discarded packets |
| A | 0 | 25 | 0 |
| B | 0 | 25 | 0 |
| C | 0 | 25 | 0 |
| D | 0 | 26 | 0 |
| Quadrant | Total seconds | Saturated seconds | Saturation percentage |
|---|---|---|---|
| A | 5721 | 11 | 0.192274% |
| B | 5721 | 493 | 8.617375% |
| C | 5721 | 45 | 0.786576% |
| D | 5721 | 149 | 2.604440% |
Noise dominated data is calculated using 1-second bins in cleaned event files. If a bin has >2000 counts, and if more than 50% of those come from <1% of pixels, then it is considered to be noise-dominated and hence unusable.
| Quadrant | # 1 sec bins | Bins with >0 counts | Bins with >2000 counts | High rate bins dominated by noise | Noise dominated (total time) | Noise dominated (detector-on time) | Marked lightcurve |
|---|---|---|---|---|---|---|---|
| A | 7395 | 5722 | 1 | 1 | 0.01% | 0.02% | 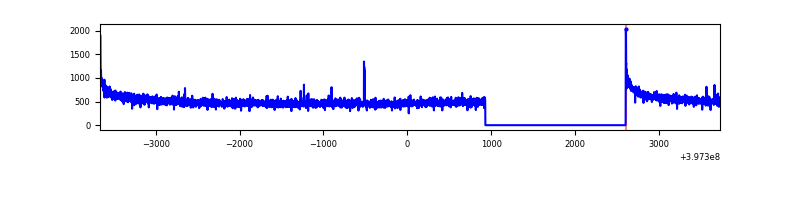 |
| B | 7395 | 5722 | 423 | 423 | 5.72% | 7.39% | 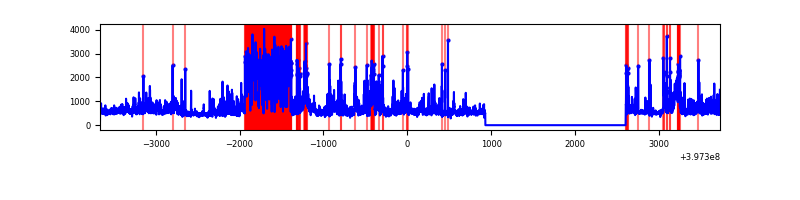 |
| C | 7395 | 5722 | 42 | 42 | 0.57% | 0.73% | 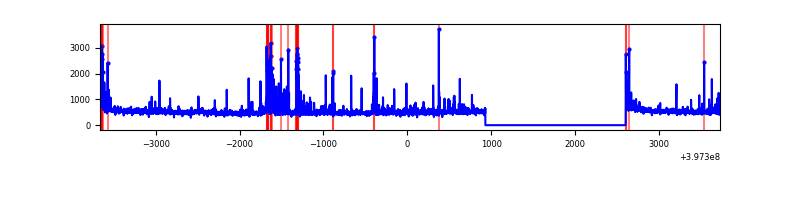 |
| D | 7395 | 5722 | 135 | 135 | 1.83% | 2.36% | 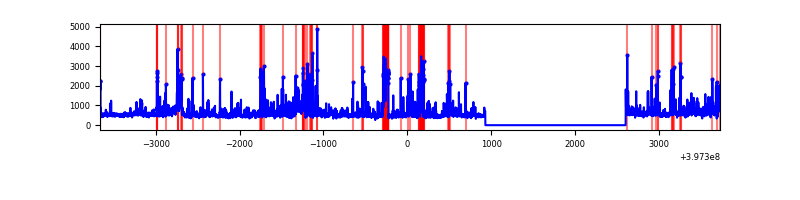 |
Top three noisy pixels from each quadrant. If the there are fewer than three noisy pixels in the level2.evt file, extra rows are filled as -1
| Pixel properties | Quadrant properties | ||||||
|---|---|---|---|---|---|---|---|
| Quadrant | DetID | PixID | Counts | Sigma | Mean | Median | Sigma |
| A | 10 | 83 | 268547 | 1954.3 | 675 | 662 | 137.1 |
| A | 13 | 6 | 16691 | 116.94 | 675 | 662 | 137.1 |
| A | 13 | 254 | 9155 | 61.96 | 675 | 662 | 137.1 |
| B | 0 | 182 | 786482 | 6360.21 | 645 | 630 | 123.6 |
| B | 0 | 213 | 684697 | 5536.42 | 645 | 630 | 123.6 |
| B | 0 | 190 | 371033 | 2997.82 | 645 | 630 | 123.6 |
| C | 15 | 214 | 246480 | 1618.91 | 647 | 652 | 151.8 |
| C | 0 | 207 | 239653 | 1573.95 | 647 | 652 | 151.8 |
| C | 0 | 10 | 97580 | 638.32 | 647 | 652 | 151.8 |
| D | 2 | 249 | 425243 | 2674.48 | 647 | 630 | 158.8 |
| D | 12 | 235 | 276926 | 1740.28 | 647 | 630 | 158.8 |
| D | 2 | 250 | 186617 | 1171.46 | 647 | 630 | 158.8 |
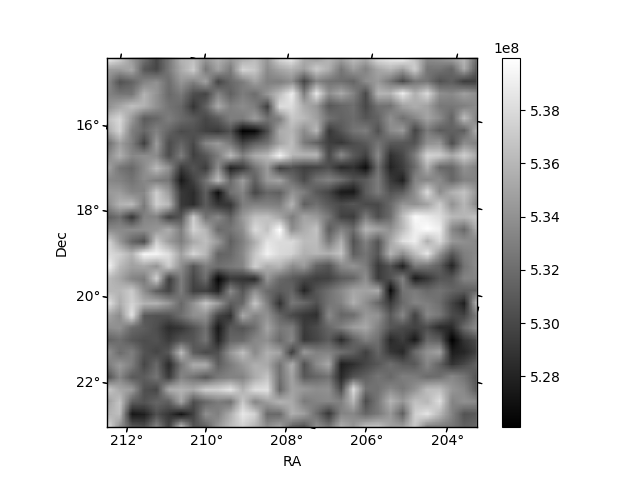
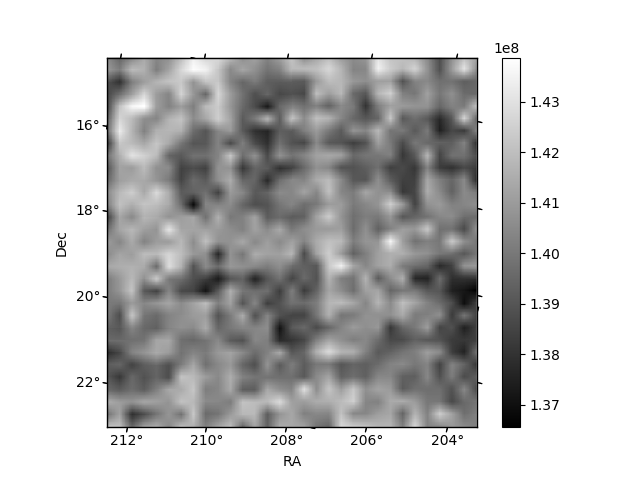
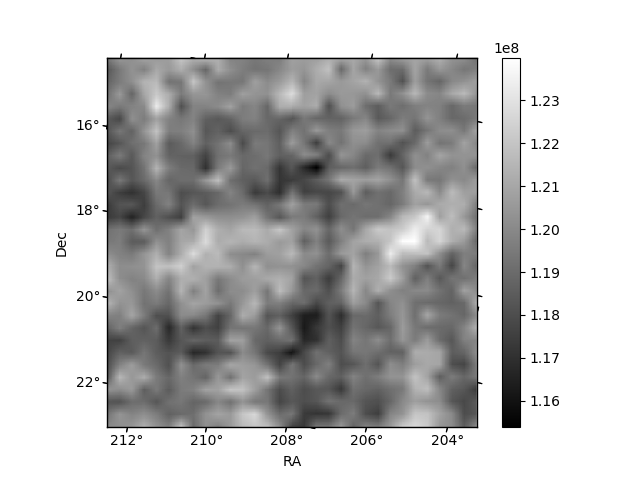
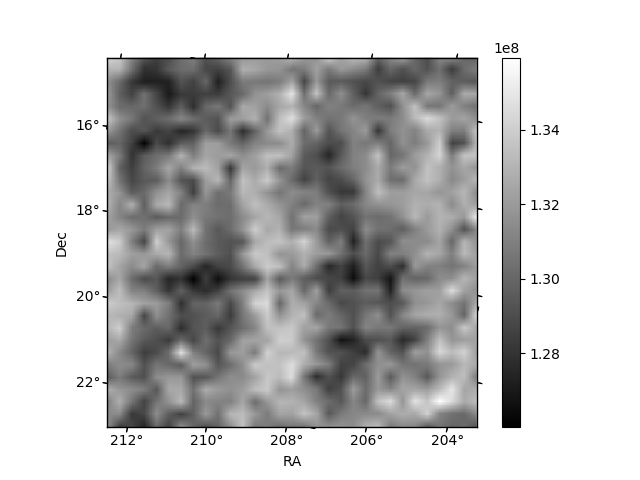
Histogram calculated using DETX and DETY for each event in the final _common_clean file
| Quadrant A | 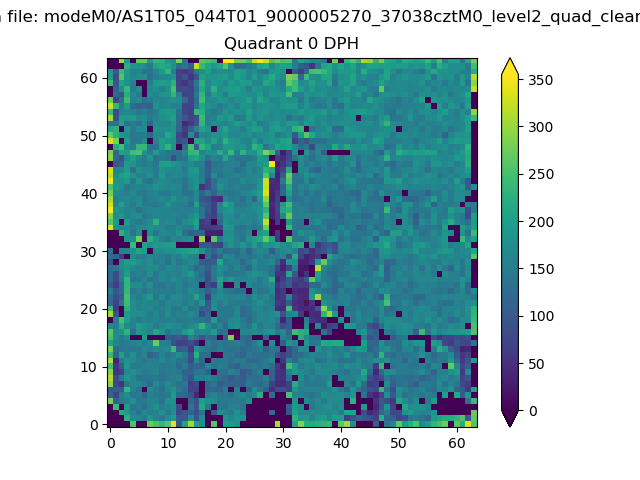 |
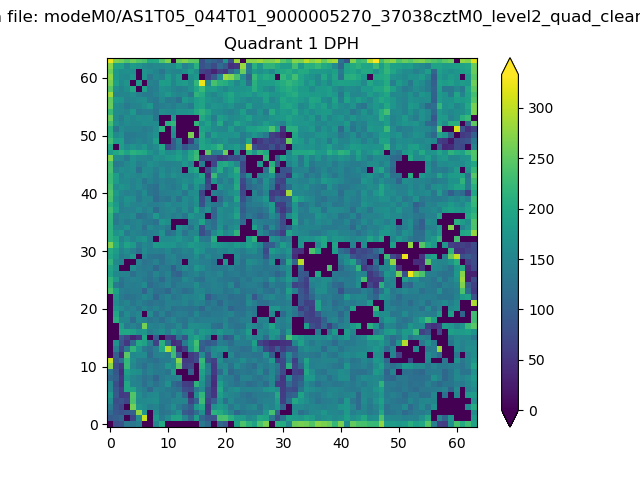 |
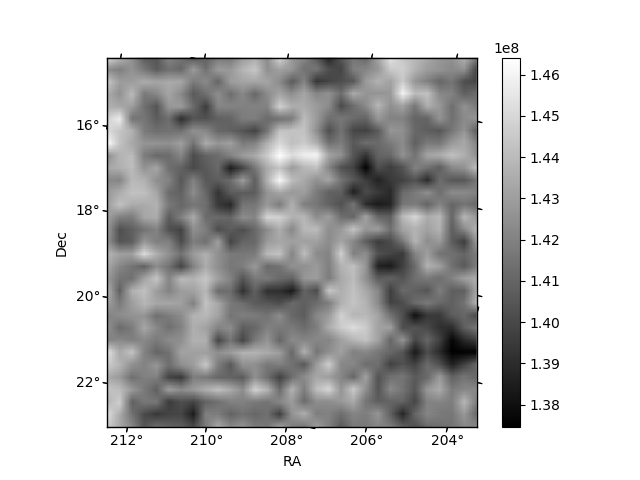
Quadrant B |
|---|---|---|---|
| Quadrant D | 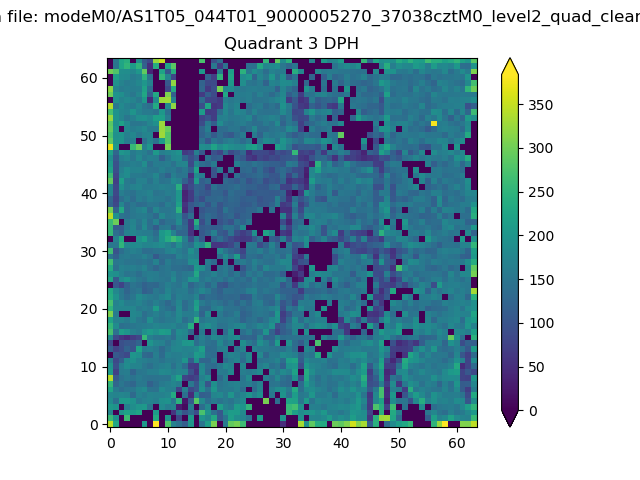 |
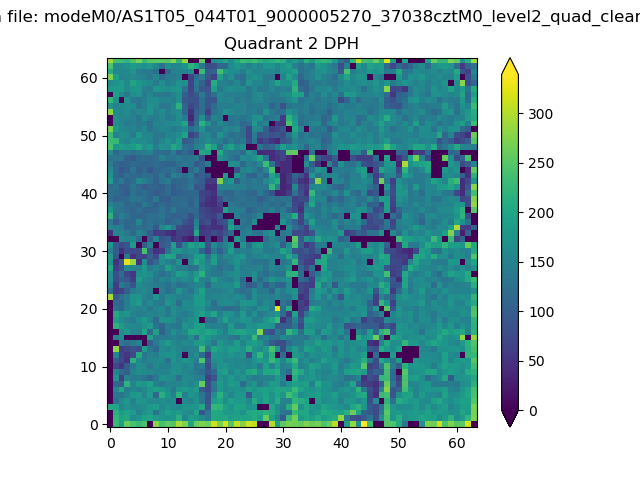 |
Quadrant C |
| Plot type | Count rate plots | Images |
|---|---|---|
| Comparison with Poisson distribution Blue bars denote a histogram of data divided into 1 sec bins. Red curve is a Poisson curve with rate = median count rate of data. |
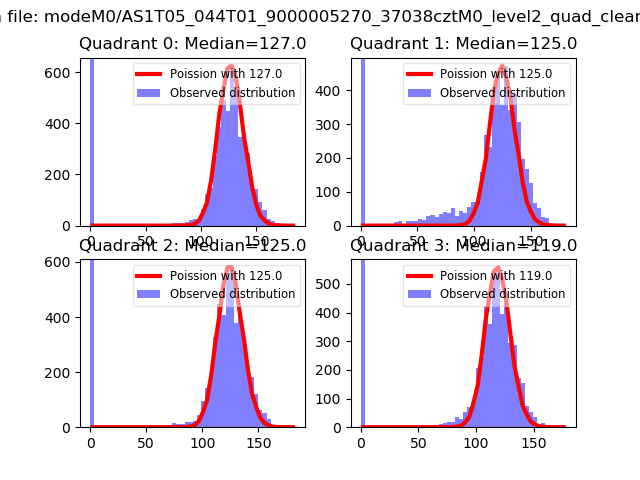 |
 |
| Quadrant-wise count rates Data is divided into 100 sec bins |
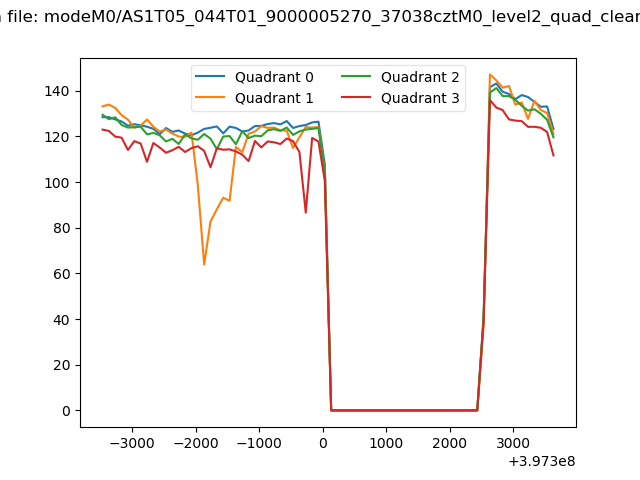 |
|
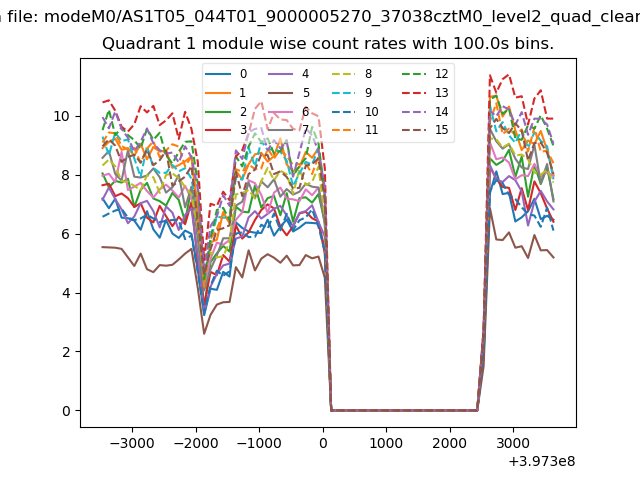
| Module-wise count rates for Quadrant A Data is divided into 100 sec bins |
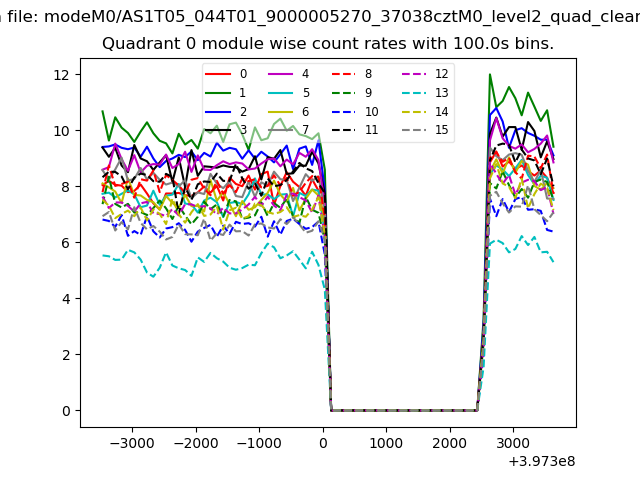 |
 |
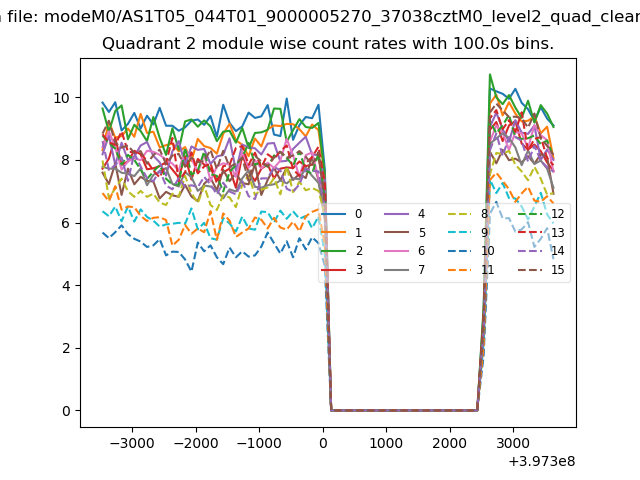
| Module-wise count rates for Quadrant B Data is divided into 100 sec bins |
 |
 |
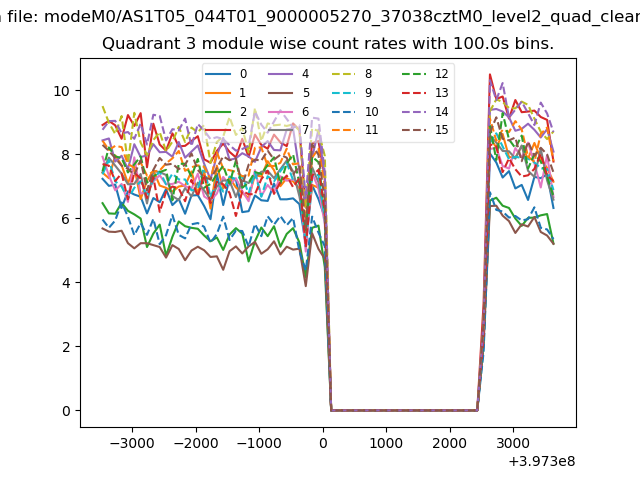
| Module-wise count rates for Quadrant C Data is divided into 100 sec bins |
 |
 |
| Module-wise count rates for Quadrant D Data is divided into 100 sec bins |
 |
 |
| Parameter | Plot |
|---|---|
| CZT HV Monitor |  |
| D_VDD | 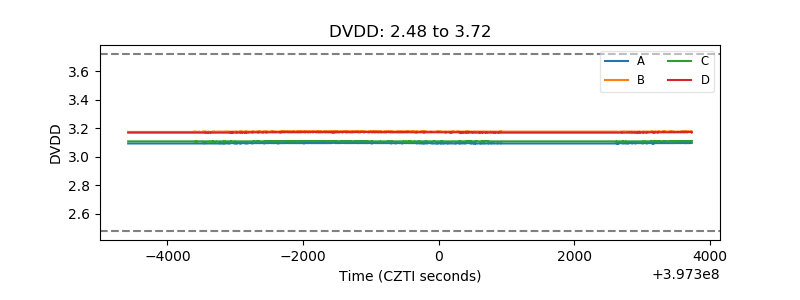 |
| Temperature 1 | 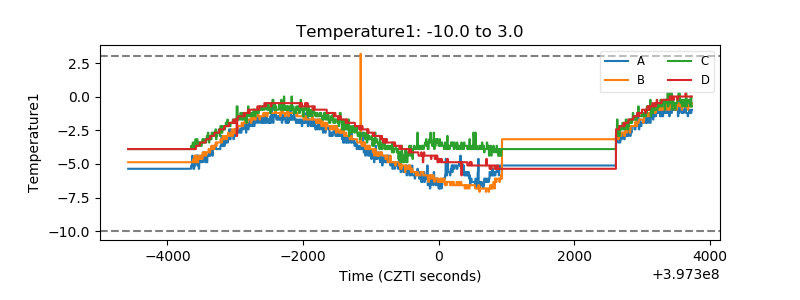 |
| Veto HV Monitor | 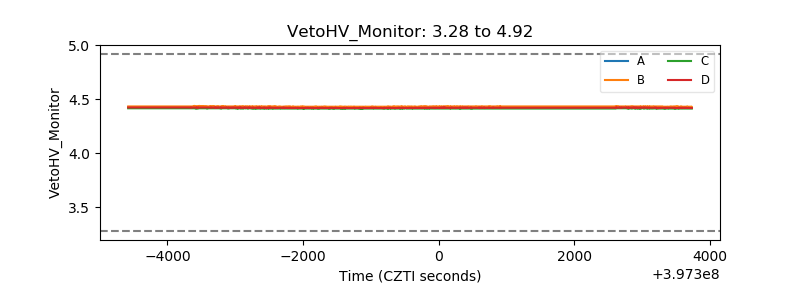 |
| Veto LLD | 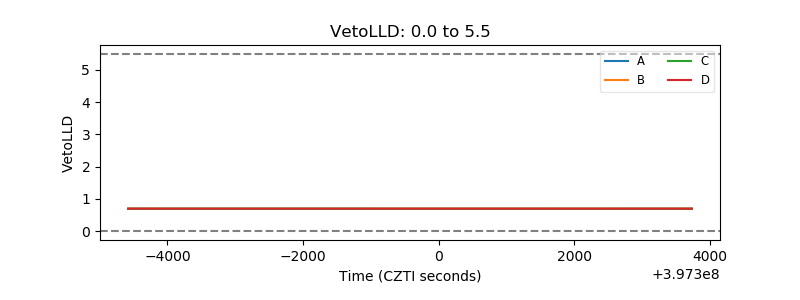 |
| Alpha Counter | 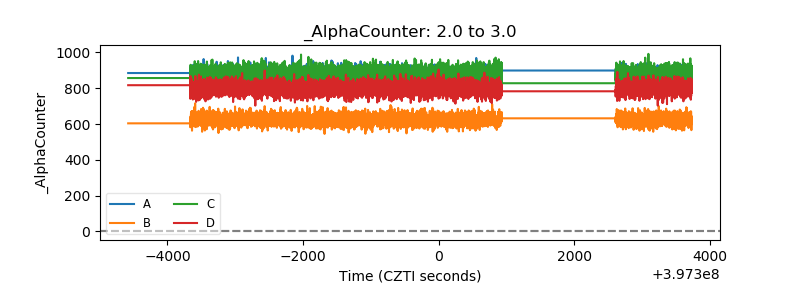 |
| _CPM_Rate | 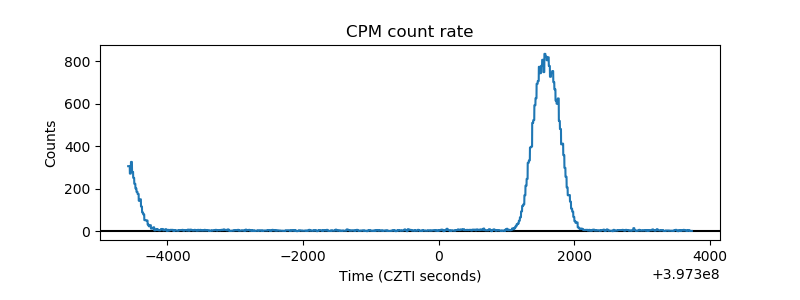 |
| CZT Counter | 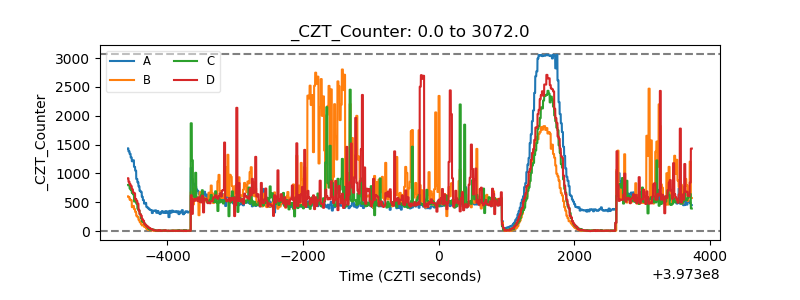 |
| +2.5 Volts monitor | 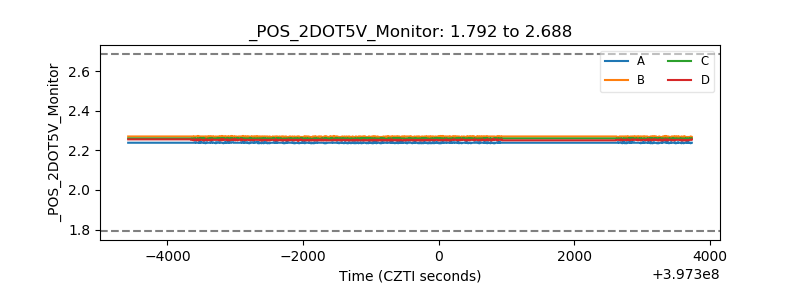 |
| +5 Volts monitor | 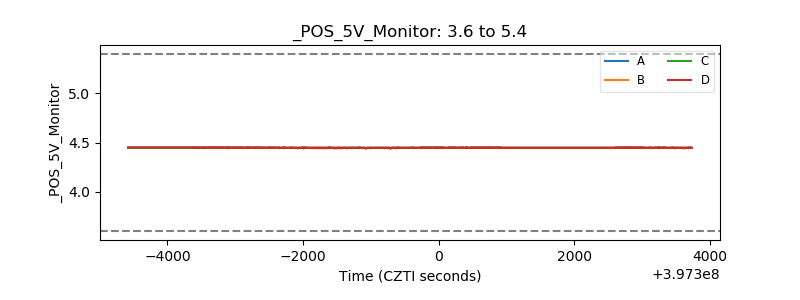 |
| _ROLL_ROT | 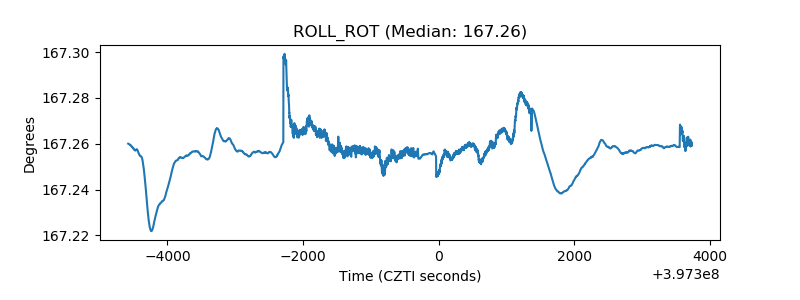 |
| _Roll_DEC | 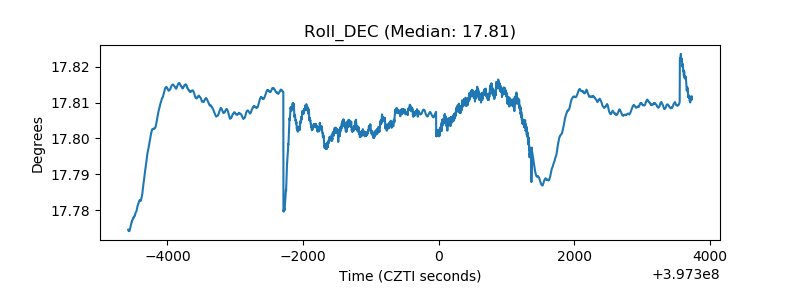 |
| _Roll_RA | 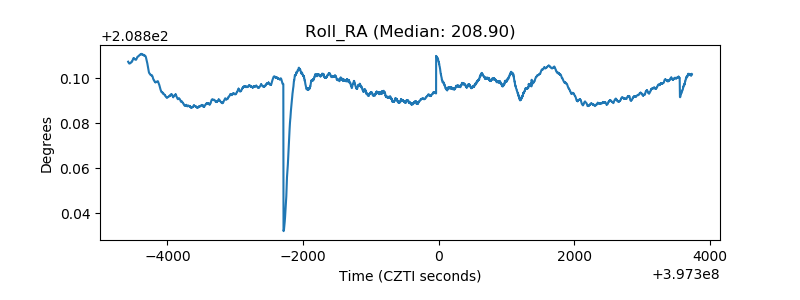 |
| Veto Counter | 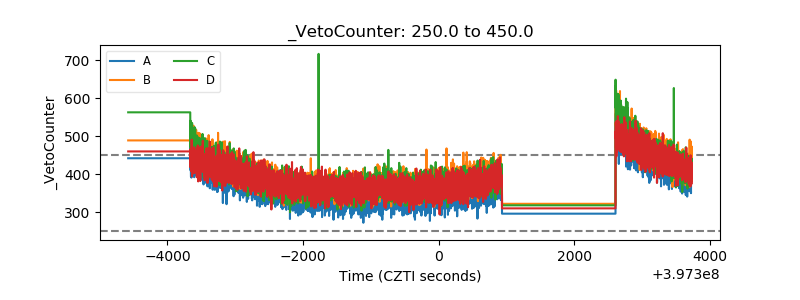 |