| Param | Original file | Final file |
|---|---|---|
| Filename | modeM0/AS1T05_044T01_9000005270_37040cztM0_level2.evt | modeM0/AS1T05_044T01_9000005270_37040cztM0_level2_quad_clean.evt |
| Size (bytes) | 464,832,000 | 88,649,280 |
| Size | 443.3 MB | 84.5 MB |
| Events in quadrant A | 2,934,416 | 594,910 |
| Events in quadrant B | 4,028,682 | 577,124 |
| Events in quadrant C | 3,107,538 | 576,092 |
| Events in quadrant D | 3,634,530 | 552,335 |
| Mode M0 | |||
|---|---|---|---|
| Quadrant | BADHDUFLAG | Total packets | Discarded packets |
| A | 0 | 12174 | 3 |
| B | 0 | 15678 | 2 |
| C | 0 | 12497 | 2 |
| D | 0 | 14444 | 2 |
| Mode SS | |||
|---|---|---|---|
| Quadrant | BADHDUFLAG | Total packets | Discarded packets |
| A | 0 | 112 | 0 |
| B | 0 | 112 | 0 |
| C | 0 | 112 | 0 |
| D | 0 | 112 | 0 |
| Mode M9 | |||
|---|---|---|---|
| Quadrant | BADHDUFLAG | Total packets | Discarded packets |
| A | 0 | 23 | 0 |
| B | 0 | 23 | 0 |
| C | 0 | 23 | 0 |
| D | 0 | 24 | 0 |
| Quadrant | Total seconds | Saturated seconds | Saturation percentage |
|---|---|---|---|
| A | 5488 | 17 | 0.309767% |
| B | 5488 | 263 | 4.792274% |
| C | 5488 | 33 | 0.601312% |
| D | 5488 | 89 | 1.621720% |
Noise dominated data is calculated using 1-second bins in cleaned event files. If a bin has >2000 counts, and if more than 50% of those come from <1% of pixels, then it is considered to be noise-dominated and hence unusable.
| Quadrant | # 1 sec bins | Bins with >0 counts | Bins with >2000 counts | High rate bins dominated by noise | Noise dominated (total time) | Noise dominated (detector-on time) | Marked lightcurve |
|---|---|---|---|---|---|---|---|
| A | 7311 | 5489 | 4 | 4 | 0.05% | 0.07% | 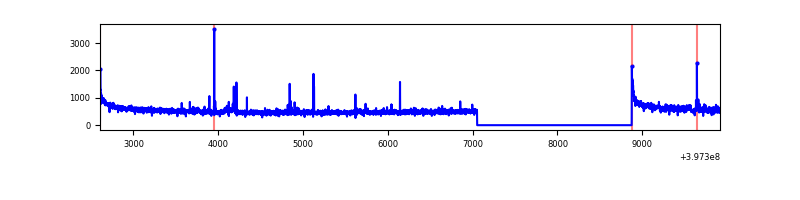 |
| B | 7311 | 5489 | 179 | 179 | 2.45% | 3.26% | 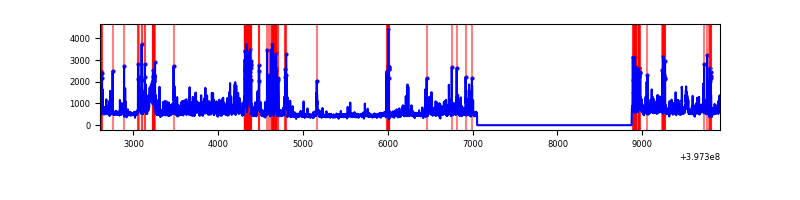 |
| C | 7311 | 5489 | 30 | 30 | 0.41% | 0.55% | 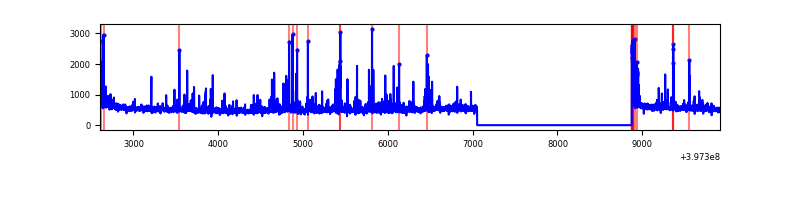 |
| D | 7311 | 5489 | 72 | 72 | 0.98% | 1.31% | 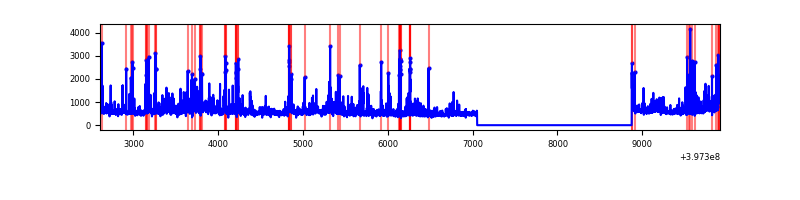 |
Top three noisy pixels from each quadrant. If the there are fewer than three noisy pixels in the level2.evt file, extra rows are filled as -1
| Pixel properties | Quadrant properties | ||||||
|---|---|---|---|---|---|---|---|
| Quadrant | DetID | PixID | Counts | Sigma | Mean | Median | Sigma |
| A | 10 | 83 | 276753 | 2076.72 | 659 | 646 | 133.0 |
| A | 11 | 254 | 51161 | 379.94 | 659 | 646 | 133.0 |
| A | 13 | 248 | 29015 | 213.38 | 659 | 646 | 133.0 |
| B | 5 | 172 | 306782 | 2541.99 | 637 | 622 | 120.4 |
| B | 0 | 190 | 300673 | 2491.26 | 637 | 622 | 120.4 |
| B | 5 | 184 | 266656 | 2208.83 | 637 | 622 | 120.4 |
| C | 15 | 214 | 237213 | 1618.71 | 630 | 636 | 146.2 |
| C | 14 | 254 | 139454 | 949.82 | 630 | 636 | 146.2 |
| C | 0 | 10 | 115731 | 787.5 | 630 | 636 | 146.2 |
| D | 12 | 235 | 463359 | 2984.2 | 635 | 617 | 155.1 |
| D | 2 | 153 | 194021 | 1247.25 | 635 | 617 | 155.1 |
| D | 2 | 250 | 136729 | 877.78 | 635 | 617 | 155.1 |
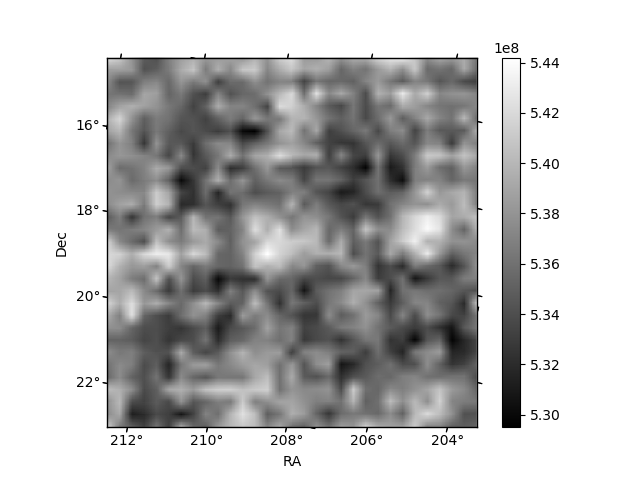
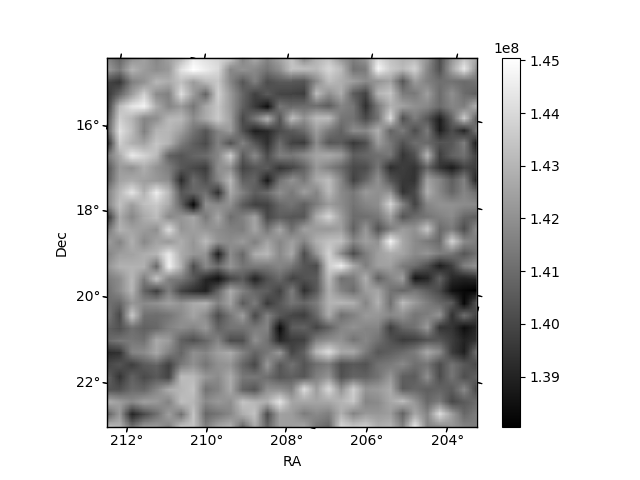
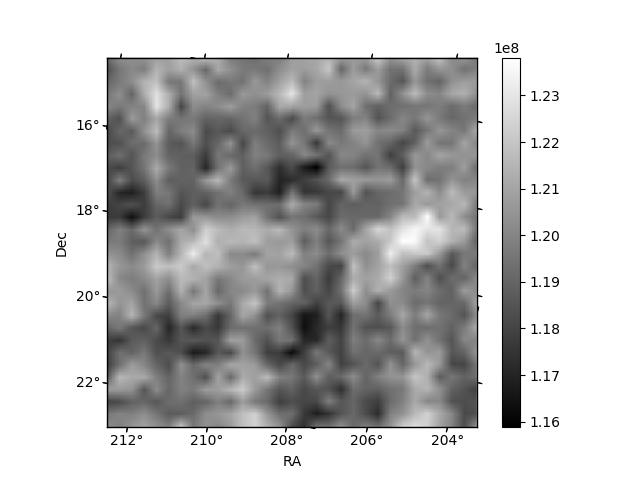
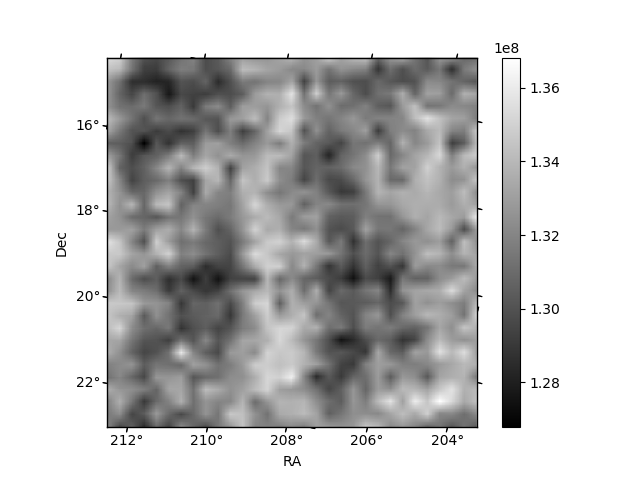
Histogram calculated using DETX and DETY for each event in the final _common_clean file
| Quadrant A | 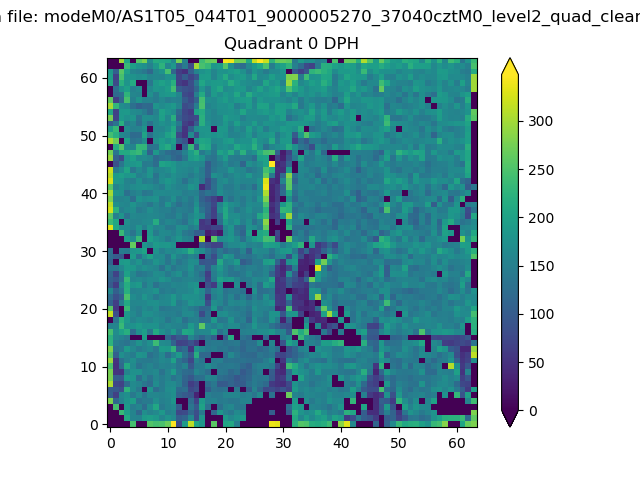 |
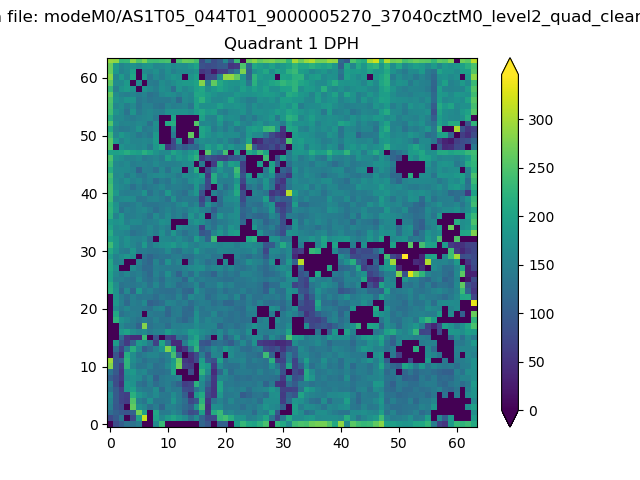 |
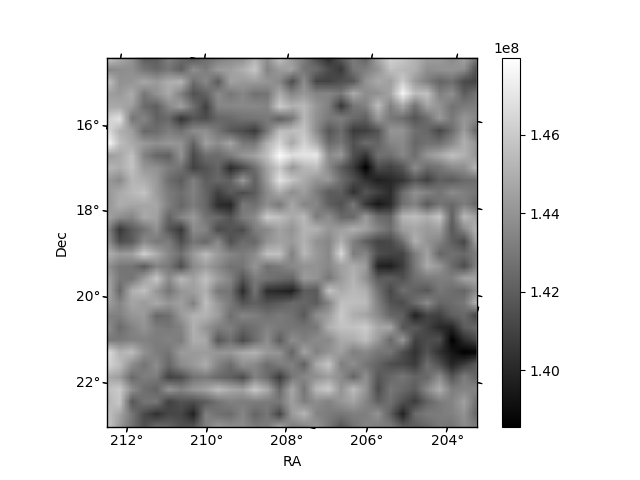
Quadrant B |
|---|---|---|---|
| Quadrant D | 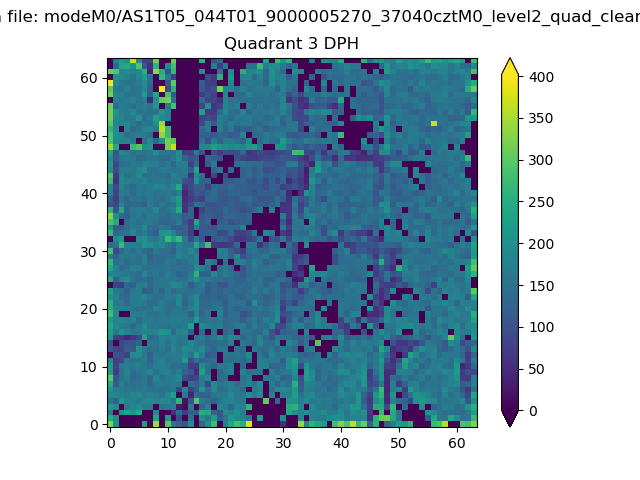 |
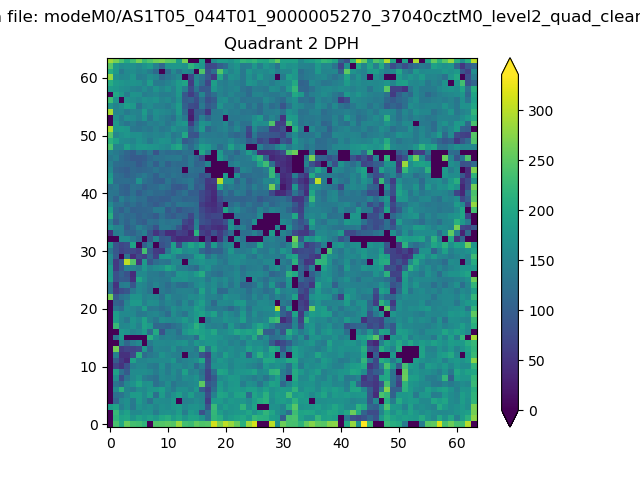 |
Quadrant C |
| Plot type | Count rate plots | Images |
|---|---|---|
| Comparison with Poisson distribution Blue bars denote a histogram of data divided into 1 sec bins. Red curve is a Poisson curve with rate = median count rate of data. |
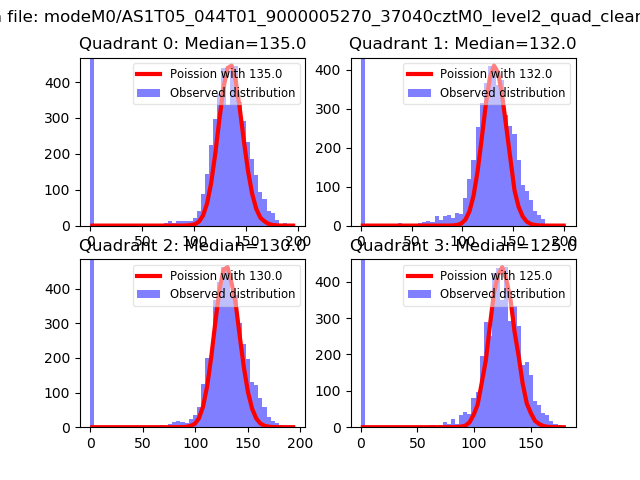 |
 |
| Quadrant-wise count rates Data is divided into 100 sec bins |
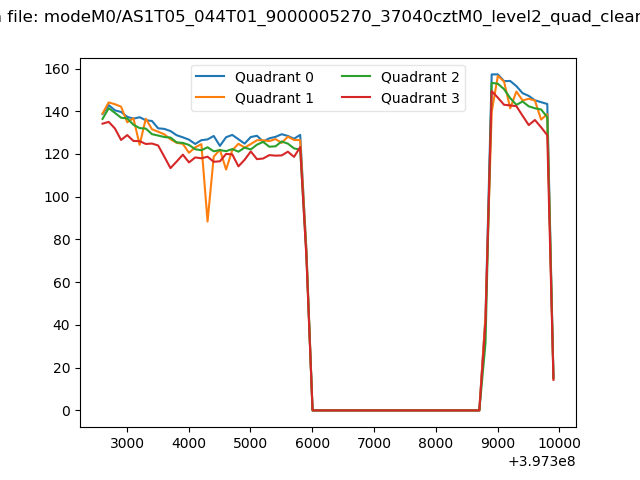 |
|
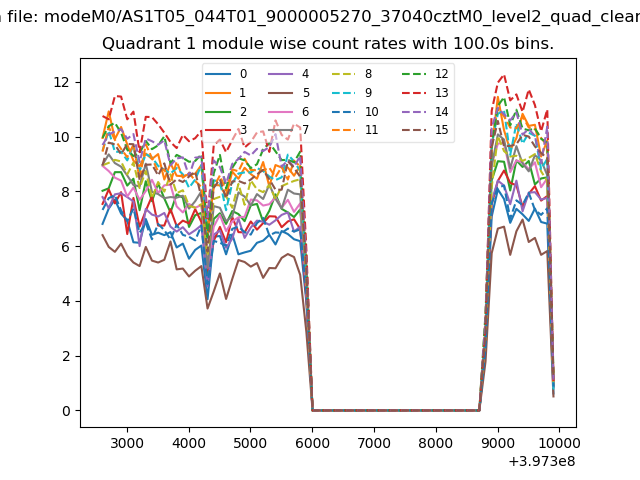
| Module-wise count rates for Quadrant A Data is divided into 100 sec bins |
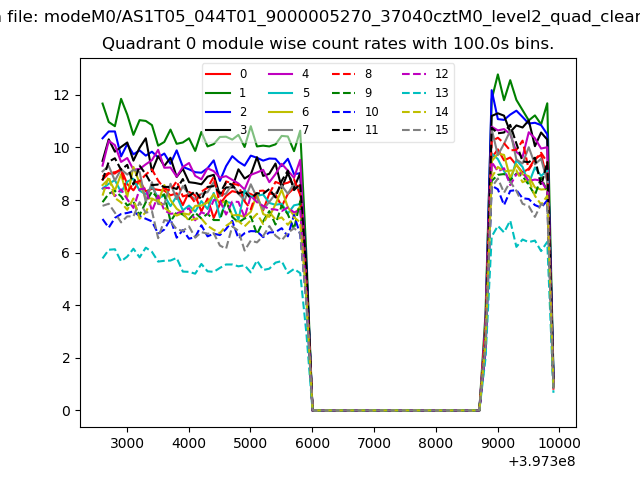 |
 |
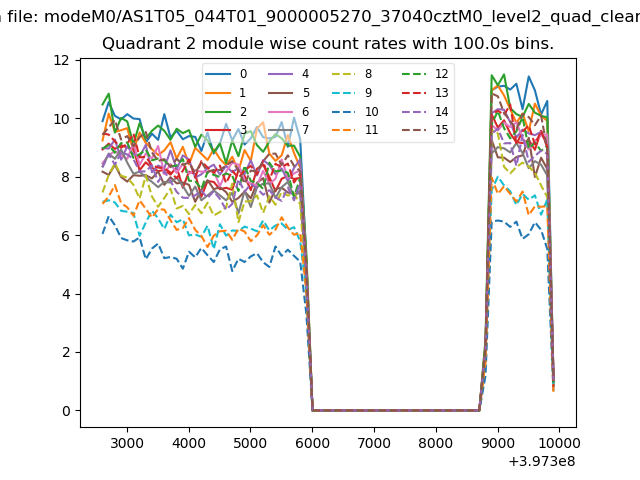
| Module-wise count rates for Quadrant B Data is divided into 100 sec bins |
 |
 |
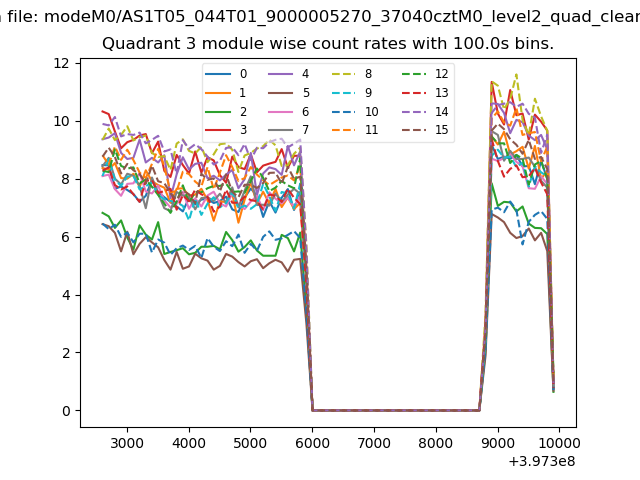
| Module-wise count rates for Quadrant C Data is divided into 100 sec bins |
 |
 |
| Module-wise count rates for Quadrant D Data is divided into 100 sec bins |
 |
 |
| Parameter | Plot |
|---|---|
| CZT HV Monitor | 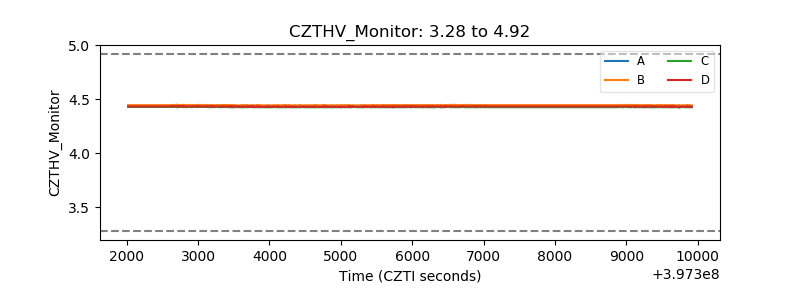 |
| D_VDD | 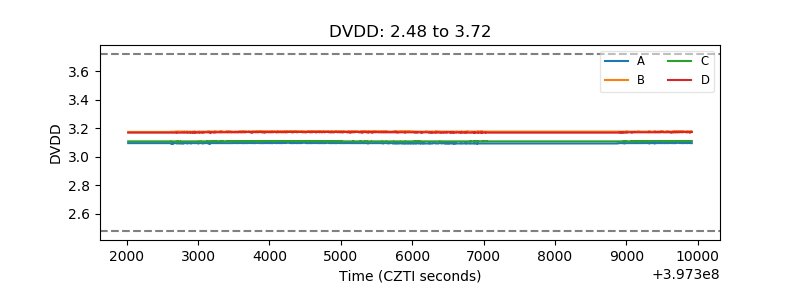 |
| Temperature 1 | 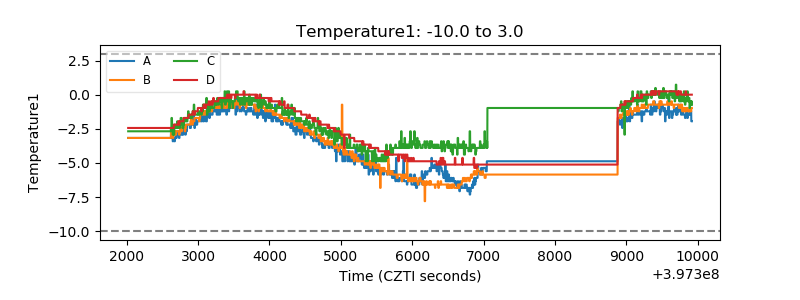 |
| Veto HV Monitor | 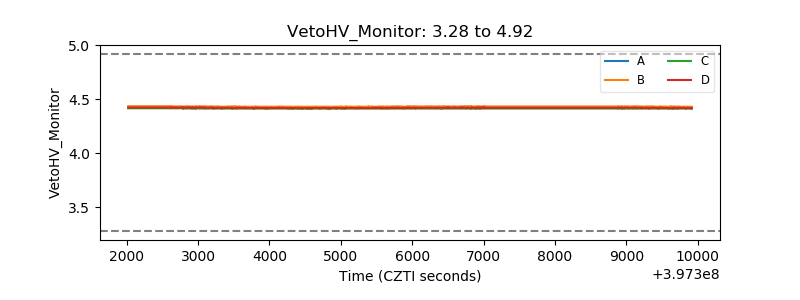 |
| Veto LLD | 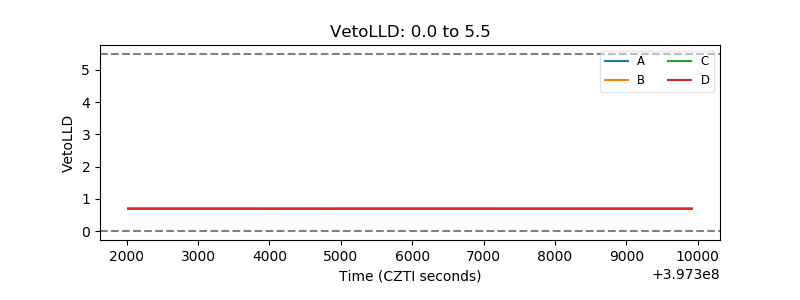 |
| Alpha Counter | 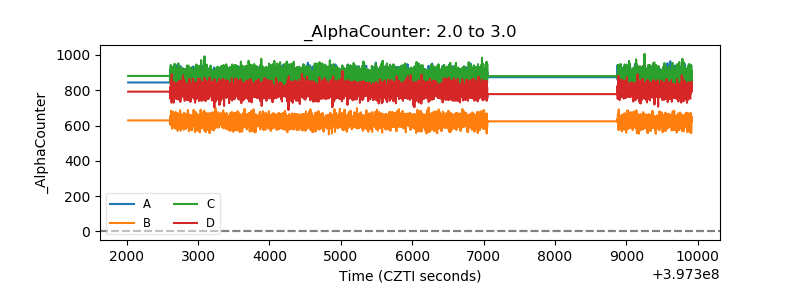 |
| _CPM_Rate | 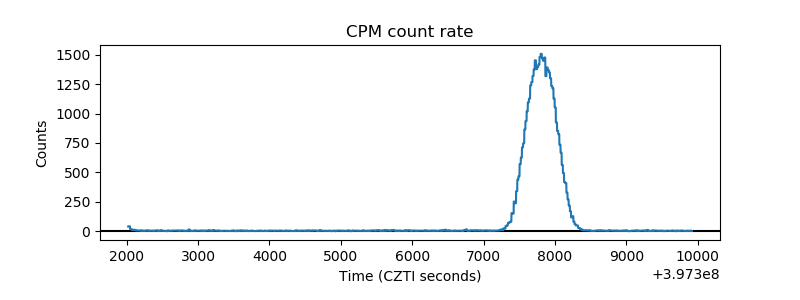 |
| CZT Counter | 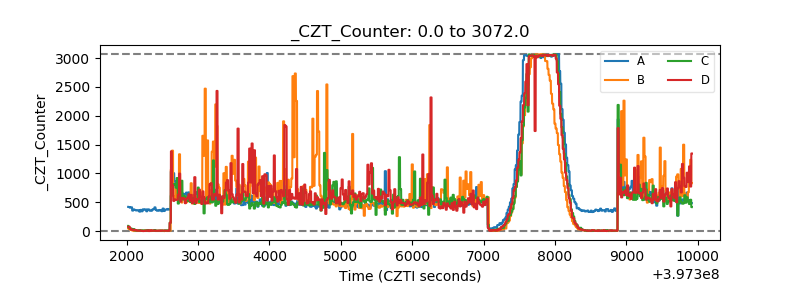 |
| +2.5 Volts monitor | 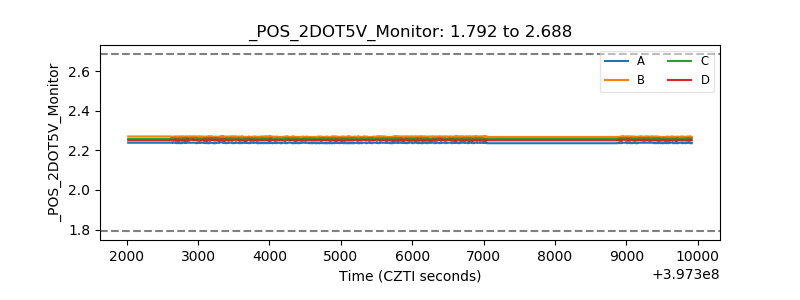 |
| +5 Volts monitor | 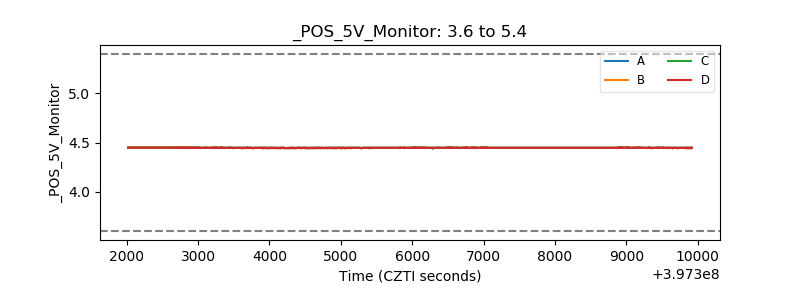 |
| _ROLL_ROT | 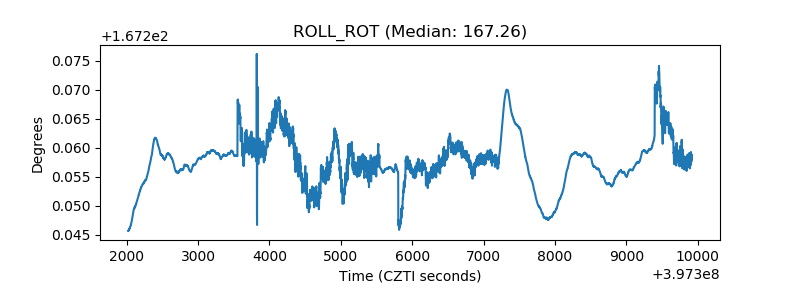 |
| _Roll_DEC | 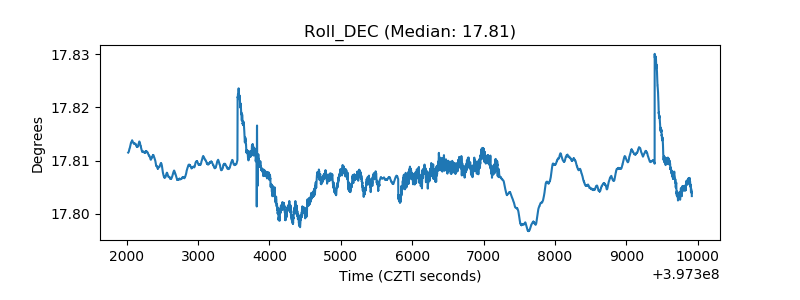 |
| _Roll_RA | 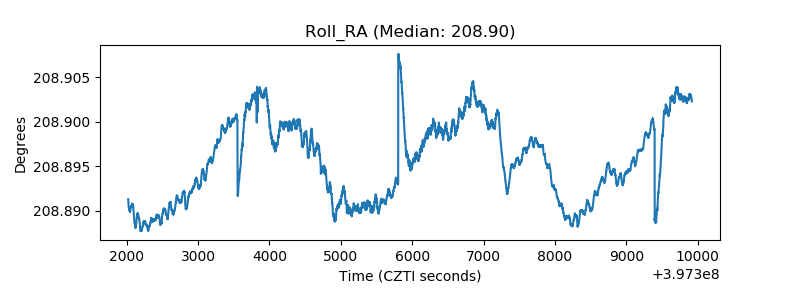 |
| Veto Counter | 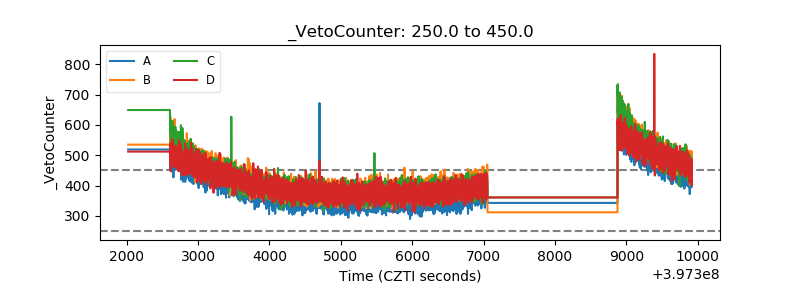 |