| Param | Original file | Final file |
|---|---|---|
| Filename | modeM0/AS1T05_044T01_9000005270_37041cztM0_level2.evt | modeM0/AS1T05_044T01_9000005270_37041cztM0_level2_quad_clean.evt |
| Size (bytes) | 505,837,440 | 83,865,600 |
| Size | 482.4 MB | 80.0 MB |
| Events in quadrant A | 3,053,615 | 566,802 |
| Events in quadrant B | 3,908,702 | 547,654 |
| Events in quadrant C | 3,415,003 | 540,092 |
| Events in quadrant D | 4,581,901 | 512,625 |
| Mode M0 | |||
|---|---|---|---|
| Quadrant | BADHDUFLAG | Total packets | Discarded packets |
| A | 0 | 12495 | 3 |
| B | 0 | 15139 | 2 |
| C | 0 | 13352 | 2 |
| D | 0 | 17333 | 2 |
| Mode SS | |||
|---|---|---|---|
| Quadrant | BADHDUFLAG | Total packets | Discarded packets |
| A | 0 | 108 | 0 |
| B | 0 | 108 | 0 |
| C | 0 | 108 | 0 |
| D | 0 | 108 | 0 |
| Mode M9 | |||
|---|---|---|---|
| Quadrant | BADHDUFLAG | Total packets | Discarded packets |
| A | 0 | 20 | 0 |
| B | 0 | 20 | 0 |
| C | 0 | 20 | 0 |
| D | 0 | 21 | 0 |
| Quadrant | Total seconds | Saturated seconds | Saturation percentage |
|---|---|---|---|
| A | 5320 | 20 | 0.375940% |
| B | 5320 | 319 | 5.996241% |
| C | 5320 | 106 | 1.992481% |
| D | 5320 | 286 | 5.375940% |
Noise dominated data is calculated using 1-second bins in cleaned event files. If a bin has >2000 counts, and if more than 50% of those come from <1% of pixels, then it is considered to be noise-dominated and hence unusable.
| Quadrant | # 1 sec bins | Bins with >0 counts | Bins with >2000 counts | High rate bins dominated by noise | Noise dominated (total time) | Noise dominated (detector-on time) | Marked lightcurve |
|---|---|---|---|---|---|---|---|
| A | 7233 | 5321 | 8 | 8 | 0.11% | 0.15% | 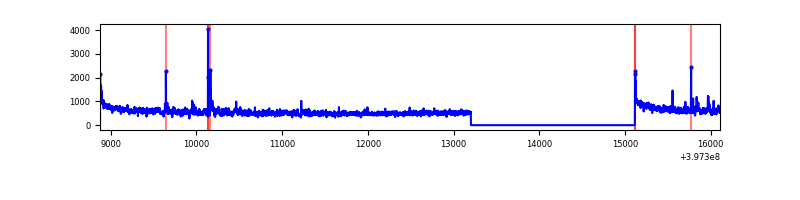 |
| B | 7233 | 5321 | 160 | 160 | 2.21% | 3.01% | 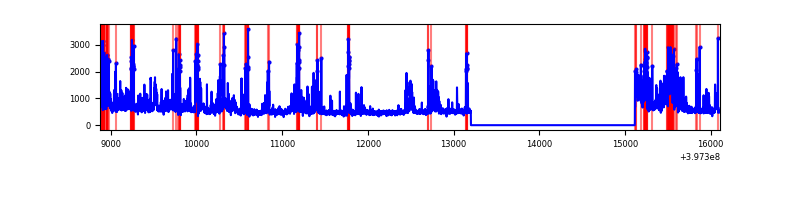 |
| C | 7233 | 5321 | 108 | 108 | 1.49% | 2.03% | 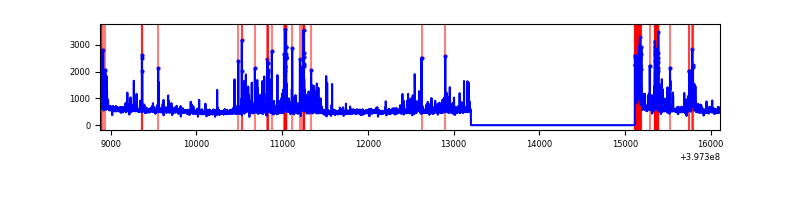 |
| D | 7233 | 5321 | 277 | 277 | 3.83% | 5.21% | 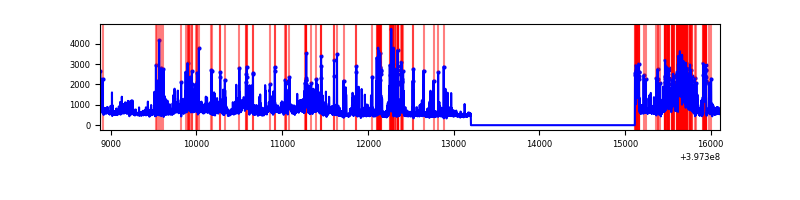 |
Top three noisy pixels from each quadrant. If the there are fewer than three noisy pixels in the level2.evt file, extra rows are filled as -1
| Pixel properties | Quadrant properties | ||||||
|---|---|---|---|---|---|---|---|
| Quadrant | DetID | PixID | Counts | Sigma | Mean | Median | Sigma |
| A | 10 | 83 | 271106 | 2069.33 | 655 | 645 | 130.7 |
| A | 11 | 254 | 201076 | 1533.53 | 655 | 645 | 130.7 |
| A | 13 | 248 | 32548 | 244.09 | 655 | 645 | 130.7 |
| B | 5 | 184 | 429820 | 3599.82 | 633 | 619 | 119.2 |
| B | 5 | 172 | 341570 | 2859.65 | 633 | 619 | 119.2 |
| B | 0 | 229 | 105288 | 877.89 | 633 | 619 | 119.2 |
| C | 15 | 214 | 232041 | 1614.05 | 623 | 629 | 143.4 |
| C | 0 | 10 | 191960 | 1334.49 | 623 | 629 | 143.4 |
| C | 14 | 254 | 177620 | 1234.47 | 623 | 629 | 143.4 |
| D | 12 | 235 | 692163 | 4557.44 | 624 | 609 | 151.7 |
| D | 2 | 250 | 537660 | 3539.24 | 624 | 609 | 151.7 |
| D | 12 | 233 | 241860 | 1589.88 | 624 | 609 | 151.7 |
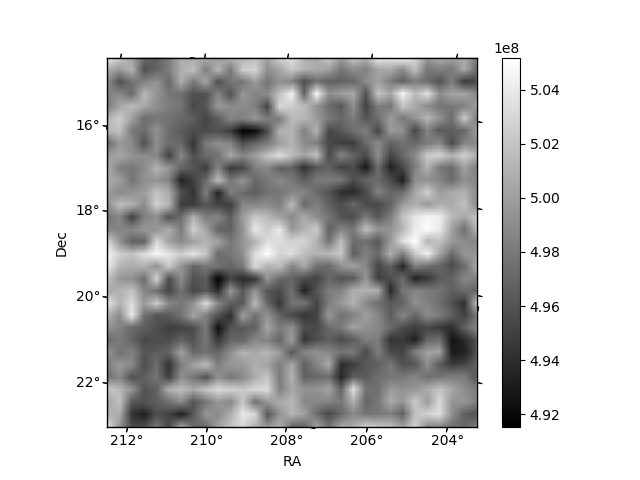
Histogram calculated using DETX and DETY for each event in the final _common_clean file
| Quadrant A | 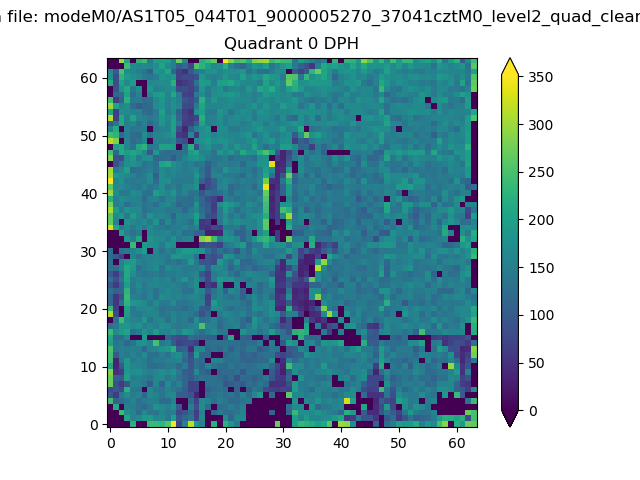 |
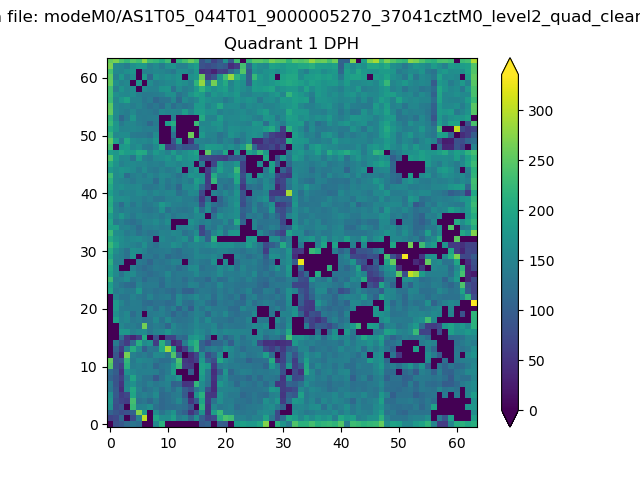 |
Quadrant B |
|---|---|---|---|
| Quadrant D | 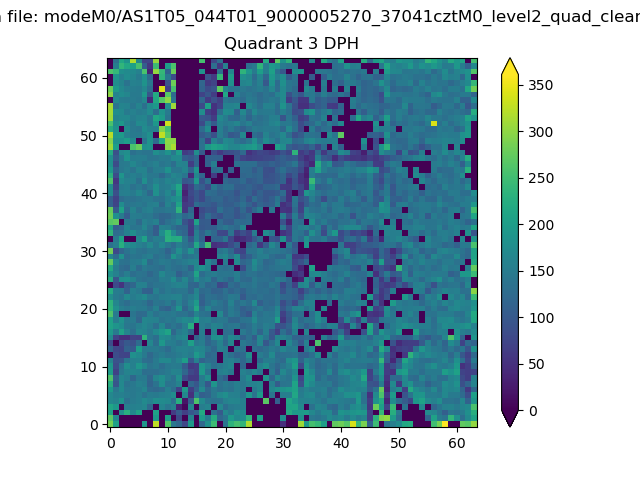 |
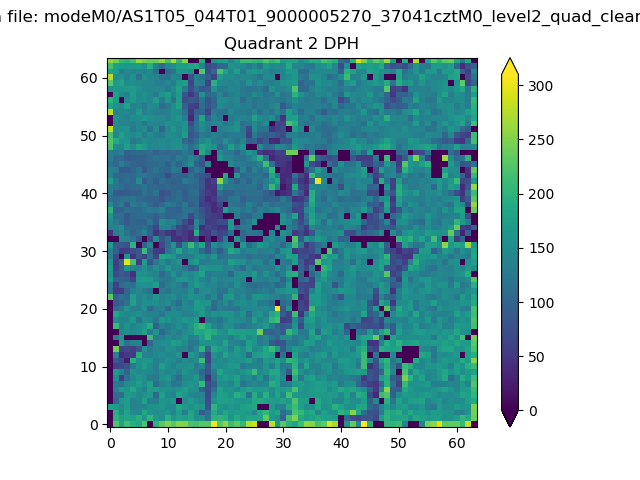 |
Quadrant C |
| Plot type | Count rate plots | Images |
|---|---|---|
| Comparison with Poisson distribution Blue bars denote a histogram of data divided into 1 sec bins. Red curve is a Poisson curve with rate = median count rate of data. |
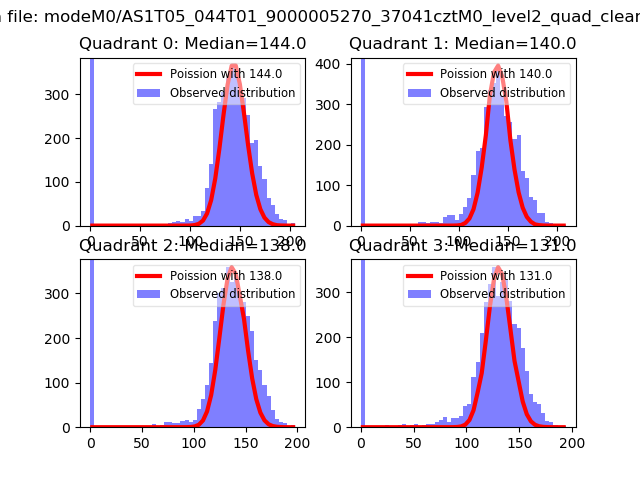 |
 |
| Quadrant-wise count rates Data is divided into 100 sec bins |
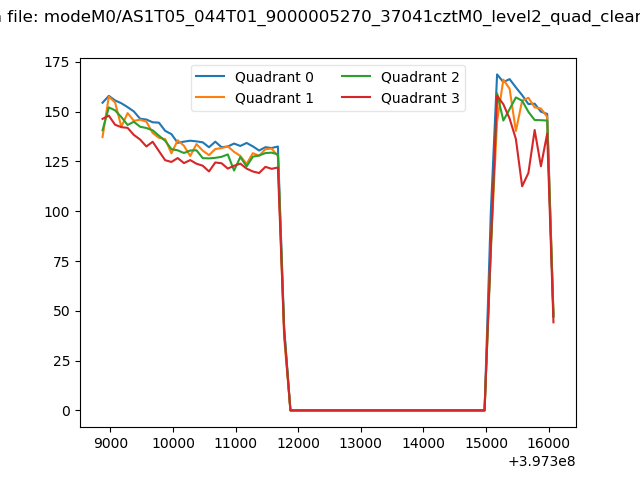 |
|
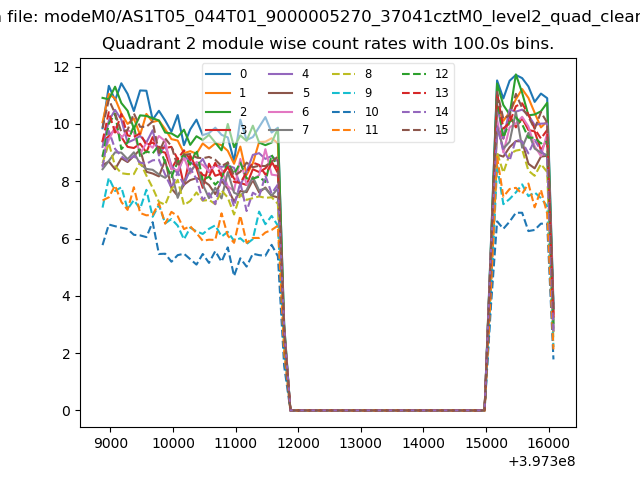
| Module-wise count rates for Quadrant A Data is divided into 100 sec bins |
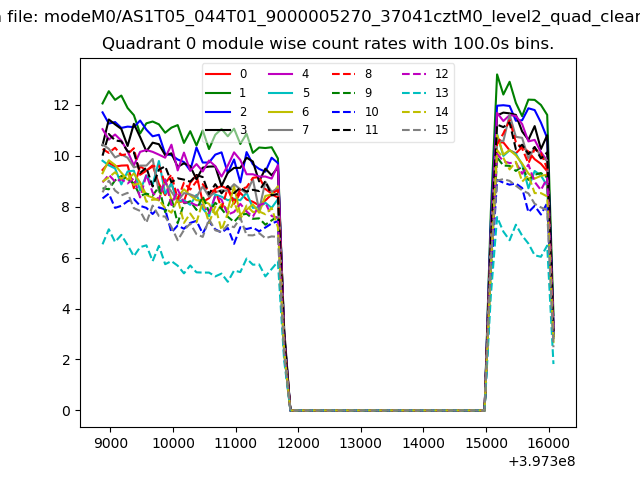 |
 |
| Module-wise count rates for Quadrant B Data is divided into 100 sec bins |
 |
 |
| Module-wise count rates for Quadrant C Data is divided into 100 sec bins |
 |
 |
| Module-wise count rates for Quadrant D Data is divided into 100 sec bins |
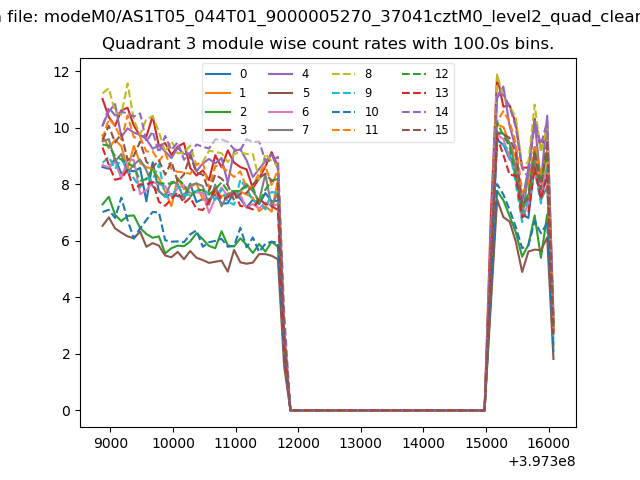 |
 |
| Parameter | Plot |
|---|---|
| CZT HV Monitor | 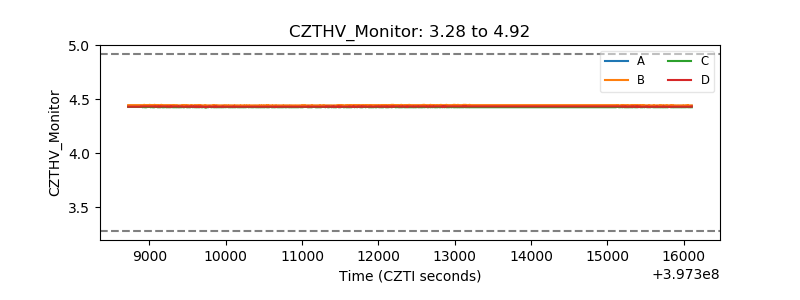 |
| D_VDD | 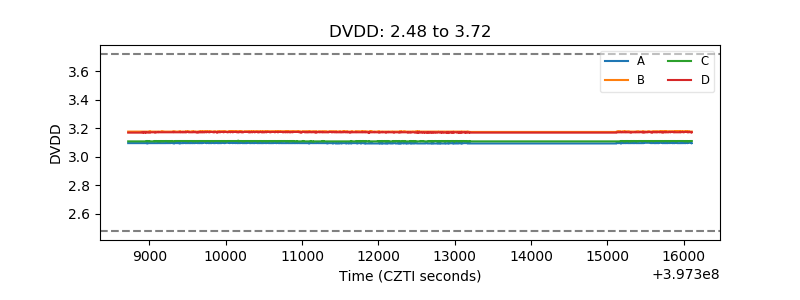 |
| Temperature 1 | 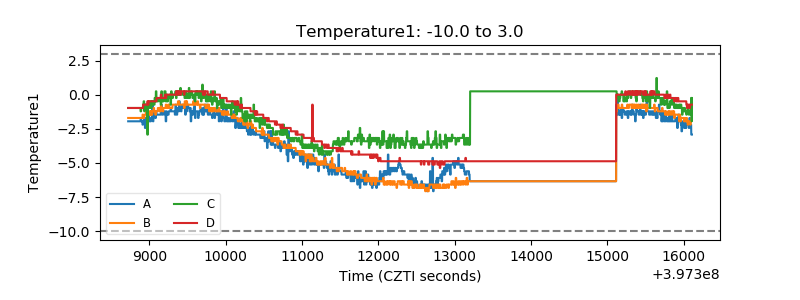 |
| Veto HV Monitor | 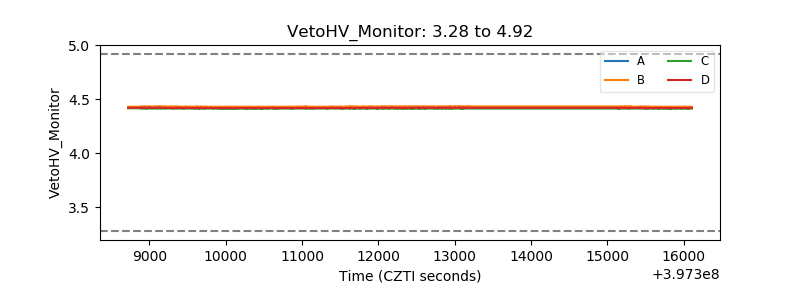 |
| Veto LLD | 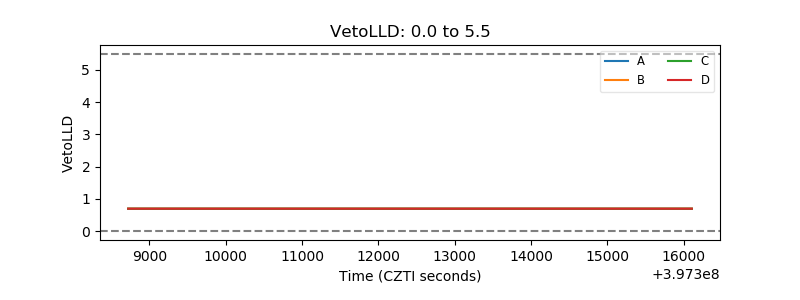 |
| Alpha Counter | 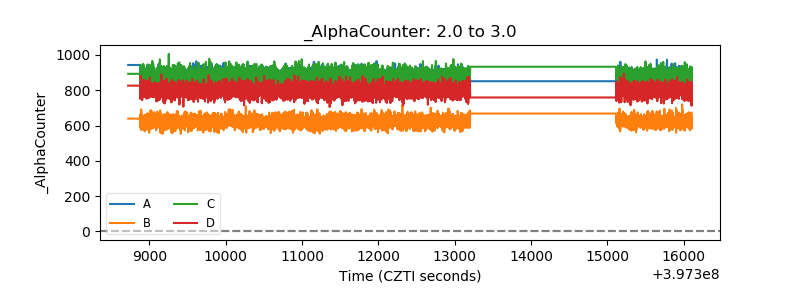 |
| _CPM_Rate | 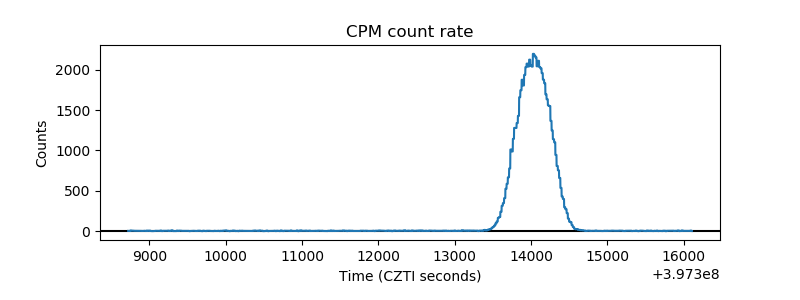 |
| CZT Counter | 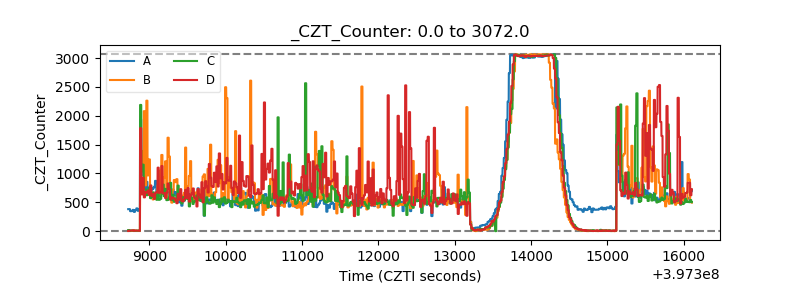 |
| +2.5 Volts monitor | 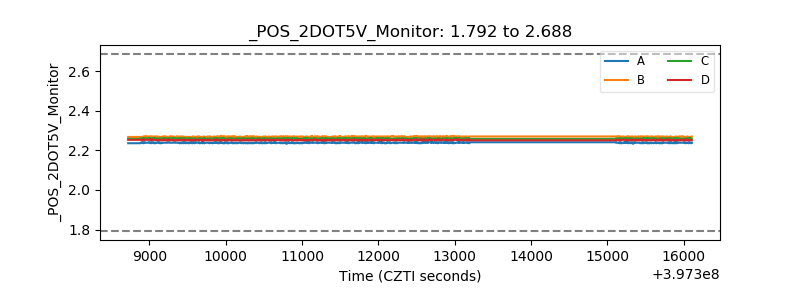 |
| +5 Volts monitor | 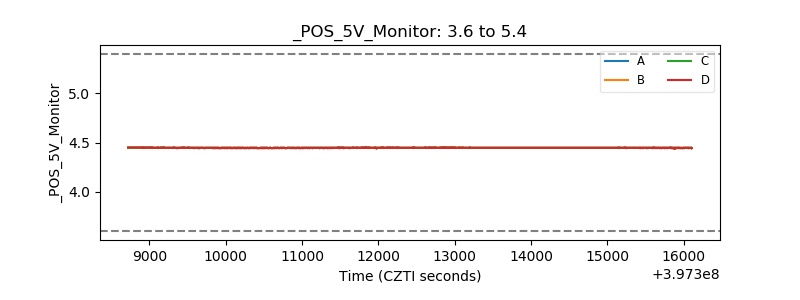 |
| _ROLL_ROT | 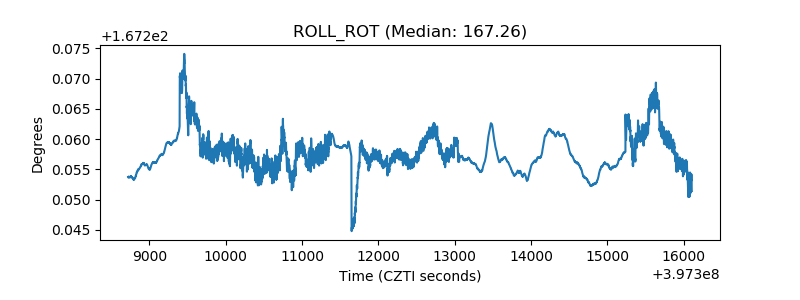 |
| _Roll_DEC | 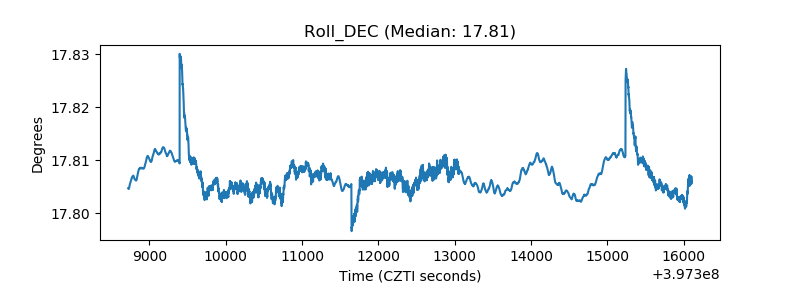 |
| _Roll_RA | 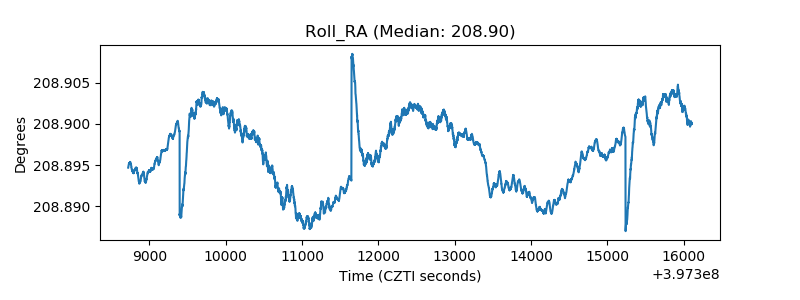 |
| Veto Counter | 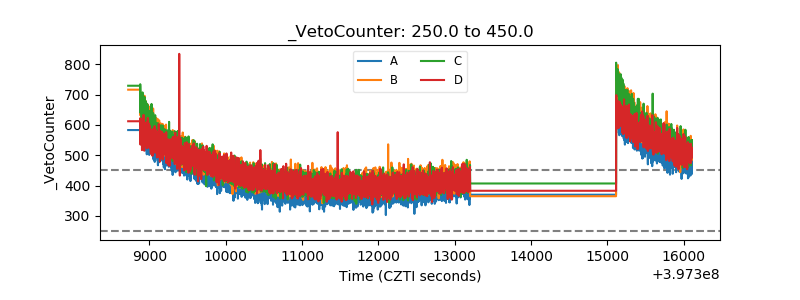 |