| Param | Original file | Final file |
|---|---|---|
| Filename | modeM0/AS1T05_044T01_9000005270_37042cztM0_level2.evt | modeM0/AS1T05_044T01_9000005270_37042cztM0_level2_quad_clean.evt |
| Size (bytes) | 529,119,360 | 75,625,920 |
| Size | 504.6 MB | 72.1 MB |
| Events in quadrant A | 3,007,806 | 515,123 |
| Events in quadrant B | 3,916,446 | 505,278 |
| Events in quadrant C | 3,854,385 | 480,203 |
| Events in quadrant D | 4,897,146 | 428,023 |
| Mode M0 | |||
|---|---|---|---|
| Quadrant | BADHDUFLAG | Total packets | Discarded packets |
| A | 0 | 12208 | 3 |
| B | 0 | 15019 | 2 |
| C | 0 | 14632 | 2 |
| D | 0 | 18059 | 2 |
| Mode SS | |||
|---|---|---|---|
| Quadrant | BADHDUFLAG | Total packets | Discarded packets |
| A | 0 | 106 | 0 |
| B | 0 | 106 | 0 |
| C | 0 | 106 | 0 |
| D | 0 | 106 | 0 |
| Mode M9 | |||
|---|---|---|---|
| Quadrant | BADHDUFLAG | Total packets | Discarded packets |
| A | 0 | 20 | 0 |
| B | 0 | 20 | 0 |
| C | 0 | 20 | 0 |
| D | 0 | 20 | 0 |
| Quadrant | Total seconds | Saturated seconds | Saturation percentage |
|---|---|---|---|
| A | 5148 | 21 | 0.407925% |
| B | 5148 | 300 | 5.827506% |
| C | 5148 | 292 | 5.672106% |
| D | 5149 | 638 | 12.390755% |
Noise dominated data is calculated using 1-second bins in cleaned event files. If a bin has >2000 counts, and if more than 50% of those come from <1% of pixels, then it is considered to be noise-dominated and hence unusable.
| Quadrant | # 1 sec bins | Bins with >0 counts | Bins with >2000 counts | High rate bins dominated by noise | Noise dominated (total time) | Noise dominated (detector-on time) | Marked lightcurve |
|---|---|---|---|---|---|---|---|
| A | 7182 | 5149 | 11 | 11 | 0.15% | 0.21% | 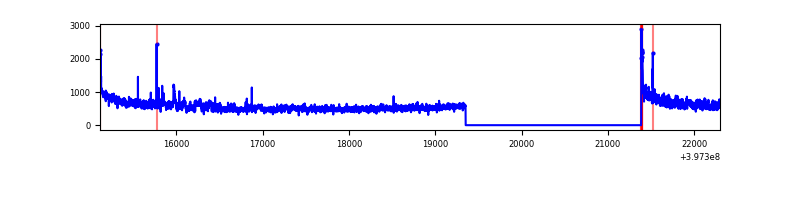 |
| B | 7182 | 5149 | 156 | 156 | 2.17% | 3.03% | 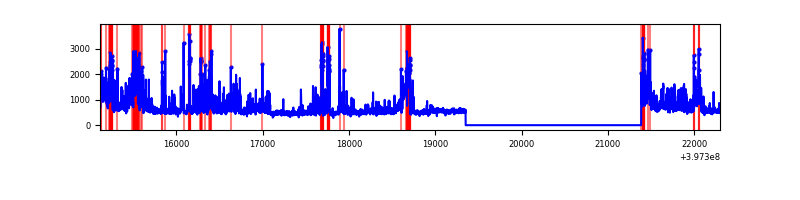 |
| C | 7182 | 5149 | 291 | 291 | 4.05% | 5.65% | 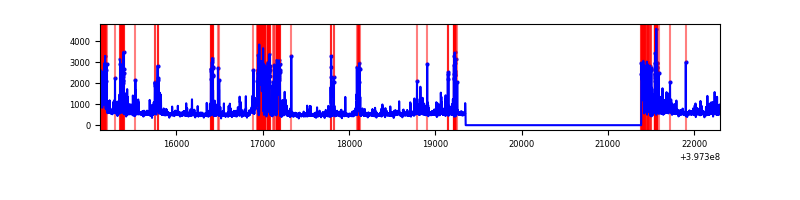 |
| D | 7183 | 5150 | 604 | 604 | 8.41% | 11.73% | 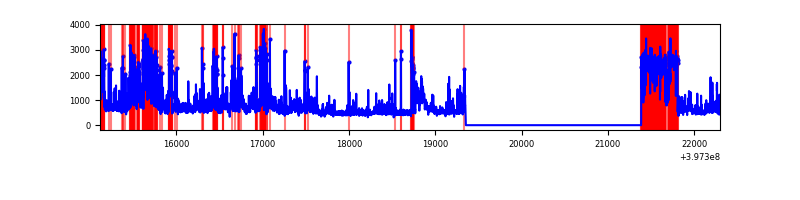 |
Top three noisy pixels from each quadrant. If the there are fewer than three noisy pixels in the level2.evt file, extra rows are filled as -1
| Pixel properties | Quadrant properties | ||||||
|---|---|---|---|---|---|---|---|
| Quadrant | DetID | PixID | Counts | Sigma | Mean | Median | Sigma |
| A | 10 | 83 | 268955 | 2082.39 | 641 | 631 | 128.9 |
| A | 11 | 254 | 230222 | 1781.79 | 641 | 631 | 128.9 |
| A | 13 | 248 | 17204 | 128.62 | 641 | 631 | 128.9 |
| B | 5 | 184 | 347904 | 2978.0 | 626 | 614 | 116.6 |
| B | 0 | 182 | 239397 | 2047.55 | 626 | 614 | 116.6 |
| B | 5 | 172 | 230362 | 1970.08 | 626 | 614 | 116.6 |
| C | 10 | 20 | 446447 | 3201.88 | 605 | 612 | 139.2 |
| C | 0 | 10 | 316385 | 2267.81 | 605 | 612 | 139.2 |
| C | 14 | 254 | 231985 | 1661.66 | 605 | 612 | 139.2 |
| D | 2 | 250 | 1115986 | 7789.17 | 582 | 568 | 143.2 |
| D | 12 | 233 | 500038 | 3487.89 | 582 | 568 | 143.2 |
| D | 12 | 235 | 325185 | 2266.86 | 582 | 568 | 143.2 |
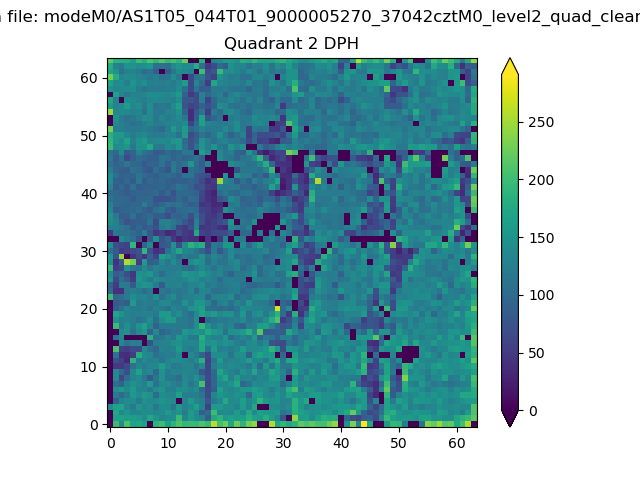
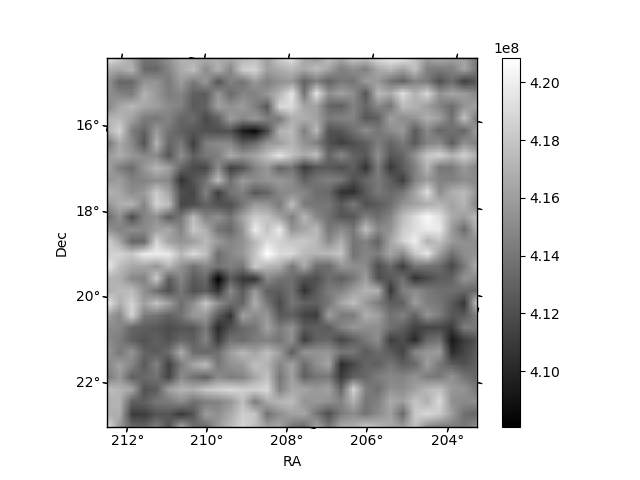
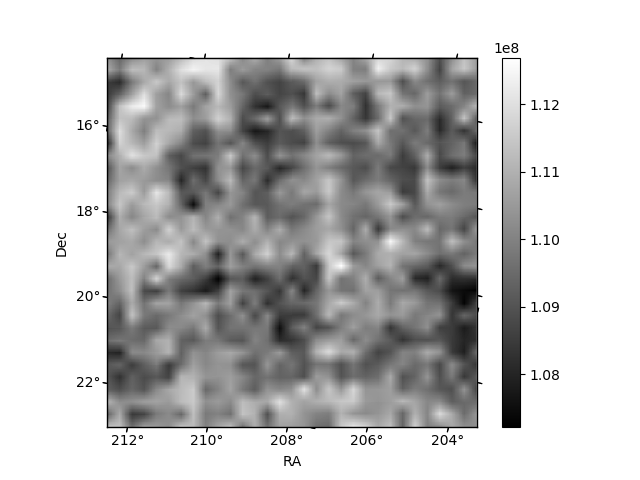
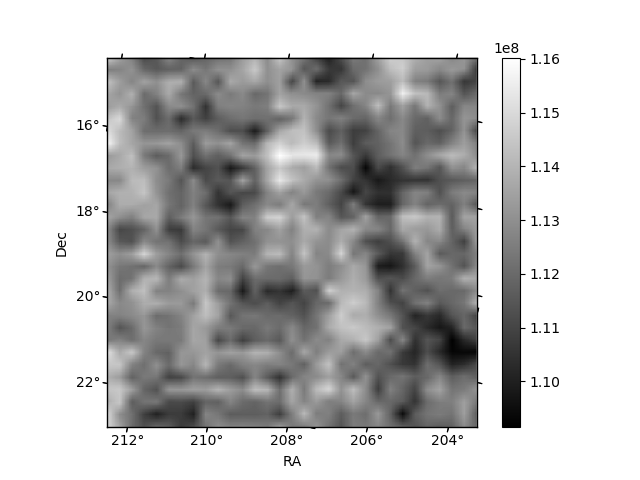
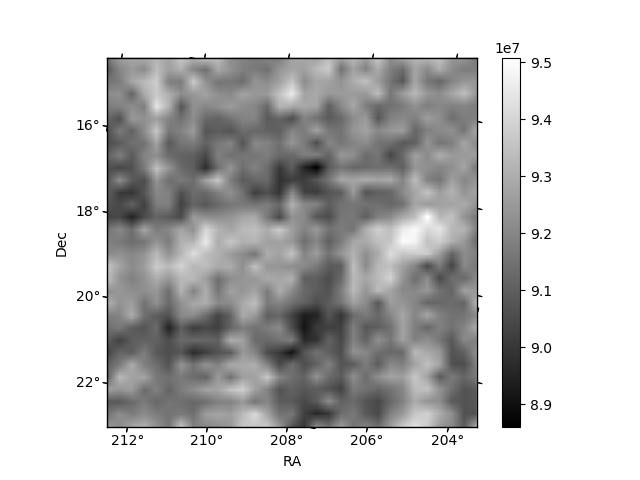
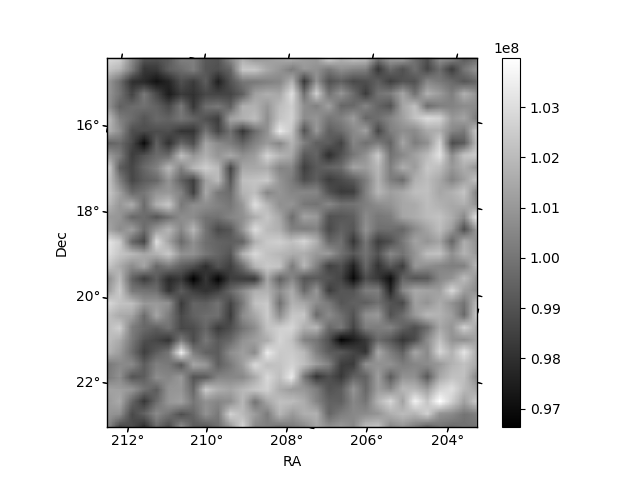
Histogram calculated using DETX and DETY for each event in the final _common_clean file
| Quadrant A | 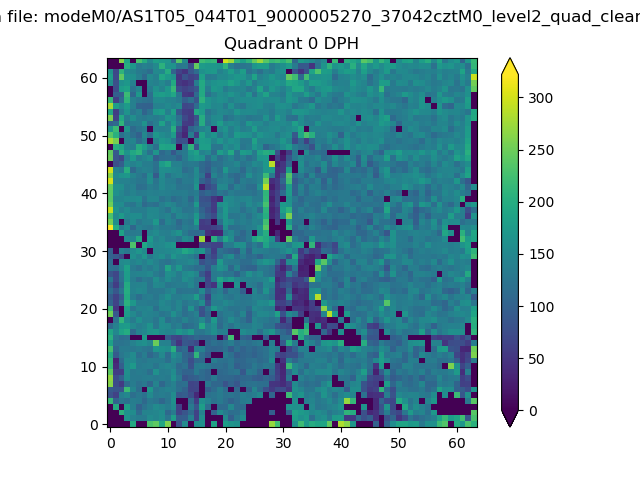 |
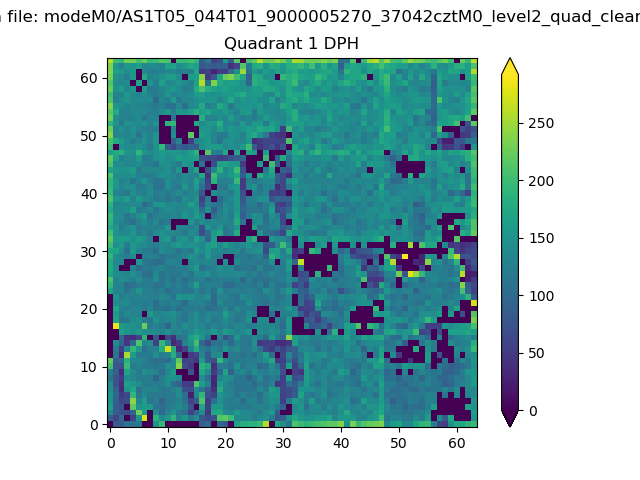 |
Quadrant B |
|---|---|---|---|
| Quadrant D | 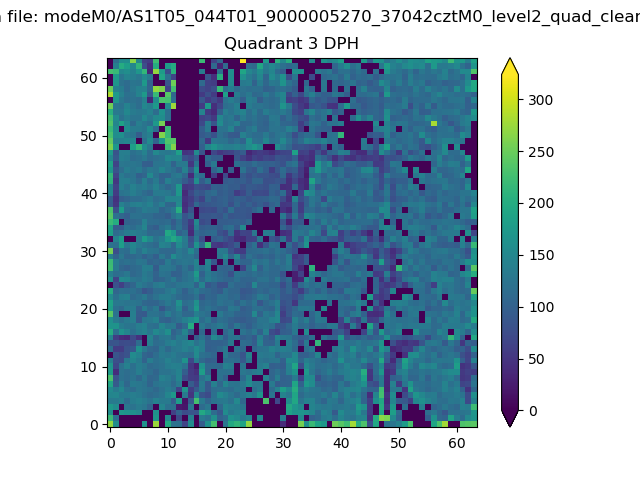 |
 |
Quadrant C |
| Plot type | Count rate plots | Images |
|---|---|---|
| Comparison with Poisson distribution Blue bars denote a histogram of data divided into 1 sec bins. Red curve is a Poisson curve with rate = median count rate of data. |
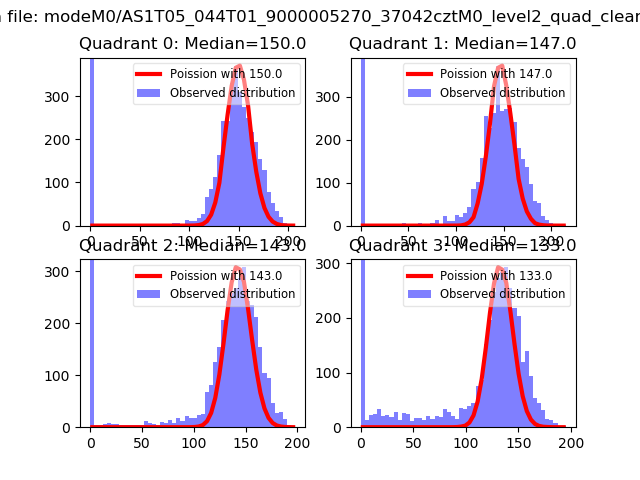 |
 |
| Quadrant-wise count rates Data is divided into 100 sec bins |
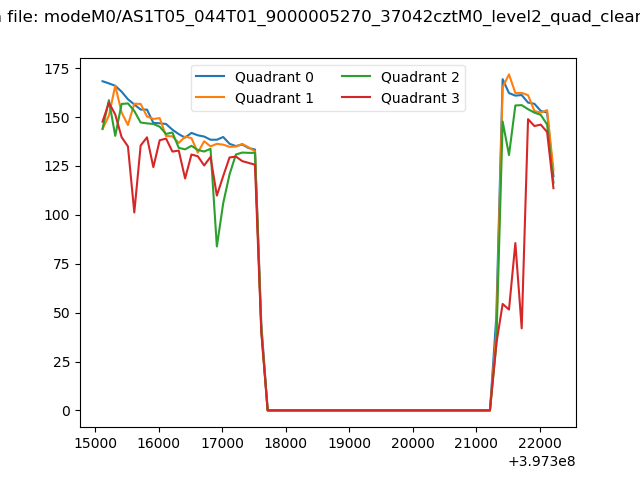 |
|
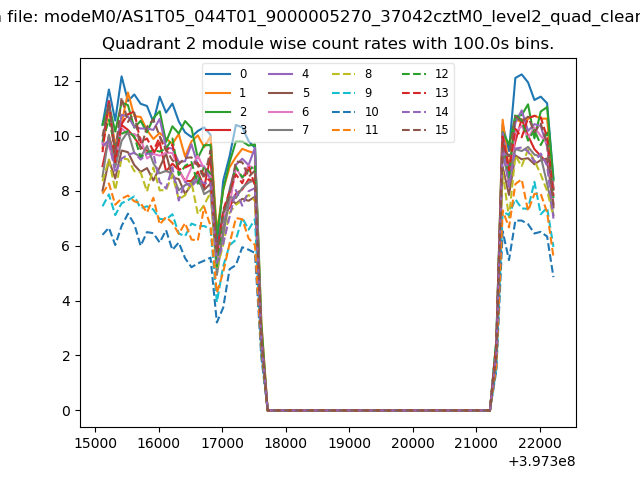
| Module-wise count rates for Quadrant A Data is divided into 100 sec bins |
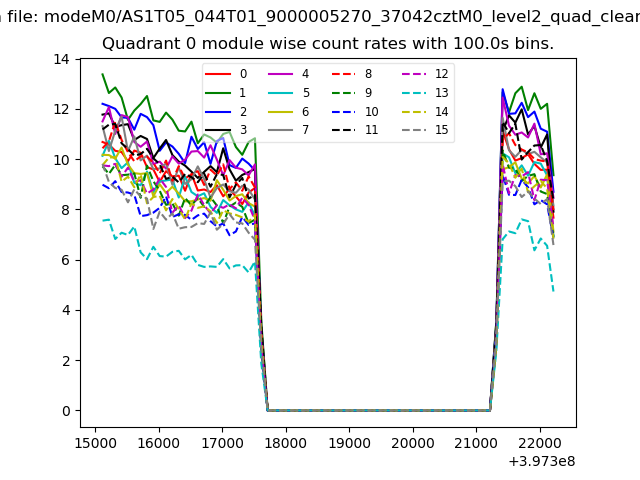 |
 |
| Module-wise count rates for Quadrant B Data is divided into 100 sec bins |
 |
 |
| Module-wise count rates for Quadrant C Data is divided into 100 sec bins |
 |
 |
| Module-wise count rates for Quadrant D Data is divided into 100 sec bins |
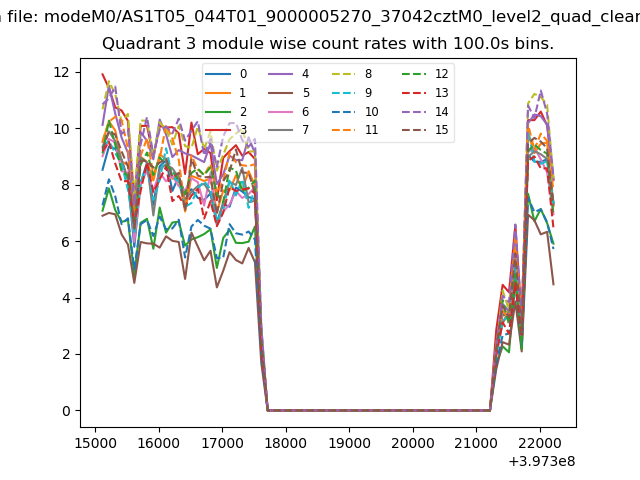 |
 |
| Parameter | Plot |
|---|---|
| CZT HV Monitor | 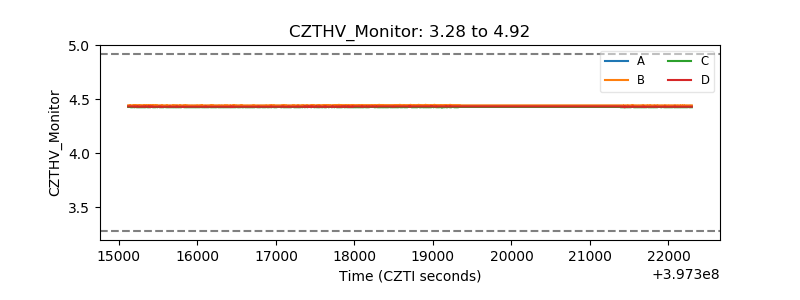 |
| D_VDD | 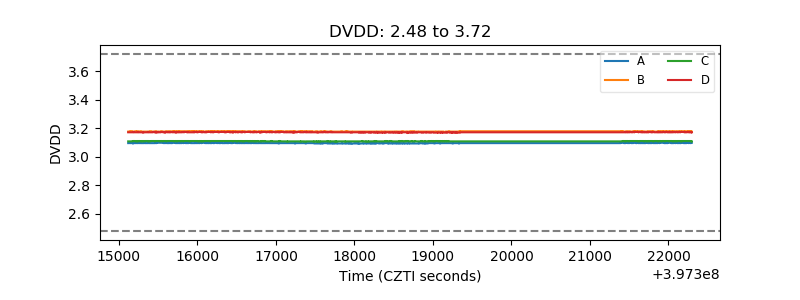 |
| Temperature 1 | 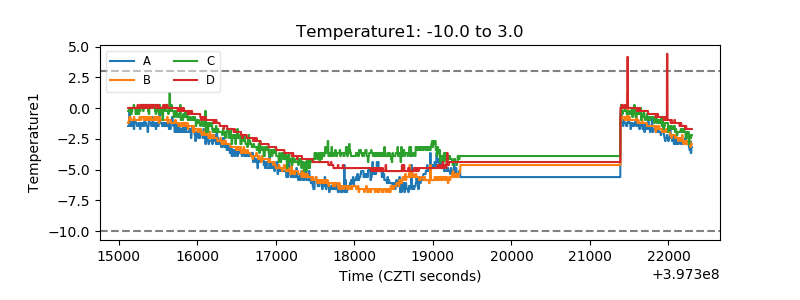 |
| Veto HV Monitor | 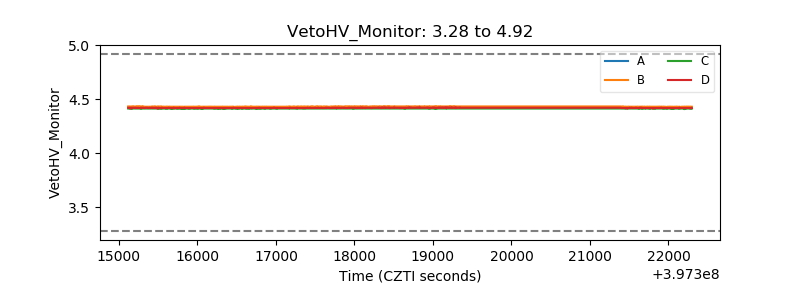 |
| Veto LLD | 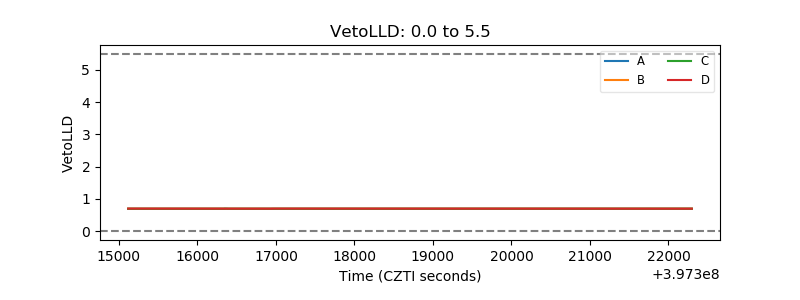 |
| Alpha Counter | 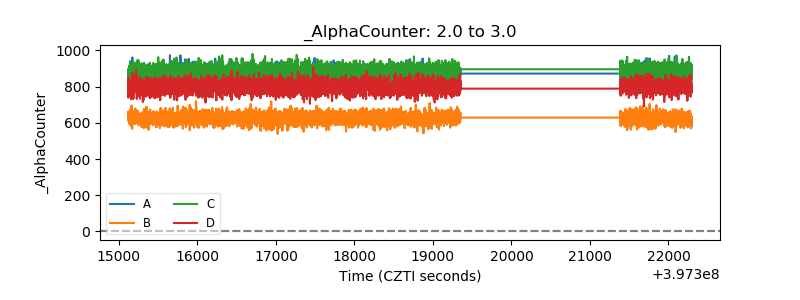 |
| _CPM_Rate | 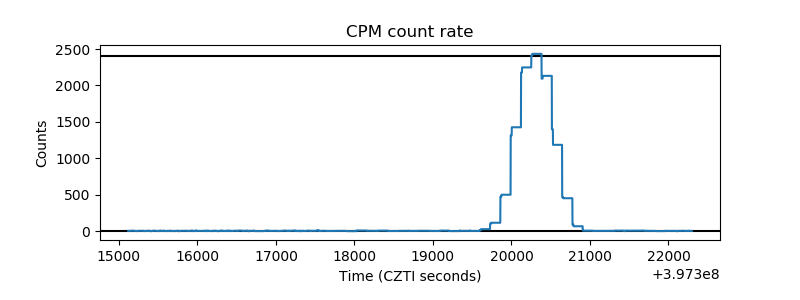 |
| CZT Counter | 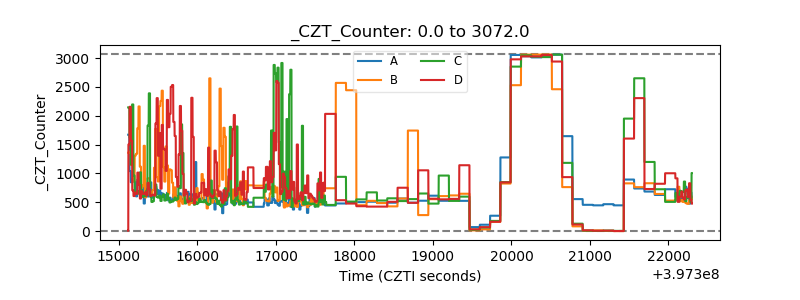 |
| +2.5 Volts monitor | 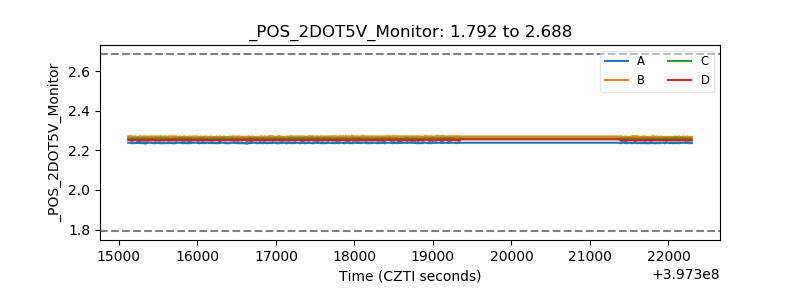 |
| +5 Volts monitor | 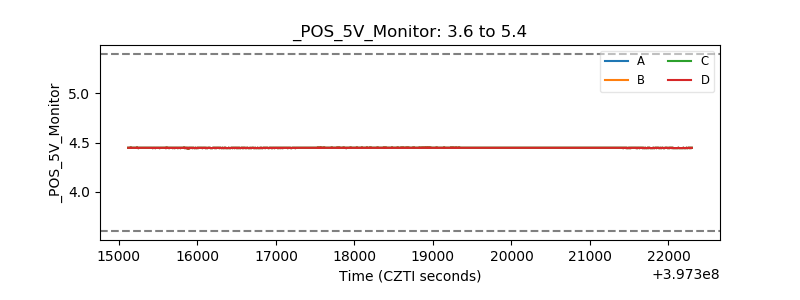 |
| _ROLL_ROT | 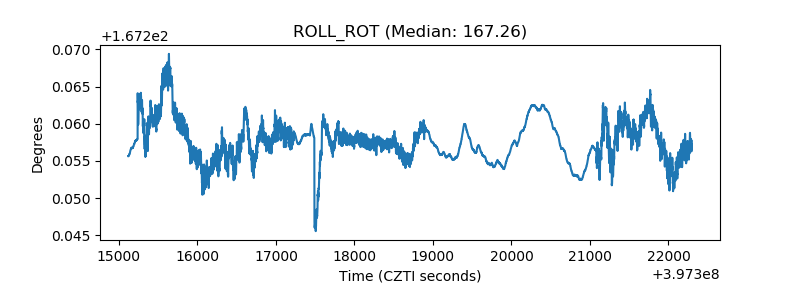 |
| _Roll_DEC | 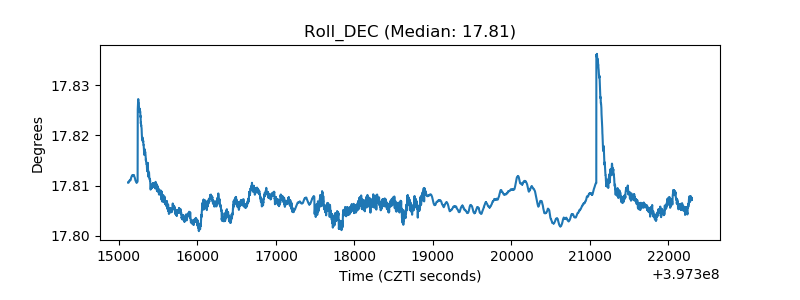 |
| _Roll_RA | 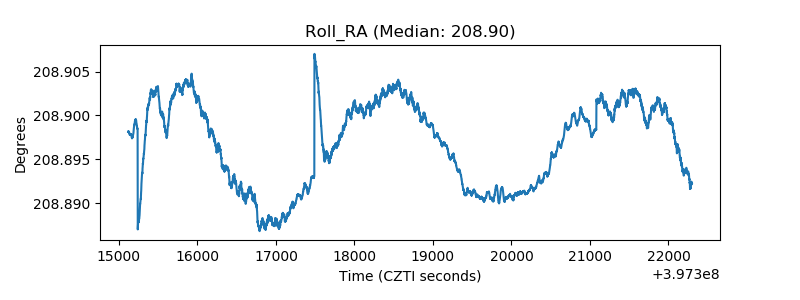 |
| Veto Counter | 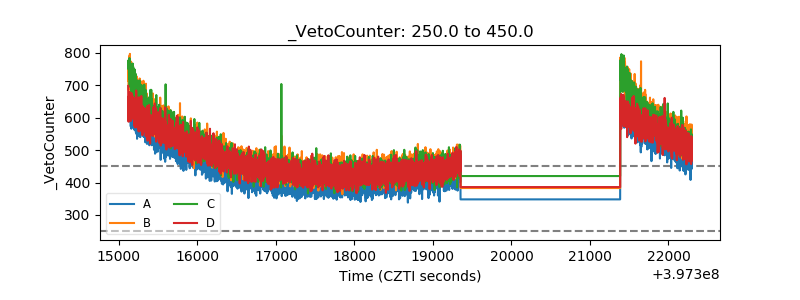 |